EP0548983B1 - Method for determining reticulocytes - Google Patents
Method for determining reticulocytes Download PDFInfo
- Publication number
- EP0548983B1 EP0548983B1 EP92121974A EP92121974A EP0548983B1 EP 0548983 B1 EP0548983 B1 EP 0548983B1 EP 92121974 A EP92121974 A EP 92121974A EP 92121974 A EP92121974 A EP 92121974A EP 0548983 B1 EP0548983 B1 EP 0548983B1
- Authority
- EP
- European Patent Office
- Prior art keywords
- reticulocytes
- aperture
- accordance
- signal
- flow
- Prior art date
- Legal status (The legal status is an assumption and is not a legal conclusion. Google has not performed a legal analysis and makes no representation as to the accuracy of the status listed.)
- Expired - Lifetime
Links
- 210000001995 reticulocyte Anatomy 0.000 title claims description 90
- 238000000034 method Methods 0.000 title claims description 36
- 239000002245 particle Substances 0.000 claims description 49
- 239000007788 liquid Substances 0.000 claims description 37
- 238000010586 diagram Methods 0.000 claims description 25
- 238000001514 detection method Methods 0.000 claims description 24
- 210000004369 blood Anatomy 0.000 claims description 16
- 239000008280 blood Substances 0.000 claims description 16
- 239000007850 fluorescent dye Substances 0.000 claims description 10
- 239000011246 composite particle Substances 0.000 claims description 5
- 238000005286 illumination Methods 0.000 claims description 5
- DPKHZNPWBDQZCN-UHFFFAOYSA-N acridine orange free base Chemical compound C1=CC(N(C)C)=CC2=NC3=CC(N(C)C)=CC=C3C=C21 DPKHZNPWBDQZCN-UHFFFAOYSA-N 0.000 claims description 3
- DZBUGLKDJFMEHC-UHFFFAOYSA-N benzoquinolinylidene Natural products C1=CC=CC2=CC3=CC=CC=C3N=C21 DZBUGLKDJFMEHC-UHFFFAOYSA-N 0.000 claims description 3
- 238000010186 staining Methods 0.000 claims description 3
- 238000011144 upstream manufacturing Methods 0.000 claims description 3
- JPIYZTWMUGTEHX-UHFFFAOYSA-N auramine O free base Chemical compound C1=CC(N(C)C)=CC=C1C(=N)C1=CC=C(N(C)C)C=C1 JPIYZTWMUGTEHX-UHFFFAOYSA-N 0.000 claims 1
- 210000004027 cell Anatomy 0.000 description 20
- 210000003743 erythrocyte Anatomy 0.000 description 12
- 230000003287 optical effect Effects 0.000 description 9
- 238000005259 measurement Methods 0.000 description 8
- KSCQDDRPFHTIRL-UHFFFAOYSA-N auramine O Chemical compound [H+].[Cl-].C1=CC(N(C)C)=CC=C1C(=N)C1=CC=C(N(C)C)C=C1 KSCQDDRPFHTIRL-UHFFFAOYSA-N 0.000 description 6
- 239000002131 composite material Substances 0.000 description 4
- 208000015710 Iron-Deficiency Anemia Diseases 0.000 description 3
- 210000000601 blood cell Anatomy 0.000 description 3
- 238000000684 flow cytometry Methods 0.000 description 3
- 210000000265 leukocyte Anatomy 0.000 description 3
- XKRFYHLGVUSROY-UHFFFAOYSA-N Argon Chemical compound [Ar] XKRFYHLGVUSROY-UHFFFAOYSA-N 0.000 description 2
- 230000009286 beneficial effect Effects 0.000 description 2
- 230000015572 biosynthetic process Effects 0.000 description 2
- 210000001772 blood platelet Anatomy 0.000 description 2
- 238000004140 cleaning Methods 0.000 description 2
- 201000010099 disease Diseases 0.000 description 2
- 208000037265 diseases, disorders, signs and symptoms Diseases 0.000 description 2
- 239000012530 fluid Substances 0.000 description 2
- 230000002093 peripheral effect Effects 0.000 description 2
- 229920006395 saturated elastomer Polymers 0.000 description 2
- VYPSYNLAJGMNEJ-UHFFFAOYSA-N Silicium dioxide Chemical compound O=[Si]=O VYPSYNLAJGMNEJ-UHFFFAOYSA-N 0.000 description 1
- 230000002159 abnormal effect Effects 0.000 description 1
- 208000007502 anemia Diseases 0.000 description 1
- 229910052786 argon Inorganic materials 0.000 description 1
- 210000001185 bone marrow Anatomy 0.000 description 1
- 238000007796 conventional method Methods 0.000 description 1
- 230000003247 decreasing effect Effects 0.000 description 1
- 239000012895 dilution Substances 0.000 description 1
- 238000010790 dilution Methods 0.000 description 1
- 230000000694 effects Effects 0.000 description 1
- 239000005350 fused silica glass Substances 0.000 description 1
- 238000007689 inspection Methods 0.000 description 1
- 230000031700 light absorption Effects 0.000 description 1
- 239000012528 membrane Substances 0.000 description 1
- 239000011259 mixed solution Substances 0.000 description 1
- 238000011084 recovery Methods 0.000 description 1
- 210000003660 reticulum Anatomy 0.000 description 1
- 239000000243 solution Substances 0.000 description 1
Images


Classifications
-
- G—PHYSICS
- G01—MEASURING; TESTING
- G01N—INVESTIGATING OR ANALYSING MATERIALS BY DETERMINING THEIR CHEMICAL OR PHYSICAL PROPERTIES
- G01N15/00—Investigating characteristics of particles; Investigating permeability, pore-volume, or surface-area of porous materials
- G01N15/10—Investigating individual particles
- G01N15/14—Electro-optical investigation, e.g. flow cytometers
- G01N15/1456—Electro-optical investigation, e.g. flow cytometers without spatial resolution of the texture or inner structure of the particle, e.g. processing of pulse signals
- G01N15/1459—Electro-optical investigation, e.g. flow cytometers without spatial resolution of the texture or inner structure of the particle, e.g. processing of pulse signals the analysis being performed on a sample stream
-
- G—PHYSICS
- G01—MEASURING; TESTING
- G01N—INVESTIGATING OR ANALYSING MATERIALS BY DETERMINING THEIR CHEMICAL OR PHYSICAL PROPERTIES
- G01N15/00—Investigating characteristics of particles; Investigating permeability, pore-volume, or surface-area of porous materials
- G01N15/10—Investigating individual particles
- G01N15/12—Coulter-counters
-
- G01N2015/014—
-
- G01N2015/1019—
-
- G01N2015/133—
Definitions
- This invention relates to a method for determining characteristics of a group of particles in which particles such as biological cells flow through a detection area in an aligned manner so as to simultaneously detect electrical characteristics and optical characteristics with respect to individual particles.
- this invention relates to a method by which distribution form of reticulocytes may be accurately determined.
- a flow cytometry method for example, is known in the art as a method for analyzing particles, such as blood cells.
- particles are flown in a sheathed flow, so as to detect scattering light or fluorescence emitted from a particle passing through an area illuminated by light beam.
- Japanese Patent Public Disclosure No. 1-308964 discloses a method for classifying reticulocytes particles into groups by means of a two-dimensional particle size distribution diagram which utilizes relative intensity of forward scattering light and relative intensity of fluorescence as coordinate axis. Such intensities are obtained by passing blood specimen stained with a fluorescent dye through a flow cell so as to measure forward scattering light and fluorescence by mean of a flow cytometer.
- Fig. 9 shows such a two-dimensional distribution diagram.
- A, B and C respectively indicate regions in which mature red blood cells, reticulocytes, and blood platelets are classified. It is possible to obtain number of reticulocytes and a ratio of reticulocytes in the blood by calculating the number of particles in each of the regions.
- relative intensity of forward scattering light generally corresponds to a particular particle size. It is to be noted, however, that the above relative intensity does not accurately reflect individual particle sizes due to influence of particle shape, change in the degree of light absorption caused by difference in the degree of stain, or change in refractive index of particles.
- An electric resistance method (electric impedance method), known, like a flow cytometry method mentioned above, as a method for analyzing particles such as blood cells, is believed in general to be superior in obtaining accurate volume of individual particles.
- electric resistance method electric current is supplied to an aperture so as to detect change in impedance occurring when a particle passes through the aperture.
- a two-dimensional particle size distribution diagram accurately representing information regarding particle volume may be obtained when providing a composite detection apparatus in which electric resistance detection and optical detection are combined, so as to obtain a signal on the basis of change in the electric resistance, in place of using the scattering light detection. It is also assumed that new information regarding reticulocytes, which could not have been obtained heretofore, may be obtained.
- US-A-5006986 which belongs to the present applicants and which discloses a method for determining reticulocytes by means of a composite particle detection means including an aperture through which a flow of sample liquid containing blood specimen suspended therein passes, the aperture being illuminated by a light beam, the method comprising the steps of staining said reticulocytes in the blood specimen with a fluorescent dye, passing a flow of the sample liquid containing said reticulocytes through the aperture, detecting, with respect to individual particles passing through said aperture, a first signal on the basis of amount of fluorescence generated by said illumination of light beam, preparing a two-dimensional particle size distribution diagram using the intensity of said first signal as one axis of said diagram, classifying said reticulocytes in said two-dimensional particle size distribution into plural groups, and analyzing distribution mode of said classified reticulocytes groups so as to calculate a predetermined index number.
- Acridine orange and auramine O may be used as a fluorescent dye.
- Index numbers to be calculated include a ratio of reticulocytes in the blood sample, mean particle volume of reticulocytes, growth index of reticulocytes, mean volume of reticulocytes of different maturity levels.
- a two-dimensional particle distribution diagram is prepared using signal intensity of electric impedance as Y-axis and fluorescent intensity as X-axis.
- Growth index of reticulocytes is obtained from inclination of reticulocytes distribution.
- the reticulocytes distribution is classified into several small regions depending upon fluorescent intensity, so as to calculate mean volume of reticulocytes of each of the small regions. Thus, volume of reticulocytes in each maturity level can be obtained.
- Fig. 1 is a perspective view illustrating a composite particle detection apparatus (means), in its entirety, for use in carrying out a method for determining reticulocytes in accordance with the invention.
- Fig. 2 is a side elevational view, in section, of main part of the apparatus shown in Fig. 1.
- Fig. 3 is an enlarged illustrative view of an aperture portion of the apparatus of Fig. 1
- Fig. 4 illustrates a fluid circuit of the apparatus of Fig. 1 for supplying a sample liquid through the aperture using a sheath liquid as an outer layer.
- Fig. 5 shows a two-dimensional particle distribution diagram in which measurement result in accordance with method of the invention is pictorially illustrated.
- Fig. 6 shows a diagram for measurement result in accordance with the method of the invention.
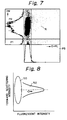
- Fig. 7 shows a two-dimensional particle distribution diagram obtained from a specimen suffering from iron deficiency anemia in accordance with the method of the invention.
- Fig. 8 shows a two-dimensional particle distribution diagram in which measurement result in accordance with prior art method is illustrated.
- Fig. 9 shows a two-dimensional particle distribution diagram illustrating prior art classifying method.
- Fig. 1 is a generic perspective view of a composite particle detection apparatus or means for use in the method for determining reticulocytes or reticular cell according to the invention.
- Fig. 2 is a vertical sectional view of main part of the detection apparatus.
- Fig. 3 is an illustrative, enlarged view of a portion having a micropore or aperture therein of the detection apparatus of the invention.
- a composite detection apparatus is disclosed for example in Japanese Patent Publication No. 56-13266 and United States Patent 3,710,933.
- a means for detecting an electric resistance and a means for conducting optical detection are disposed at different positions.
- a signal delay means so as to put signals from the electric means and the optical means in correspondent with each other.
- Japanese Patent Publication No. 2-20053 discloses a composite detection apparatus in which detection for electric resistance and optical detection are carried out at same position so as to obtain signals regarding both electric resistance and optical detection.
- a composite, particle detection apparatus shown in Fig. 1 is of a type in which electric resistance detection and optical detection are performed at the same location so as to obtain signals regarding both electric resistance and optical detection.
- the apparatus 10 includes a flow cell 12 made from fused quartz.
- a laser illuminated portion of the flow cell 12 onto which Ar (argon) laser beam is illuminated, i.e., a portion through which a flow of sample liquid S with a blood specimen suspended therein passes, is configured, for the purpose of simultaneous detection of electric resistance, to form a micropore 14 (hereinafter referred to as an aperture) in a rectangular parallelopiped form having, for example, sides in 100 micrometers and a length in 120 micrometers.
- a lens 11 is disposed at a position opposite to one side surface of the flow cell 12.
- the lens 11 illuminates Ar laser beam onto the sample liquid S passing through the aperture 14.
- a conversing lens 16 is disposed at a position opposite to a side surface substantially perpendicular to the above one side surface of the flow cell 12.
- the conversing lens collects fluorescence emitted from stained or colored biological cells in the sample liquid S upon illumination of Ar laser beam.
- the fluorescence, having been collected by the converging lens 16 is directed through a wavelength selection filter 17, a lens 19 and a pinhole 21, for selection of necessary lights having a particular wavelength, to a photodetective sensor (such as photomultiplier) 26.
- the optical signal detected by the photodetective sensor 26 is converted into an electric signal.
- Fig. 4 illustrates a fluid circuit in the detection apparatus 10 for supplying a flow of the sample liquid S sheathed with a sheath liquid as an outer layer into the aperture 14.
- valves V9, V3, V5, V1 and V2 Prior to determination or measurement, valves V9, V3, V5, V1 and V2 are opened so as to clean or flush the inside of the apparatus 10 with a sheath liquid from a chamber Sh.
- a valve V6 is opened, a cleaning pump 34 and a syringe 36 are communicated with each other by means of a valve V7, so as to put the cleaning pump 34 into a discharge mode.
- a valve V11 is first opened, then a sample pump 32 is put into a suction mode, so as to direct the sample liquid S to a position adjacent a jet nozzle 18.
- valve V1, V4 and V6 are opened and the syringe 36 is put into a discharge mode.
- the sample liquid S sheathed with a flow F of a front sheath liquid from a supply port 22 passes through the aperture 14 at its center in an aligned manner.
- the sample liquid, having passed through the aperture 14, is sheathed or encased with a flow B of a back sheath liquid from a supply port 24 and flows into a collection tube 20 for recovery.
- a pair of electrodes 27, 28 is disposed at upstream and downstream sides, respectively, of a flow of the sample liquid S in a confronting manner with the aperture 14 disposed therebetween.
- the electrode 27 is disposed so as to be in contact with the flow F of a front sheath liquid, while the electrode 28 is disposed so as to be in contact with the flow B of a back sheath liquid.
- reticulocytes in a blood sample are stained with a suitable fluorescent dye so as to form a sample liquid S.
- Suitable fluorescent dyes may include acridine orange, auramine O, etc.
- auramine O is specifically preferred to be used in determination of reticulocytes.
- Auramine O when nonspecifically adsorbed to membrane of a mature red blood cell, emits weak fluorescence, while it emits specifically strong fluorescence when adsorbed to a reticulum of reticulocyte, thus permitting accurate determination of reticulocytes.
- Japanese Patent Publication No. 61-2805656 refer to Japanese Patent Publication No. 61-2805656.
- the sample liquid S including therein reticulocytes stained with auramine O may be prepared, for example, by adding 40 micro liters of a stain liquid of auramine O to 1,950 micro liters of a dilution liquid to be mixed well therewith, then, immediately adding 10 micro liters of blood into the mixed solution to be mixed therewith, and incubating the resulting solution or liquid at a temperature of 35 degrees (Celsius) for 30 seconds.
- a flow of the sample liquid S containing reticulocytes is supplied to the aperture 14, using a sheath liquid as an outer layer.
- the sheath liquid is pressurized, for example, to 0.3 kg/sq. cm so as to be admixed with the sample liquid S ejected from the nozzle 18, thus forming a laminate flow.
- quantity of the sample liquid to be discharged may be controlled so as to permit the cells passing through the aperture 14 to be aligned.
- a two-dimensional particle size distribution chart is prepared using intensity of each of the first and second signals as an axis.
- Fig. 6 shows the result obtained from the above method
- Fig. 5 shows a two-dimensional particle size distribution chart which diagrammatically illustrates the measurement result of Fig. 6.
- the horizontal axis (X-axis) represents intensity of fluorescence
- the vertical axis (Y-axis) represents intensity of signals obtained by electric resistance method (electric impedance method).
- a group R (a group 52 in Fig. 5) extends in upward and right hand direction from a distribution of mature red blood cells which is a main distribution in Fig. 6 (a group 50 in Fig. 5).
- the group R is a group of reticulocytes. Inspection of the scatter diagram in detail reveals that the cells (reticulocytes) in region R have a fluorescent intensity proportional to the size thereof and increased electric impedance. A reticulocyte representing a greater fluorescent intensity is a red blood cell of lesser maturity.
- a reticulocyte of a lesser maturity has a larger cell volume.
- White blood cells are well stained with a fluorescent dye due to their richness in DNA and RNA.
- white blood cells represent increased fluorescent intensity and they therefore appear at position P3 at saturated level in the scatter diagram.
- Fig. 7 illustrates an example in which blood sample obtained from a patient suffering from iron deficiency anemia and under treatment has been determined. It will be seen that a particle size distribution P2 of mature red blood cells has two peaks therein. The peak having a lower intensity of electric impedance signal is for mature red blood cells of a smaller cell volume which have been blood-formed prior to medical treatment, while the peak having a higher intensity of electric impedance signal is for normal, mature red blood cells of a larger cell volume which have been blood-formed after medical treatment. Most of the reticulocytes is related to the distribution of normal, red blood cells. It should be noted, however, that, though quite a little, there are reticulocytes which is related to the distribution of smaller red blood cells.
- reticulocytes of a smaller size are initially formed in a patient suffering from iron deficiency anemia, even though he has normal blood formation ability.
- Fig. 9 shows an example of measurement or determination for reticulocytes by means of a conventional method.
- Fig. 8 shows a two-dimensional particle size distribution chart in which the result shown in Fig. 9 is diagrammatically illustrated.
- the vertical axis (Y-axis) represents intensity of forward scattering lights and the horizontal axis (X-axis) represents intensity of fluorescence.
- a distribution of reticulocytes (a group denoted by numeral 52 in Fig. 8) lies substantially parallel with the horizontal axis. This is because that a signal of forward scattering light does not sufficiently reflect information regarding a size of cells. On the contrary, electric impedance signals in Fig. 6 accurately represent each cell volumes, thus giving a distribution having an inclination.
- the two-dimensional distribution diagram in Fig. 6 is analyzed so as to calculate or obtain number of reticulocytes, ratio of reticulocytes, mean volume of reticulocytes, growth index of reticulocytes, number of reticulocytes of different maturity, and mean volume of reticulocytes of different maturity.
- Mean volume of reticulocytes is obtained by calculating average intensity of electric impedance signals from cells which have been identified to be a reticulocyte.
- Mean volume of reticulocytes regarding normal specimen usually takes a value with a predetermined range. Accordingly, it is possible to determine whether the specimen concerned is normal or abnormal on the basis of mean volume of reticulocytes obtained.
- An inclination or angle of a group of cells which have been identified to be a reticulocyte in the two-dimensional particle size distribution diagram will be decreased in accordance with maturity of such reticulocytes, so that it represents initial size of a reticulocyte appearing in blood in peripheral vessel and a speed of decrease in its volume in accordance with its maturity.
- An inclination regarding normal specimen represents a constant value. Thus, a specimen having an inclination which is not constant is determined to have possible disease.
- initial size of a reticulocyte appearing in peripheral vessel is represented by the value of Y-axis at the saturated value of X-axis in the regression line the inclination or angle of which has been obtained in the above.
- Number of reticulocytes of different maturities, and means volume of reticulocytes of different maturities can be obtained by classifying the cell groups having been determined to be a reticulocyte by means of the two-dimensional particle distribution diagram into several levels depending upon their respective fluorescent intensities, and then calculating number of reticulocytes and mean particle volume with respect to individual groups.
- mean particle volume of reticulocytes is a new information which could not have been obtained or measured by means of existing apparatus and it is, therefore, quite beneficial on determination of patients suffering from anemia.
Description
- This invention relates to a method for determining characteristics of a group of particles in which particles such as biological cells flow through a detection area in an aligned manner so as to simultaneously detect electrical characteristics and optical characteristics with respect to individual particles. In particular, this invention relates to a method by which distribution form of reticulocytes may be accurately determined.
- A flow cytometry method, for example, is known in the art as a method for analyzing particles, such as blood cells. In the flow cytometry method, particles are flown in a sheathed flow, so as to detect scattering light or fluorescence emitted from a particle passing through an area illuminated by light beam.
- Japanese Patent Public Disclosure No. 1-308964 discloses a method for classifying reticulocytes particles into groups by means of a two-dimensional particle size distribution diagram which utilizes relative intensity of forward scattering light and relative intensity of fluorescence as coordinate axis. Such intensities are obtained by passing blood specimen stained with a fluorescent dye through a flow cell so as to measure forward scattering light and fluorescence by mean of a flow cytometer.
- Fig. 9 shows such a two-dimensional distribution diagram. A, B and C respectively indicate regions in which mature red blood cells, reticulocytes, and blood platelets are classified. It is possible to obtain number of reticulocytes and a ratio of reticulocytes in the blood by calculating the number of particles in each of the regions.
- It will be very beneficial if, in the two-dimensional distribution diagram, characteristics of each of the particle groups are evaluated more accurately, in addition to the simple classification of the particles into groups. Furthermore, it will be useful to medical purposes if new information regarding the particles, such as mean volume of reticulocytes, under such condition is obtained. The invention is intended to achieve requirements.
- With regard to the above determination of the reticulocytes, it is considered that relative intensity of forward scattering light generally corresponds to a particular particle size. It is to be noted, however, that the above relative intensity does not accurately reflect individual particle sizes due to influence of particle shape, change in the degree of light absorption caused by difference in the degree of stain, or change in refractive index of particles.
- An electric resistance method (electric impedance method), known, like a flow cytometry method mentioned above, as a method for analyzing particles such as blood cells, is believed in general to be superior in obtaining accurate volume of individual particles. According to the electric resistance method, electric current is supplied to an aperture so as to detect change in impedance occurring when a particle passes through the aperture.
- It is assumed that a two-dimensional particle size distribution diagram accurately representing information regarding particle volume may be obtained when providing a composite detection apparatus in which electric resistance detection and optical detection are combined, so as to obtain a signal on the basis of change in the electric resistance, in place of using the scattering light detection. It is also assumed that new information regarding reticulocytes, which could not have been obtained heretofore, may be obtained.
- Accordingly, it is a principal object of the invention to provide a method for obtaining a two-dimensional particle distribution diagram accurately representing volumetric information of reticulocytes, so as to obtain new information regarding volume and mean or average volume of reticulocytes from such a two-dimensional particle distribution diagram.
- Reference is made to US-A-5006986, which belongs to the present applicants and which discloses a method for determining reticulocytes by means of a composite particle detection means including an aperture through which a flow of sample liquid containing blood specimen suspended therein passes, the aperture being illuminated by a light beam, the method comprising the steps of staining said reticulocytes in the blood specimen with a fluorescent dye, passing a flow of the sample liquid containing said reticulocytes through the aperture, detecting, with respect to individual particles passing through said aperture, a first signal on the basis of amount of fluorescence generated by said illumination of light beam, preparing a two-dimensional particle size distribution diagram using the intensity of said first signal as one axis of said diagram, classifying said reticulocytes in said two-dimensional particle size distribution into plural groups, and analyzing distribution mode of said classified reticulocytes groups so as to calculate a predetermined index number.
- According to the invention, there is provided a method for determining a novel index number obtained from classified reticulocytes by means of a composite particle detection means including an aperture through which a flow of sample liquid containing blood specimen suspended therein passes, the aperture being illuminated by a light beam; said method comprising the steps of: staining said reticulocytes in the blood specimen with a fluorescent dye; passing a flow of said sample liquid containing said reticulocytes through said aperture using a sheath liquid as an outer layer; detecting, with respect to individual particles passing through said aperture, a first signal on the basis of amount of fluorescence generated by said illumination of light beam and a second signal on the basis of a change in electrical impedance using a pair of electrodes disposed upstream and downstream of the flow of sample liquid, respectively, with said aperture positioned therebetween; preparing a two-dimensional particle size distribution diagram using the intensity of said first signal as one axis of said diagram and the intensity of said second signal as the other axis of said diagram; classifying said reticulocytes in said two-dimensional particle size distribution; and analyzing the distribution mode of said classified reticulocytes group so as to calculate the index number.
- Acridine orange and auramine O may be used as a fluorescent dye. Index numbers to be calculated include a ratio of reticulocytes in the blood sample, mean particle volume of reticulocytes, growth index of reticulocytes, mean volume of reticulocytes of different maturity levels. Specifically, a two-dimensional particle distribution diagram is prepared using signal intensity of electric impedance as Y-axis and fluorescent intensity as X-axis. Growth index of reticulocytes is obtained from inclination of reticulocytes distribution. The reticulocytes distribution is classified into several small regions depending upon fluorescent intensity, so as to calculate mean volume of reticulocytes of each of the small regions. Thus, volume of reticulocytes in each maturity level can be obtained.
- For a better understanding of the invention, and to show how the same may be carried out into effect, reference will now be made, by way of example, to the accompanying drawings in which like reference numerals refer to like elements.
- Fig. 1 is a perspective view illustrating a composite particle detection apparatus (means), in its entirety, for use in carrying out a method for determining reticulocytes in accordance with the invention.
- Fig. 2 is a side elevational view, in section, of main part of the apparatus shown in Fig. 1.
- Fig. 3 is an enlarged illustrative view of an aperture portion of the apparatus of Fig. 1
- Fig. 4 illustrates a fluid circuit of the apparatus of Fig. 1 for supplying a sample liquid through the aperture using a sheath liquid as an outer layer.
- Fig. 5 shows a two-dimensional particle distribution diagram in which measurement result in accordance with method of the invention is pictorially illustrated.
- Fig. 6 shows a diagram for measurement result in accordance with the method of the invention.
- Fig. 7 shows a two-dimensional particle distribution diagram obtained from a specimen suffering from iron deficiency anemia in accordance with the method of the invention.
- Fig. 8 shows a two-dimensional particle distribution diagram in which measurement result in accordance with prior art method is illustrated.
- Fig. 9 shows a two-dimensional particle distribution diagram illustrating prior art classifying method.
- The invention will be explained in detail below with reference to several embodiments illustrated in the drawings.
- Fig. 1 is a generic perspective view of a composite particle detection apparatus or means for use in the method for determining reticulocytes or reticular cell according to the invention. Fig. 2 is a vertical sectional view of main part of the detection apparatus. Fig. 3 is an illustrative, enlarged view of a portion having a micropore or aperture therein of the detection apparatus of the invention.
- A composite detection apparatus is disclosed for example in Japanese Patent Publication No. 56-13266 and United States Patent 3,710,933. In such an apparatus, a means for detecting an electric resistance and a means for conducting optical detection are disposed at different positions. Thus, it is necessary for such an apparatus to include a signal delay means so as to put signals from the electric means and the optical means in correspondent with each other. It is noted, however, that such a corresponding operation is difficult to be performed, since particles do not always flow in a constant manner. In order to obviate the above problem, Japanese Patent Publication No. 2-20053 discloses a composite detection apparatus in which detection for electric resistance and optical detection are carried out at same position so as to obtain signals regarding both electric resistance and optical detection.
- A composite, particle detection apparatus shown in Fig. 1 is of a type in which electric resistance detection and optical detection are performed at the same location so as to obtain signals regarding both electric resistance and optical detection. The
apparatus 10 includes aflow cell 12 made from fused quartz. A laser illuminated portion of theflow cell 12 onto which Ar (argon) laser beam is illuminated, i.e., a portion through which a flow of sample liquid S with a blood specimen suspended therein passes, is configured, for the purpose of simultaneous detection of electric resistance, to form a micropore 14 (hereinafter referred to as an aperture) in a rectangular parallelopiped form having, for example, sides in 100 micrometers and a length in 120 micrometers. - A lens 11 is disposed at a position opposite to one side surface of the
flow cell 12. The lens 11 illuminates Ar laser beam onto the sample liquid S passing through theaperture 14. A conversinglens 16 is disposed at a position opposite to a side surface substantially perpendicular to the above one side surface of theflow cell 12. The conversing lens collects fluorescence emitted from stained or colored biological cells in the sample liquid S upon illumination of Ar laser beam. The fluorescence, having been collected by the converginglens 16, is directed through awavelength selection filter 17, alens 19 and apinhole 21, for selection of necessary lights having a particular wavelength, to a photodetective sensor (such as photomultiplier) 26. The optical signal detected by thephotodetective sensor 26 is converted into an electric signal. - Fig. 4 illustrates a fluid circuit in the
detection apparatus 10 for supplying a flow of the sample liquid S sheathed with a sheath liquid as an outer layer into theaperture 14. Prior to determination or measurement, valves V9, V3, V5, V1 and V2 are opened so as to clean or flush the inside of theapparatus 10 with a sheath liquid from a chamber Sh. When a valve V6 is opened, acleaning pump 34 and asyringe 36 are communicated with each other by means of a valve V7, so as to put thecleaning pump 34 into a discharge mode. When determination is performed, a valve V11 is first opened, then asample pump 32 is put into a suction mode, so as to direct the sample liquid S to a position adjacent ajet nozzle 18. Thereafter, valve V1, V4 and V6 are opened and thesyringe 36 is put into a discharge mode. By this, the sample liquid S sheathed with a flow F of a front sheath liquid from asupply port 22 passes through theaperture 14 at its center in an aligned manner. The sample liquid, having passed through theaperture 14, is sheathed or encased with a flow B of a back sheath liquid from asupply port 24 and flows into acollection tube 20 for recovery. - As shown in Fig. 3, a pair of
electrodes aperture 14 disposed therebetween. Theelectrode 27 is disposed so as to be in contact with the flow F of a front sheath liquid, while theelectrode 28 is disposed so as to be in contact with the flow B of a back sheath liquid. - One embodiment of a method for determining reticulocytes by means of the
apparatus 10 according to the invention will be explained below. - First, reticulocytes in a blood sample are stained with a suitable fluorescent dye so as to form a sample liquid S. Suitable fluorescent dyes may include acridine orange, auramine O, etc. Among the above fluorescent dyes, auramine O is specifically preferred to be used in determination of reticulocytes. Auramine O, when nonspecifically adsorbed to membrane of a mature red blood cell, emits weak fluorescence, while it emits specifically strong fluorescence when adsorbed to a reticulum of reticulocyte, thus permitting accurate determination of reticulocytes. In this regard, refer to Japanese Patent Publication No. 61-2805656. The sample liquid S including therein reticulocytes stained with auramine O may be prepared, for example, by adding 40 micro liters of a stain liquid of auramine O to 1,950 micro liters of a dilution liquid to be mixed well therewith, then, immediately adding 10 micro liters of blood into the mixed solution to be mixed therewith, and incubating the resulting solution or liquid at a temperature of 35 degrees (Celsius) for 30 seconds.
- A flow of the sample liquid S containing reticulocytes is supplied to the
aperture 14, using a sheath liquid as an outer layer. In this connection, it is noted that the sheath liquid is pressurized, for example, to 0.3 kg/sq. cm so as to be admixed with the sample liquid S ejected from thenozzle 18, thus forming a laminate flow. It is noted that quantity of the sample liquid to be discharged may be controlled so as to permit the cells passing through theaperture 14 to be aligned. - During the passage of the cells in the sample liquid through the
aperture 14, Ar laser beam is illuminated onto theaperture 14. At the same time, a voltage is applied between theelectrodes - Next, a two-dimensional particle size distribution chart is prepared using intensity of each of the first and second signals as an axis.
- Fig. 6 shows the result obtained from the above method, while Fig. 5 shows a two-dimensional particle size distribution chart which diagrammatically illustrates the measurement result of Fig. 6. In Fig. 5, the horizontal axis (X-axis) represents intensity of fluorescence and the vertical axis (Y-axis) represents intensity of signals obtained by electric resistance method (electric impedance method).
- In Fig. 6, mature red blood cells, reticulocytes and white blood cells are included in region P2. Platelets are included in region P1. It is seen in Fig. 6 that a group R (a
group 52 in Fig. 5) extends in upward and right hand direction from a distribution of mature red blood cells which is a main distribution in Fig. 6 (agroup 50 in Fig. 5). The group R is a group of reticulocytes. Inspection of the scatter diagram in detail reveals that the cells (reticulocytes) in region R have a fluorescent intensity proportional to the size thereof and increased electric impedance. A reticulocyte representing a greater fluorescent intensity is a red blood cell of lesser maturity. Thus, the above result implies that a reticulocyte of a lesser maturity has a larger cell volume. White blood cells are well stained with a fluorescent dye due to their richness in DNA and RNA. Thus, white blood cells represent increased fluorescent intensity and they therefore appear at position P3 at saturated level in the scatter diagram. - Fig. 7 illustrates an example in which blood sample obtained from a patient suffering from iron deficiency anemia and under treatment has been determined. It will be seen that a particle size distribution P2 of mature red blood cells has two peaks therein. The peak having a lower intensity of electric impedance signal is for mature red blood cells of a smaller cell volume which have been blood-formed prior to medical treatment, while the peak having a higher intensity of electric impedance signal is for normal, mature red blood cells of a larger cell volume which have been blood-formed after medical treatment. Most of the reticulocytes is related to the distribution of normal, red blood cells. It should be noted, however, that, though quite a little, there are reticulocytes which is related to the distribution of smaller red blood cells. This means that reticulocytes of a smaller size are initially formed in a patient suffering from iron deficiency anemia, even though he has normal blood formation ability. On the other hand, it is possible to determine whether a patient has a particular kind of disease from measurement of cell volume of reticulocytes.
- Fig. 9 shows an example of measurement or determination for reticulocytes by means of a conventional method. Fig. 8 shows a two-dimensional particle size distribution chart in which the result shown in Fig. 9 is diagrammatically illustrated. The vertical axis (Y-axis) represents intensity of forward scattering lights and the horizontal axis (X-axis) represents intensity of fluorescence.
- In Fig. 9, a distribution of reticulocytes (a group denoted by numeral 52 in Fig. 8) lies substantially parallel with the horizontal axis. This is because that a signal of forward scattering light does not sufficiently reflect information regarding a size of cells. On the contrary, electric impedance signals in Fig. 6 accurately represent each cell volumes, thus giving a distribution having an inclination.
- The two-dimensional distribution diagram in Fig. 6 is analyzed so as to calculate or obtain number of reticulocytes, ratio of reticulocytes, mean volume of reticulocytes, growth index of reticulocytes, number of reticulocytes of different maturity, and mean volume of reticulocytes of different maturity.
- Calculation of number of reticulocytes and ratio of reticulocytes can be conducted using known method (refer to Japanese Patent Public Disclosure No. 1-308964.)
- Mean volume of reticulocytes is obtained by calculating average intensity of electric impedance signals from cells which have been identified to be a reticulocyte. Mean volume of reticulocytes regarding normal specimen usually takes a value with a predetermined range. Accordingly, it is possible to determine whether the specimen concerned is normal or abnormal on the basis of mean volume of reticulocytes obtained.
- A method for calculating growth index of reticulocytes will be explained below.
- An inclination or angle of a group of cells which have been identified to be a reticulocyte in the two-dimensional particle size distribution diagram will be decreased in accordance with maturity of such reticulocytes, so that it represents initial size of a reticulocyte appearing in blood in peripheral vessel and a speed of decrease in its volume in accordance with its maturity. An inclination regarding normal specimen, of course, represents a constant value. Thus, a specimen having an inclination which is not constant is determined to have possible disease.
- It is noted that initial size of a reticulocyte appearing in peripheral vessel is represented by the value of Y-axis at the saturated value of X-axis in the regression line the inclination or angle of which has been obtained in the above. Thus, it is possible to anticipate occurrence of red blood cells of larger and smaller sizes which will be maturized. This greatly contributes to clinical measurement.
- Number of reticulocytes of different maturities, and means volume of reticulocytes of different maturities can be obtained by classifying the cell groups having been determined to be a reticulocyte by means of the two-dimensional particle distribution diagram into several levels depending upon their respective fluorescent intensities, and then calculating number of reticulocytes and mean particle volume with respect to individual groups.
- The information regarding mean particle volume of reticulocytes, growth index of reticulocytes, number of reticulocytes of different maturity levels, and means volume of reticulocytes of different maturity levels is a new information which could not have been obtained or measured by means of existing apparatus and it is, therefore, quite beneficial on determination of patients suffering from anemia.
- As explained in the above, it is possible, in accordance with the invention, to determine reticulocytes and red blood cell reproducibility of a patient by obtaining proper information regarding particle volume of reticulocytes. At the same time, new information regarding number, ratio and volume of reticulocytes of different levels makes it possible to determine blood formation capability of the bone marrow of a patient.
- The principles, preferred embodiments and modes of operation of the present invention have been described in detail in the foregoing specification. It should be noted, however, that variations and changes may be made by those skilled in the art without departing from the present invention. Accordingly, the foregoing detailed description should be regarded as exemplary in nature and not as limiting the scope of the invention set forth in the appended Claims.
Claims (5)
- A method for determining a novel index number obtained from classified reticulocytes by means of a composite particle detection means including an aperture (14) through which a flow of sample liquid containing blood specimen suspended therein passes, the aperture (14) being illuminated by a light beam; said method comprising the steps of:staining said reticulocytes in the blood specimen with a fluorescent dye;passing a flow of said sample liquid containing said reticulocytes through said aperture (14) using a sheath liquid (F) as an outer layer;detecting, with respect to individual particles passing through said aperture, a first signal on the basis of amount of fluorescence generated by said illumination of light beam and a second signal on the basis of a change in electrical impedance using a pair of electrodes (27, 28) disposed upstream and downstream of the flow of sample liquid, respectively, with said aperture (14) positioned therebetween;preparing a two-dimensional particle size distribution diagram using the intensity of said first signal as one axis of said diagram and the intensity of said second signal as the other axis of said diagram;classifying said reticulocytes in said two-dimensional particle size distribution; andanalyzing the distribution mode of said classified reticulocytes group so as to calculate the index number.
- The method in accordance with Claim 1, wherein said index number to be calculated is mean volume of reticulocytes.
- The method in accordance with Claim 1, wherein said analyzing the distribution mode of said classified reticulocytes is to obtain the regression line regarding the distribution of reticulocytes, and wherein said index number to be calculated is growth index of reticulocytes depending on an inclination of the regression line.
- The method in accordance with Claim 1, wherein said analyzing the distribution mode of said classified reticulocytes is to classify a plurality of groups of reticulocytes each of which has a different maturity level in accordance with intensity of fluorescence, and wherein said index number to be calculated is mean volume of reticulocytes of the different maturity levels.
- The method in accordance with any one of Claims 2 to 4, wherein acridine orange or auramine 0 is used as said fluorescent dye.
Applications Claiming Priority (4)
| Application Number | Priority Date | Filing Date | Title |
|---|---|---|---|
| JP347104/91 | 1991-12-27 | ||
| JP34710491 | 1991-12-27 | ||
| JP303814/92 | 1992-11-13 | ||
| JP30381492A JP3232145B2 (en) | 1991-12-27 | 1992-11-13 | Reticulocyte measurement method |
Publications (2)
| Publication Number | Publication Date |
|---|---|
| EP0548983A1 EP0548983A1 (en) | 1993-06-30 |
| EP0548983B1 true EP0548983B1 (en) | 1997-07-16 |
Family
ID=26563642
Family Applications (1)
| Application Number | Title | Priority Date | Filing Date |
|---|---|---|---|
| EP92121974A Expired - Lifetime EP0548983B1 (en) | 1991-12-27 | 1992-12-24 | Method for determining reticulocytes |
Country Status (3)
| Country | Link |
|---|---|
| EP (1) | EP0548983B1 (en) |
| JP (1) | JP3232145B2 (en) |
| DE (1) | DE69220906T2 (en) |
Cited By (6)
| Publication number | Priority date | Publication date | Assignee | Title |
|---|---|---|---|---|
| US7709653B2 (en) | 2008-06-10 | 2010-05-04 | Shenzhen Mindray Bio-Medical Electronics Co. Ltd. | Asymmetric cyanine compounds, their preparation methods and their uses |
| US7960099B2 (en) | 2007-07-20 | 2011-06-14 | Shenzhen Mindray Bio-Medical Electronics Co., Ltd. | White blood cell differentiation reagent containing an asymmetric cyanine fluorescent dye and method of use thereof |
| US8067602B2 (en) | 2008-01-04 | 2011-11-29 | Shenzhen Mindray Bio-Medical Electronics Co., Ltd. | Asymmetric cyanine fluorescent dyes, compositions and their use in staining biological samples |
| US8367358B2 (en) | 2008-12-17 | 2013-02-05 | Shenzhen Mindray Bio-Medical Electronics Co., Ltd. | Reagent, kit and method for differentiating and counting leukocytes |
| US8685661B2 (en) | 2009-07-31 | 2014-04-01 | Shenzhen Mindray Bio-Medical Electronics Co., Ltd. | Reagent and kit for classifying and counting leukocytes, the preparation thereof, and process for classifying and counting leukocytes |
| US8940499B2 (en) | 2008-10-17 | 2015-01-27 | Shenzhen Mindray Bio-Medical Electronics Co., Ltd. | Reagent for blood analysis and method of use thereof |
Families Citing this family (11)
| Publication number | Priority date | Publication date | Assignee | Title |
|---|---|---|---|---|
| DE69527292T2 (en) * | 1994-08-01 | 2003-02-27 | Abbott Lab | PSEUDO-TELECENTRIC OPTICAL DESIGN FOR A FLOW CYTOMETRIC ANALYZER FOR BLOOD CELLS |
| US5631165A (en) * | 1994-08-01 | 1997-05-20 | Abbott Laboratories | Method for performing automated hematology and cytometry analysis |
| US5656499A (en) * | 1994-08-01 | 1997-08-12 | Abbott Laboratories | Method for performing automated hematology and cytometry analysis |
| US5891734A (en) * | 1994-08-01 | 1999-04-06 | Abbott Laboratories | Method for performing automated analysis |
| JP3347495B2 (en) * | 1994-11-14 | 2002-11-20 | シスメックス株式会社 | Particle analyzer |
| JP3587651B2 (en) * | 1997-05-09 | 2004-11-10 | シスメックス株式会社 | Particle measuring device |
| US20020028434A1 (en) * | 2000-09-06 | 2002-03-07 | Guava Technologies, Inc. | Particle or cell analyzer and method |
| JP5010443B2 (en) * | 2006-12-20 | 2012-08-29 | シスメックス株式会社 | Blood cell analyzer and blood cell analysis method |
| CN103827658B (en) | 2011-07-22 | 2016-04-13 | 罗氏血液诊断股份有限公司 | Identify and measure desmacyte |
| FR3022998B1 (en) * | 2014-06-30 | 2016-07-15 | Alain Rousseau Techniques & Innovations Arteion | SYSTEM AND ASSEMBLY FOR FLOW CYTOMETRY, ANALYSIS DEVICE COMPRISING SUCH A CYTOMETRY ASSEMBLY AND ASSEMBLY COMPRISING SUCH A CYTOMETRY SYSTEM |
| EP3870050A2 (en) * | 2018-10-26 | 2021-09-01 | Abbott Diabetes Care Inc. | Methods, devices, and systems for physiological parameter analysis |
Family Cites Families (7)
| Publication number | Priority date | Publication date | Assignee | Title |
|---|---|---|---|---|
| DE2656654C3 (en) * | 1976-12-14 | 1981-02-12 | Max-Planck-Gesellschaft Zur Foerderung Der Wissenschaftense.V., 3400 Goettingen | Device for measuring the volume and certain optical properties of particles |
| US4325706A (en) * | 1980-08-15 | 1982-04-20 | Ortho Diagnostic Systems Inc. | Automated detection of platelets and reticulocytes in whole blood |
| JPS59184841A (en) * | 1983-04-05 | 1984-10-20 | ベクトン・デイツキンソン・アンド・カンパニ− | Method and device for discriminating sub-class of leukocyte in sample |
| JPS61280565A (en) * | 1985-06-06 | 1986-12-11 | Toa Medical Electronics Co Ltd | Reagent for measuring reticulocyte for flow sightmetry |
| NO156916C (en) * | 1985-07-10 | 1987-12-16 | Harald B Steen | FLOW CLEANING FOR FLUID FLOW PHOTOMETER. |
| JP2674704B2 (en) * | 1988-06-07 | 1997-11-12 | 東亜医用電子株式会社 | Two-dimensional distribution fractionation method |
| FR2653885B1 (en) * | 1989-10-27 | 1994-01-14 | Abx | APPARATUS FOR COUNTING AND DETERMINING AT LEAST ONE LEUKOCYTAIC SUB-POPULATION. |
-
1992
- 1992-11-13 JP JP30381492A patent/JP3232145B2/en not_active Expired - Fee Related
- 1992-12-24 DE DE69220906T patent/DE69220906T2/en not_active Expired - Fee Related
- 1992-12-24 EP EP92121974A patent/EP0548983B1/en not_active Expired - Lifetime
Cited By (6)
| Publication number | Priority date | Publication date | Assignee | Title |
|---|---|---|---|---|
| US7960099B2 (en) | 2007-07-20 | 2011-06-14 | Shenzhen Mindray Bio-Medical Electronics Co., Ltd. | White blood cell differentiation reagent containing an asymmetric cyanine fluorescent dye and method of use thereof |
| US8067602B2 (en) | 2008-01-04 | 2011-11-29 | Shenzhen Mindray Bio-Medical Electronics Co., Ltd. | Asymmetric cyanine fluorescent dyes, compositions and their use in staining biological samples |
| US7709653B2 (en) | 2008-06-10 | 2010-05-04 | Shenzhen Mindray Bio-Medical Electronics Co. Ltd. | Asymmetric cyanine compounds, their preparation methods and their uses |
| US8940499B2 (en) | 2008-10-17 | 2015-01-27 | Shenzhen Mindray Bio-Medical Electronics Co., Ltd. | Reagent for blood analysis and method of use thereof |
| US8367358B2 (en) | 2008-12-17 | 2013-02-05 | Shenzhen Mindray Bio-Medical Electronics Co., Ltd. | Reagent, kit and method for differentiating and counting leukocytes |
| US8685661B2 (en) | 2009-07-31 | 2014-04-01 | Shenzhen Mindray Bio-Medical Electronics Co., Ltd. | Reagent and kit for classifying and counting leukocytes, the preparation thereof, and process for classifying and counting leukocytes |
Also Published As
| Publication number | Publication date |
|---|---|
| DE69220906D1 (en) | 1997-08-21 |
| JP3232145B2 (en) | 2001-11-26 |
| JPH05232011A (en) | 1993-09-07 |
| EP0548983A1 (en) | 1993-06-30 |
| DE69220906T2 (en) | 1997-12-11 |
Similar Documents
| Publication | Publication Date | Title |
|---|---|---|
| EP0548983B1 (en) | Method for determining reticulocytes | |
| CA2449401C (en) | Optical method and apparatus for red blood cell differentiation on a cell-by-cell basis, and simultaneous analysis of white blood cell differentiation | |
| EP1250585B1 (en) | Method and apparatus for analyzing cells in a whole blood sample | |
| KR100400599B1 (en) | Urine tangible component analysis device | |
| JP3048260B2 (en) | Sample preparation method for leukocyte classification and counting | |
| CA2207396C (en) | Method for rapid and simultaneous analysis of nucleated red blood cells | |
| JP4101994B2 (en) | Particle analyzer and automatic particle analysis method | |
| EP0698211B1 (en) | Reticulocyte analyzing method and apparatus utilizing light scatter techniques | |
| US6133995A (en) | Particle measuring apparatus | |
| US7008792B2 (en) | Method of measurement of nucleated red blood cells | |
| JP4077154B2 (en) | Calibration of whole blood sample analyzer | |
| US7208319B2 (en) | Method of measurement of nucleated red blood cells | |
| EP0121261A2 (en) | Method and apparatus for distinguishing subclasses of leukocytes in a sample | |
| JPH04184168A (en) | Classification of leucocyte by flow cytometry | |
| CN102822670B (en) | Method and system for analyzing a blood sample | |
| JP2008175807A (en) | Apparatus and method for analyzing blood cell | |
| Steinkamp et al. | Improved multilaser/multiparameter flow cytometer for analysis and sorting of cells and particles | |
| EP0259833B1 (en) | Reagent and method for classifying leukocytes by flow cytometry | |
| Gray et al. | A new method for cell volume measurement based on volume exclusion of a fluorescent dye | |
| Enerbäck et al. | Quantitation of mast cell heparin by flow cytofluorometry. | |
| JPH0660875B2 (en) | Flow cytometer | |
| Lewis | New developments in haematology | |
| JPH04326061A (en) | Blood analyser | |
| Hiebert et al. | the different cultures were observed, the most each class of chromosomes identified by a distinct | |
| JPS6370167A (en) | Reagent used for classification of white corpuscle by flow sight metry |
Legal Events
| Date | Code | Title | Description |
|---|---|---|---|
| PUAI | Public reference made under article 153(3) epc to a published international application that has entered the european phase |
Free format text: ORIGINAL CODE: 0009012 |
|
| AK | Designated contracting states |
Kind code of ref document: A1 Designated state(s): DE FR GB IT |
|
| 17P | Request for examination filed |
Effective date: 19931122 |
|
| 17Q | First examination report despatched |
Effective date: 19950925 |
|
| GRAG | Despatch of communication of intention to grant |
Free format text: ORIGINAL CODE: EPIDOS AGRA |
|
| GRAH | Despatch of communication of intention to grant a patent |
Free format text: ORIGINAL CODE: EPIDOS IGRA |
|
| ITF | It: translation for a ep patent filed |
Owner name: 0403;30TOFINTERPATENT ST.TECN. BREV. |
|
| GRAH | Despatch of communication of intention to grant a patent |
Free format text: ORIGINAL CODE: EPIDOS IGRA |
|
| GRAA | (expected) grant |
Free format text: ORIGINAL CODE: 0009210 |
|
| AK | Designated contracting states |
Kind code of ref document: B1 Designated state(s): DE FR GB IT |
|
| REF | Corresponds to: |
Ref document number: 69220906 Country of ref document: DE Date of ref document: 19970821 |
|
| ET | Fr: translation filed | ||
| PGFP | Annual fee paid to national office [announced via postgrant information from national office to epo] |
Ref country code: GB Payment date: 19971209 Year of fee payment: 6 |
|
| PGFP | Annual fee paid to national office [announced via postgrant information from national office to epo] |
Ref country code: FR Payment date: 19971229 Year of fee payment: 6 |
|
| PGFP | Annual fee paid to national office [announced via postgrant information from national office to epo] |
Ref country code: DE Payment date: 19980123 Year of fee payment: 6 |
|
| PLBE | No opposition filed within time limit |
Free format text: ORIGINAL CODE: 0009261 |
|
| STAA | Information on the status of an ep patent application or granted ep patent |
Free format text: STATUS: NO OPPOSITION FILED WITHIN TIME LIMIT |
|
| 26N | No opposition filed | ||
| PG25 | Lapsed in a contracting state [announced via postgrant information from national office to epo] |
Ref country code: GB Free format text: LAPSE BECAUSE OF NON-PAYMENT OF DUE FEES Effective date: 19981224 |
|
| GBPC | Gb: european patent ceased through non-payment of renewal fee |
Effective date: 19981224 |
|
| PG25 | Lapsed in a contracting state [announced via postgrant information from national office to epo] |
Ref country code: FR Free format text: LAPSE BECAUSE OF NON-PAYMENT OF DUE FEES Effective date: 19990831 |
|
| REG | Reference to a national code |
Ref country code: FR Ref legal event code: ST |
|
| PG25 | Lapsed in a contracting state [announced via postgrant information from national office to epo] |
Ref country code: DE Free format text: LAPSE BECAUSE OF NON-PAYMENT OF DUE FEES Effective date: 19991001 |
|
| PG25 | Lapsed in a contracting state [announced via postgrant information from national office to epo] |
Ref country code: IT Free format text: LAPSE BECAUSE OF NON-PAYMENT OF DUE FEES;WARNING: LAPSES OF ITALIAN PATENTS WITH EFFECTIVE DATE BEFORE 2007 MAY HAVE OCCURRED AT ANY TIME BEFORE 2007. THE CORRECT EFFECTIVE DATE MAY BE DIFFERENT FROM THE ONE RECORDED. Effective date: 20051224 |