EP0919919B1 - System and method for optimising the performance of a computer system - Google Patents
System and method for optimising the performance of a computer system Download PDFInfo
- Publication number
- EP0919919B1 EP0919919B1 EP98309634A EP98309634A EP0919919B1 EP 0919919 B1 EP0919919 B1 EP 0919919B1 EP 98309634 A EP98309634 A EP 98309634A EP 98309634 A EP98309634 A EP 98309634A EP 0919919 B1 EP0919919 B1 EP 0919919B1
- Authority
- EP
- European Patent Office
- Prior art keywords
- transactions
- computer system
- functional units
- memory
- state information
- Prior art date
- Legal status (The legal status is an assumption and is not a legal conclusion. Google has not performed a legal analysis and makes no representation as to the accuracy of the status listed.)
- Expired - Lifetime
Links
Images


Classifications
-
- G—PHYSICS
- G06—COMPUTING; CALCULATING OR COUNTING
- G06F—ELECTRIC DIGITAL DATA PROCESSING
- G06F8/00—Arrangements for software engineering
- G06F8/40—Transformation of program code
- G06F8/41—Compilation
- G06F8/44—Encoding
- G06F8/445—Exploiting fine grain parallelism, i.e. parallelism at instruction level
-
- G—PHYSICS
- G06—COMPUTING; CALCULATING OR COUNTING
- G06F—ELECTRIC DIGITAL DATA PROCESSING
- G06F11/00—Error detection; Error correction; Monitoring
- G06F11/30—Monitoring
- G06F11/34—Recording or statistical evaluation of computer activity, e.g. of down time, of input/output operation ; Recording or statistical evaluation of user activity, e.g. usability assessment
- G06F11/3409—Recording or statistical evaluation of computer activity, e.g. of down time, of input/output operation ; Recording or statistical evaluation of user activity, e.g. usability assessment for performance assessment
-
- G—PHYSICS
- G06—COMPUTING; CALCULATING OR COUNTING
- G06F—ELECTRIC DIGITAL DATA PROCESSING
- G06F11/00—Error detection; Error correction; Monitoring
- G06F11/30—Monitoring
- G06F11/34—Recording or statistical evaluation of computer activity, e.g. of down time, of input/output operation ; Recording or statistical evaluation of user activity, e.g. usability assessment
- G06F11/3466—Performance evaluation by tracing or monitoring
-
- G—PHYSICS
- G06—COMPUTING; CALCULATING OR COUNTING
- G06F—ELECTRIC DIGITAL DATA PROCESSING
- G06F11/00—Error detection; Error correction; Monitoring
- G06F11/30—Monitoring
- G06F11/34—Recording or statistical evaluation of computer activity, e.g. of down time, of input/output operation ; Recording or statistical evaluation of user activity, e.g. usability assessment
- G06F11/3452—Performance evaluation by statistical analysis
-
- G—PHYSICS
- G06—COMPUTING; CALCULATING OR COUNTING
- G06F—ELECTRIC DIGITAL DATA PROCESSING
- G06F11/00—Error detection; Error correction; Monitoring
- G06F11/30—Monitoring
- G06F11/34—Recording or statistical evaluation of computer activity, e.g. of down time, of input/output operation ; Recording or statistical evaluation of user activity, e.g. usability assessment
- G06F11/3466—Performance evaluation by tracing or monitoring
- G06F11/348—Circuit details, i.e. tracer hardware
-
- G—PHYSICS
- G06—COMPUTING; CALCULATING OR COUNTING
- G06F—ELECTRIC DIGITAL DATA PROCESSING
- G06F2201/00—Indexing scheme relating to error detection, to error correction, and to monitoring
- G06F2201/86—Event-based monitoring
-
- G—PHYSICS
- G06—COMPUTING; CALCULATING OR COUNTING
- G06F—ELECTRIC DIGITAL DATA PROCESSING
- G06F2201/00—Indexing scheme relating to error detection, to error correction, and to monitoring
- G06F2201/87—Monitoring of transactions
-
- G—PHYSICS
- G06—COMPUTING; CALCULATING OR COUNTING
- G06F—ELECTRIC DIGITAL DATA PROCESSING
- G06F2201/00—Indexing scheme relating to error detection, to error correction, and to monitoring
- G06F2201/88—Monitoring involving counting
Definitions
- the present invention relates generally to optimising the performance of computer systems, and more particularly to gathering performance statistics by sampling, and analyzing the sampled statistics to guide system optimization.
- Input/Output interfaces and network controllers of computer systems are also becoming more sophisticated.
- the interfaces and controllers include microprocessors and buffer memories whose dynamic behavior is becoming more difficult to measure and understand as complexity increases.
- a profile is a record of performance data. Frequently, the profile is presented graphically or statistically so that performance bottlenecks can readily be identified.
- Profiling can be done by instrumentation and simulation. With instrumentation, additional code is added to executing programs to monitor specific events. Simulation attempts to emulate the behavior of the entire system in an artificial environment rather than executing the program in the real system. Also, instrumentation can only be used only for processor pipelines, not for other devices.
- Instrumentation perturbs the system's true behavior due to the added instructions and extra data references.
- instrumentation fails in two aspects. The system is slowed down, and the performance data is bad, or at best, sketchy.
- Simulation avoids perturbation and overhead.
- simulation only works for small well defined problems that can readily be modeled. It is extremely difficult, if not impossible, to simulate a large scale system, with thousands of users connected via fiber optic links to network controllers, accessing terabytes of data using dozens of multi-issue processors.
- a Web search engine such as Digital's Alta Vista, that responds to tens of millions of hits each day from all over the world. Each hit perhaps offering up hundreds Web pages as search results.
- Hardware implemented event sampling has been used to provide profile information for processors.
- Hardware sampling has a number of advantages over simulation and instrumentation: it does not require modifying software programs to measure their performance. Sampling works on complete systems, with a relatively low overhead. Indeed, recently it has been shown that low-overhead sampling-based profiling can be used to acquire detailed instruction-level information about pipeline stalls and their causes. However, many hardware sampling techniques lack flexibility because they are designed to measure specific events in isolation.
- the method should be able to monitor processors, memory sub-systems, I/O interfaces, graphics controllers, network controllers, or any other component that manipulates digital signals.
- the monitoring should be able to sample arbitrary transactions and record relevant information about each.
- arbitrary transaction monitoring should allows one to monitor not only discrete events, but also events in any combination. It should also be possible to relate the sampled events to individual transactions such as instructions, or memory references, or contexts in which the transactions arose. In addition, it should be possible to relate the sampled data to multiple concurrent transactions in order to gain a true understanding of the system. All this should be possible, without perturbing the operation of the system, other than the time required to read the desired performance data.
- ROTH C ET AL "PERFORMANCE MONITORING ON THE POWERPCTM 604 MICROPROCESSOR” INTERNATIONAL CONFERENCE ON COMPUTER DESIGN: VLSI IN COMPUTERS AND PROCESSORS, US, NEW YORK, IEEE, 2 October 1995 (1995-10-02), pages 212-215, XP00631915 discloses a system for optimising the performance of a computer system, said computer system comprises a plurality of functional units, said system for optimising comprising:
- such a system is characterised by said transactions being concurrently sampled by said functional units; and by buffers for storing state information while the selected transactions are processed by the functional units, said state information including at least one of an address information, a transaction source information, and a latency information, wherein the buffers store state information as an aggregate of state information over time, and the aggregate of state information is analysed to estimate performance statistics of said computer system, the performance statistics being used to dynamically optimise the performance of the computer system while the computer system is operating.
- Transactions to be processed by a particular functional unit of the computer system are selected for monitoring.
- the transactions can be selected concurrently.
- State information is stored while the selected transactions are processed by the functional unit.
- the state information is analysed to guide optimisation.
- multiple different functional units can concurrently be sampled.
- the invention also provides a method of optimising the performance of a computer system having a plurality of functional units, said method comprising the steps of:
- Figure 1 shows a computer system 100.
- the computer system includes one or more functional units 111-114, for example processors, memories, input/output interface, and network controllers.
- the units 111-114 are connected to each other by buses, data channels, and networks, e.g., 150, depending on a particular configuration.
- the processors 111 can be of varied architecture, CISC or RISC, single or multi-issue, loosely or tightly coupled.
- the memories 112 typically are arranged at hierarchical levels, memories closer to the processors having higher bandwidth and less storage, and farther memories having lower bandwidth and more storage.
- the memories can include on-chip and off-chip caches, SAM, DRAM, disk, and the like.
- the I/O interfaces 113 couple to peripheral devices. Some of the interfaces can include internal processors and memories.
- the network controllers 114 can interface to local and wide area networks.
- transactions (T) 101 are generated by a source 110 as input for the system.
- the various functional units 111-114 of the system 110 process the transactions 101 to provide output 102 for a drain 120.
- the transactions can originate from outside the system, or from within due to the processing.
- the processing of transactions for example, instructions, usually generates many additional internal transactions such as memory references, disk transfers, or network messages.
- events 104 are signaled, e.g., instruction aborts and traps, cache misses, clock cycles, exception conditions, and so forth.
- the actual events 104 that can be signaled depend on the implementation of the functional units 111-114.
- state 130 While the system 100 is operating, state 130 is maintained.
- the state 130 is usually distributed over the functional units. Processing the transactions causes state transitions. Some of the state transitions may be of particular interest to an understanding of the performance of the system.
- the transactions are presented to a transaction selector.
- the selector may be replicated for the different functional units 111-114 using a common design as described herein.
- the selector needs a means for choosing transactions based on the state of the system and the transaction itself.
- transactions can be chosen randomly, for example, by initializing a counter to a randomly chosen value, incrementing the counter for each transaction, and selecting a transaction when the counter overflows (or underflows).
- Transactions can be chosen only from those possessing certain properties (for example by incrementing the counter only for transactions matching a specified set of properties), or can be chosen only when the system is in certain states (by incrementing the counter only when in a specified state).
- FIG. 2 shows the salient features of one possible implementation of a selector 200.
- the selector 200 includes a trigger 210, a counter 220, and a marker 230.
- the counter 220 is set and reset (initialized) with a value (init value) 221 on line 222.
- the value 221 can be generated by hardware (HW) 223 or software (SW) 224.
- HW hardware
- SW software
- the value 221 determines a rate of sampling, small initial values increase the rate of sampling, and large values decrease the rate of sampling. If the counter counts down, then small initial values increase the rate of sampling and large initial values decrease the rate.
- the value 221 can uniformly and randomly be chosen from an interval of integers.
- the average rate of sampling can be adjusted by choosing an appropriate interval of integers from which the value 221 is chosen.
- the counter 220 is incremented (or decremented depending on design) by a counter event signal received on line 225.
- the counter event signal 225 can be selected from one or more event signals (event1, event2, event3) 104 by a count select signal on line 229.
- the event signals 104 can include clock cycles, transactions available for processing, transactions accepted for processing, and so forth.
- the trigger 210 determines when and under what conditions the counter 220 counts up (or down), and the marker 230 determines which transactions are marked as selected transactions (T) 103.
- the trigger 210 receives the transactions 101, events 104, and state 130, depending on the particular functional unit which is sampled.
- the current transaction information, the events, and state are logically combined by the trigger 210 using a function, for example, a logical function including Boolean operators (AND, OR, NOT). If the result of the combination is true, then the counter 220 is enabled for counting, otherwise, if false, then it is not.
- Some specific examples of useful trigger functions include, but are not limited to, those that match on: any transaction, transactions of a particular type (memory reference instructions, transactions that reference a particular level of the memory hierarchy, e.g., a particular cache or cache block), transactions that will cause a particular state transition, e.g., dirty data evictions, transactions that reference a particular region in the memories, e.g., a range of addresses, a particular cache line, a particular cache block within a particular cache line, a particular region of the cache, etc., transactions from a particular source, e.g., from a processor pipeline, from an I/O interface, e.g., a direct memory access, transactions related to data coherency messages, and so forth.
- the trigger 210 is programmable by either the hardware 223 or the software 224.
- the use of the trigger function 250 enables the sampling hardware to skip specified transactions. For example, in a sophisticated function example, this would allow one to count three access transactions to a particular cache block, and then to gather memory transaction samples for the next two misses to that same block.
- the marker 230 identifies a transaction as a selected transaction T' 103 whenever the counter overflows (or underflows). At this point the counter 220 can be reset with a new value 221. It should be noted, that the value can dynamically change depending on what type of sampling is desired, detailed sampling over a short interval of time with many samples, or low overhead general sampling over a longer interval of time using random sampling.
- the marker 230 is also configured so that it can receive events 104 and state 130, as well as the transactions.
- the job of the marker 230 is to determine whether the current transaction is of interest for sampling at the time that marking is triggered due to the counter 220 overflowing, if not, than the transaction can be ignored, and the counter can be reset.
- the various functions that actually cause the marker 230 to select a transaction include, but are not limited to, transactions that reference a particular level in the memory hierarchy, references to a particular region of memory within a particular level of the memory hierarchy, transactions of a particular type, e.g., branch instructions, transactions having an associated event, e.g., a miss, a branch mispredict, an abort, a particular state transition, e.g., dirty evictions, transactions originating from a particular source, e.g., an instruction executing in the processor pipeline, an instruction execution from a particular context, process, thread, or address space, direct memory access from an input/output interface, cache coherency messages in a multiprocessor computer system, and so forth.
- a particular type e.g., branch instructions
- transactions having an associated event e.g., a miss, a branch mispredict, an abort
- a particular state transition e.g., dirty evictions
- the marking of the selected transaction can be achieved by providing the transaction with an additional "sample” bit, e.g., from T to T'.
- an additional bit e.g., from T to T'.
- the transaction is an instruction
- the instruction field is augmented with an additional bit which is carried with the transaction until the transaction is completely processed.
- the transactions are numbered or otherwise identified. In the present invention, multiple transactions are selected concurrently, in which case multiple bits are needed to mark them.
- the corresponding functional unit that will process the marked transaction 103 checks the sample bit at each pertinent stage ofprocessing, and collect state information available to it.
- the collected state information is stored in a plurality of buffers, described in detail below. When more than one buffer is used multiple transactions can concurrently be sampled.
- the location of the buffer is a designer's choice, preferably close to where sample information is generated.
- Some state information can be recorded before the transaction is processed by the functional unit to capture an initial state, and additional information can be recorded after the transaction completes to capture a final state.
- a read signal can be generated.
- the read signal can be in the form of an interrupt, a software pollable value set in a register, or an exception condition.
- the read signal can enable software to read the sampled data for further processing.
- multiple buffers can be used to collect multiple samples. Increasing the number of buffers amortizes the cost of sampling overhead, by transferring more than one sample per read signal.
- Termination of processing of a sample transaction can be complete processing of the transaction, or abortion of the processing due to arriving at some incorrect or illegal state, or interruption of the processing due to some external event.
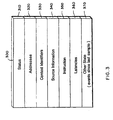
- Figure 3 shows the details of how a buffer 300 can be allocated for storing state information.
- the buffer 300 can be implemented as a set of software readable registers, or other types of memories.
- the buffer includes a status field 310, an address field 320, a context field 330, a transaction source field 340, an instruction field 350, a latency field 360, and fields 370 for other states and events.
- the status field 310 stores state information pertaining to the particular transaction being processed. For example, if the transaction is a memory reference, the state can indicate whether a cache block is dirty or clean (modified or not), exclusive (non-shared), valid or invalid (the data are legitimate), and cache hit or miss status.
- the address field 320 can store the virtual and/or physical addresses associated with the transaction.
- the context field 330 can store the address space number (ASN), the hardware context identifier (HCI) in case of a multi-threaded processor, a process identifier (PID), and/or a thread identifier (TID) of the source of the transaction.
- the field can also store the address space number (ASN) referenced by the transaction.
- the source field 340 can be used to store the source of the transaction, e.g., a load or store instruction, a DMA request, or cache coherency protocol operation, as well as additional information to identify the source, depending on the particular functional unit.
- the program counter (PC) of the instruction can be stored in the instruction field 350.
- the program counter field 350 can also be used to store information about other kinds of sources to save a register. For example, if the source is a coherency operation from another processor in a multiprocessor computer system, then the field 350 can be used to hold the processor number of the processor originating the DMA request that caused the coherency operation. For DMA type of transactions, the identity of the I/O device that initiated the DMA can be stored.
- the time interval (latency) between successive transactions or successive stages of transaction processing can be stored in the latency field 360.
- the interval can be measured in terms of processor clock cycles, or the interval can be measured in other units such as the number of transactions processed.
- the interval can also be broken down into the time required to process the transaction at each level of a memory hierarchy (in case of sampling memory performance), or stages of a processor pipeline (in the case of a processor).
- Additional registers such as field 370 can be added to this structure to store additional system state that is captured at the time that the sampled transaction is processed.
- This state can include the contents or number of valid entries in memory system structures such as write buffers, victim caches, translation lookaside buffers (TLBs), miss-address files (MAFs), and memory transaction queues, in the case of a functional memory unit.
- memory system structures such as write buffers, victim caches, translation lookaside buffers (TLBs), miss-address files (MAFs), and memory transaction queues, in the case of a functional memory unit.
- Pairwise sampling can be expended to N-wise sampling over a predetermined time window.
- the apparatus and method disclosed herein can sample transactions to: specific cache blocks clean or dirty, specific regions of memories, all memory locations, all memory locations where cache blocks are dirty, to memory locations where the data are not in the cache.
- sampling techniques as described herein permit a fine grained monitoring of functional units with low hardware overhead.
- This information can be used in many ways. For example, the collected information can help system designers to better understand the performance of processor and memory sub-systems, such as caches, DRAM, and the like.
- the performance data is used to guide optimizations.
- the context identifying information associated with both samples it is possible to determine which contexts usefully shared this physical space during the sampled time interval. By aggregating this information over many such pairs of samples, one can statistically estimate metrics concerning both intra-context and inter-context sharing of physical locations.
- One useful metric is determined by counting the number of pairs where the first pair in the sample matches one specific context, and where the second pair in the sample matches a second specific context, effectively yielding a matrix of counts that is indexed by the identifiers of the first and second contexts. Similarly, by analyzing pairs where the second sampled transaction experienced a cache miss, one can statistically estimate metrics concerning intra-context and inter-context conflict for physical locations.
- An alternative use of this hardware is to choose a specific cache region to monitor.
- the chosen region corresponds to the space in the cache that stores a particular program variable or data structure.
- This estimation can be done dynamically to enable on-line program debugging or optimization of performance problems within a running program or system.
- This technique enables programmers to interactively debug memory system performance by identifying conflicts in executing programs that are investigated. Similar techniques can be used by adaptive runtime software to avoid severe cache conflicts through dynamic data relocation.
- Sampling individual memory system transactions makes it possible to compute a variety of statistical metrics about distributions of properties of memory system behavior. For example, it is possible to estimate distributions of latencies to service memory requests, or to estimate rates of cache hits at a particular level or region in the memory hierarchy. Filtering mechanisms can be used to identify subsets of the recorded transactions that are of interest, permitting the statistics to focus in on particular aspects of the memory system that are of interest, such as transactions to a particular region or level in the memory hierarchy, or a particular class of transactions such as reads, writes, or invalidates.
- Standard statistical techniques can be used to derive averages, standard deviations, histograms and other statistics about the samples of interest. Averages can be used to estimate rates of occurrence for particular events, such as cache hits or misses, or evictions.
- Standard error estimation techniques can be used to obtain confidence intervals on the accuracy of the derived statistics.
- error bounds can be approximated using the reciprocal of the square root of the number of samples with that property. These error bounds can also be used to dynamically control the rate at which selected transactions are sampled, so as to trade off accuracy with sampling overhead.
- the recorded state information includes latency information, either in the form of the latency required to process the memory transaction, or in terms of the latency between two consecutive sampled memory transactions, the information can be used to compute latency-based statistics. Latency is typically measured in units of time, such as processor clock cycles, but may also be measured in other units, such as the number of memory transactions processed.
- processors execute instructions that operate on data.
- the instructions and data are usually maintained as separate structures using different memory pages because the access patterns for instructions is quite different than that for data.
- Virtual to physical memory mapping for instructions and data is usually performed by the operating system.
- relocation of structures can be done manually, or by compilers, linkers, and loaders. Some systems can relocate structures dynamically as the instructions execute.
- sampled memory transaction state information can be used to drive, for example, page remapping policies, or to avoid self-interference by providing feedback to compilers, linkers, or loaders.
- software can aggregate conflicting addresses at the page level to inform dynamic page-remapping algorithms implemented by operating systems. It is also possible to provide interesting profiling tools that identify potential performance problems to programmers and users.
- NUMA non-uniform memory access
- the data can be replicated by making multiple copies of the data. Ideally, the data are judiciously "scattered" throughout the memory system. Alternatively, the data can be migrated by actually moving the data into a lower latency or higher bandwidth memory.
- Information about the type of accesses can further guide the decision of whether to replicate or to migrate, or to leave the data in place. For example, data that are frequently written by multiple processors (e.g., write-shared pages) should probably not be replicated or migrated, while data that are frequently read but only infrequently written (e.g., read-shared pages) are good candidates for replication. Pages that are heavily accessed by only a single processor are good candidates for migration to a memory that is closer to the accessing processor. This information can be gathered by statistical sampling of memory system transaction information as described herein.
- the information about memory system transactions is aggregated dynamically and can be used in an on-line manner to dynamically control the replication and migration policies of the computer system.
- replication and migration are handled by the operating system, but they can also be handled by other software or hardware layers.
- replication or migration policies can attempt to improve, including an increase in total system throughput, an increase in throughput for particular high-priority jobs, a decrease in traffic between processors and memories, a decrease in total memory latency, or an overall increase in system performance.
- caches in a hierarchical memory store data originating from various hardware contexts
- threads executing in different hardware contexts compete for lines in a cache. Therefore, it is desired to schedule threads so that resource conflicts are minimized. This can be done by sampling memory system transaction information as described herein.
- Scheduling decisions can benefit from considering various metrics, including increasing the amount of sharing among contexts competing for memory resources or decreasing conflicts among contexts competing for memory resources.
- the operating system software should strive to avoid co-scheduling two threads with large cache footprints, where possible, because this will result in many more conflict misses as the threads evict each other's useful data from the cache, thereby decreasing conflicts.
- the operating system software can statistically estimate the degree to which different contexts are sharing and conflicting in the cache. These estimates can be supplied to a scheduler.
- Judicious scheduling is especially important for multithreaded processors where memory references from different hardware contexts are interleaved at a very fine-grained level, and the relevance is increased when these contexts share memory system resources, such as caches.
- memory system resources such as caches.
- Share-based or proportional-share scheduling policies ideally want to give each context a specified share of each cache memory in the memory hierarchy. With the present sampling technique, it is possible to statistically estimate the portion of cache occupied by each context. This allows the scheduler to base its decisions on metrics such as giving each process a specified share of the memory system resources, effectively partitioning memory system resources among contexts in proportion to their needs.
- contexts which occupy more than their allotted share can be slowed down or suspended. While some contexts are suspended, others can increase their share of the cache.
- the suspended context can be allowed to continue after its cache usage has decreased as a result of increased cache pressure from other active contexts. This can be distinguished from known approaches that generally do not allow information to be monitored at the cache line or block level, other than through simulation.
- All of these scheduling decisions can dynamically adapt to feedback gathered from statistical sampling of memory system transactions during on-line operation.
- the profiling hardware described above can be utilized in a variety of different ways. Because the present technique provides very detailed information about the processing of individual transactions such as instructions, one application could profile a large number of instructions.
- the sample information can be stored in a memory buffer for later processing by profiling tools to produce detailed instruction-level information.
- the information can be used to develop, for example, histograms of load latencies for each load instruction, histograms of instruction execution times, and perhaps even a moderately comprehensive analysis of the pipeline state for each instruction. Because the amount of information provided by this approach is likely to be quite high, the overall memory overhead of the present technique is also likely to be quite high because a substantial amount of memory traffic is involved. For example, if a billion instructions are fetched per second, and sampling is performed every 10,000 fetched instructions, then the data rate for the profile information will be approximately 2.4 MB per second.
- the volume of sampled data can be reduced by ignoring some fields of the profile record, e.g., the data in the buffer 300, except when they are explicitly requested.
- a user of the system 100 may desire different levels of profiling. In a lowest overhead mode, the profiling application software can generate a profile report for all or part of a program, using just the PC and retire-delay fields. Depending on the optimization to be performed, other per-PC values may be summarized by averaging or other statistical metrics, such as minimum, maximum, or computing standard deviation. Given more time to process data, the profiling application may produce histograms of various instruction latencies.
- the effective memory address, branch target address, and branch history samples will likely require more expensive processing than the other fields. These fields can probably be ignored except when gathering data to perform specific optimization tasks. Given the inter-instruction fetch distance between instructions in cycles, the profiling application can also gather information about levels of concurrency.
- Filtering of the profiling information can also be done by hardware means, for example, a mask register, or programmable logic. For example, only sample when there was a cache miss, or when the instruction retired, or other Boolean combinations of opcodes, operands, addresses, events and latencies.
- the present profiling technique can be used to get a precise understanding of the internal operation of an out-of-order issue processor, such as the Alpha 21264 processor.
- an out-of-order issue processor such as the Alpha 21264 processor.
- an instruction might stall because some of its operands are not data ready, because some of the resources required for the execution of the selected instruction are unavailable, or because other instructions were chosen to execute ahead of it.
- the profiling technique described herein can also be used to perform N-wise sampling.
- the dynamic state of interactions between multiple concurrently processed transactions can be captured.
- two or more separate transactions are concurrently profiled.
- the dynamic "distance" between the selected transactions can be measured as the number of transactions submitted for processing, or the number of clock cycles that "separate" the paired transactions.
- Profile information for N-wise sampled instructions has many possible uses. First, the information can be analyzed to measure useful concurrency levels. This makes it possible to locate true bottlenecks. True bottlenecks are characterized by long stalls coupled with low concurrency. N-wise samples can also facilitate path profiling, and disambiguate candidate execution paths by constraining the paths to include at least two points along the path. Furthermore, from N-wise sampling it may also be possible to statistically reconstruct detailed processor pipeline states. Here, the selection of the group of instructions can be based on some measure of similarity between the instructions, for example, recent branch history, stalls, instruction types, or other recent state history.
- Pinpointing performance bottlenecks in out-of-order processors requires detailed information about both stall times and concurrency levels.
- a long-latency instruction is not problematic when there is sufficient concurrency to efficiently utilize the processor while the long-latency instruction is stalled.
- a different form of multi-way sampling can also be used to determine the average number of instructions processed by the pipeline over a fixed-size number of processor cycles.
- sampled state information it is also possible to use sampled state information to identify interesting cases while aggregating concurrency information. For example, it may be useful to compute the average concurrency level when a memory access transaction "hits" in one of the caches, and then to compare the average concurrency level with the case where a cache miss is incurred.
- Other interesting aspects to examine for correlation with varying concurrency levels include register dependent stalls, cache miss stalls, branch-misprediction stalls, and recent branch history.
- Path profiles are useful for numerous compiler optimizations, and trace scheduling.
- path profiles are disambiguated. Disambiguation improves with N-wise sampling; i.e., as N increases, disambiguation improves.
- concurrent profiling can reveal the relative order of execution of instructions at each stage of a processor pipeline for all executing instructions. Thus, one can now statistically reconstruct the actual operation of the execution pipeline in an operational system.
- microprocessors exploit all the tricks that computer architects allow in order to deliver the highest possible performance. These microprocessors fetch, issue, and commit multiple instructions per cycle. In addition, these processors execute instructions out-of-order. Some of them even execute memory operations out-of-order.
- performance characteristics can be quite variable because of the many heuristic mechanisms used by processors which issue instructions and memory operations out-of-order.
- the profiling techniques as described herein allow the system to measure a program's performance in sufficient detail so that the performance of the system 100 can automatically be improved.
- the present profiling techniques can also be used to perform optimization of the system 100.
- the following sections are intended to guide programmer and compiler-directed optimizations of software programs.
- cycles are lost in the processor pipeline due to branch or jump mispredictions, on-chip cache misses, and TLB faults. These are difficult, if not impossible, conditions to deduce statically. Cycles are also lost to delays in higher level off-chip operations because of cache misses, resource traps, and ordering traps. Lost cycles waste time.
- a basic block is defined as a set of instructions that are linearly executed as a unit, or not at all.
- Procedures generally are a cohesive set of basic blocks reached via call instructions. Procedures can include multiple basic blocks. Reordering of instructions in basic blocks and basic blocks in procedures can alter the execution flow and data accesses to optimize page and cache temporal localities, and to reduce the number of branches. Branches waste cycles since they only redirect the execution flow, and do no useful work on data. This optimization, as input, needs to know control-flow graph edge frequencies.
- a compiler needs control-flow graph edge or path frequencies.
- a trace scheduler might do an even better job when it has an estimate of how long it took to execute each basic block or a larger execution path. For a large scale operational system, such as the Alta Vista search engine, this is difficult to measure with traditional tools in real time.
- the branch history register as a moving window, can be used to view recent branch predictions, and influence future instruction fetching accordingly. By capturing the contents of this register at instruction fetch time, along with the PC of the instruction being sampled, it is sometimes possible to use static analysis of the control flow graph to hypothesize the exact path through the last N branches that the processor must have taken.
- asynchronous events that cause branched code to execute can pollute the branch history bits.
- these events should be relatively infrequent, and their occurrences in an operational system should be randomly distributed over the code. Because the goal is to identify high frequency paths, low frequency paths including those generated by "noisy" branch history bits generated by unpredictable asynchronous events can be ignored.
- TLBs translation look-aside buffers
- Prior art approaches have generally relied on either specialized hardware, or specialized software schemes for gathering cache miss addresses, such as periodically flushing the TLB.
- the observed miss patterns give an approximate understanding of the frequently accessed or "hot" pages which can be used to influence virtual-to-physical page mapping policies.
- address information necessary to do a complete analysis may not be available by the time the event is detected.
- Ideal instruction scheduling reorders code to minimize delays due to memory latencies. Although static ordering of neighboring instructions in a basic block is less important than it was for the previous generation of in-order RISC processors, macroscopic instruction scheduling is much more important in out-of-order processors.
- instruction scheduling is the scheduling of loads and stores. This is true because static schedulers do not always have exact dependency information which would allow them to optimally schedule the memory access instructions. In addition, it is difficult to exactly predict the latency of memory access instructions. Since instruction schedulers usually lack precise information about memory accesses, they generally schedule loads and stores assuming D-cache hits. For example, balanced scheduling tries to generate a schedule that includes an equal amount of latency per load. This is an improvement over always assuming that load/store operations will always hit in the cache.
- the present technique can be used to drive optimizations by collecting latency information without incurring the expense of a full cache simulation.
- Figure 4 shows the steps 401-404 of sampling the performance of any or all of the functional units 111-114 of the computer system 100.
- the samples are aggregated over time, and then analyzed.
- the analysis is used to dynamically update the system while it is operating.
- the sampling can be continued for the optimized system over time so that the system remains optimally “tuned” as load varies.
Description
- The present invention relates generally to optimising the performance of computer systems, and more particularly to gathering performance statistics by sampling, and analyzing the sampled statistics to guide system optimization.
- Computer systems are getting more sophisticated and faster, yet software application performance is not keeping pace. For example, in a typical four-way issue processor only about one in twelve of the available issue slots is being put to good use. It is important to understand why the software execution flow cannot take full advantage of the increased computing power available for processing instructions. Similar issues arise in other devices in computer systems, including graphics controllers, memory systems, input/output controllers, and network interfaces: actual performance is often less than the peak potential performance, and it is important to understand why.
- It is common to blame such problems for processors on memory latencies, in fact, many software applications spend many cycles waiting for data transfers to complete. Modern memories are typically arranged in a multi-level hierarchy. There, the data flow is complex and difficult to determine, especially when multiple contexts are concurrently competing for the same memory resource such as cache blocks. Other problems, such as branch mispredicts and cache misses also waste processor cycles and consume memory bandwidth for needlessly referenced data.
- Input/Output interfaces and network controllers of computer systems are also becoming more sophisticated. In many implementations, the interfaces and controllers include microprocessors and buffer memories whose dynamic behavior is becoming more difficult to measure and understand as complexity increases.
- Independent of the general causes, system architects, and hardware and software engineers need to know which transactions are stalling, what data are bottlenecked, and why in order to improve the performance of modern computer systems.
- Typically, this is done by generating a "profile" of the behavior of a computer system while it is operating. A profile is a record of performance data. Frequently, the profile is presented graphically or statistically so that performance bottlenecks can readily be identified.
- Profiling can be done by instrumentation and simulation. With instrumentation, additional code is added to executing programs to monitor specific events. Simulation attempts to emulate the behavior of the entire system in an artificial environment rather than executing the program in the real system. Also, instrumentation can only be used only for processor pipelines, not for other devices.
- Each of these two methods has its drawbacks. Instrumentation perturbs the system's true behavior due to the added instructions and extra data references. In other words, on large scale and complex systems instrumentation fails in two aspects. The system is slowed down, and the performance data is bad, or at best, sketchy.
- Simulation avoids perturbation and overhead. However, simulation only works for small well defined problems that can readily be modeled. It is extremely difficult, if not impossible, to simulate a large scale system, with thousands of users connected via fiber optic links to network controllers, accessing terabytes of data using dozens of multi-issue processors. Imagine modeling a Web search engine, such as Digital's Alta Vista, that responds to tens of millions of hits each day from all over the world. Each hit perhaps offering up hundreds Web pages as search results.
- Hardware implemented event sampling has been used to provide profile information for processors. Hardware sampling has a number of advantages over simulation and instrumentation: it does not require modifying software programs to measure their performance. Sampling works on complete systems, with a relatively low overhead. Indeed, recently it has been shown that low-overhead sampling-based profiling can be used to acquire detailed instruction-level information about pipeline stalls and their causes. However, many hardware sampling techniques lack flexibility because they are designed to measure specific events in isolation.
- It is desired to provide a generalized method and system for optimising the performance of operating computer systems. The method should be able to monitor processors, memory sub-systems, I/O interfaces, graphics controllers, network controllers, or any other component that manipulates digital signals.
- The monitoring should be able to sample arbitrary transactions and record relevant information about each. In contrast with event-based system, arbitrary transaction monitoring should allows one to monitor not only discrete events, but also events in any combination. It should also be possible to relate the sampled events to individual transactions such as instructions, or memory references, or contexts in which the transactions arose. In addition, it should be possible to relate the sampled data to multiple concurrent transactions in order to gain a true understanding of the system. All this should be possible, without perturbing the operation of the system, other than the time required to read the desired performance data.
- ROTH C ET AL: "PERFORMANCE MONITORING ON THE POWERPCTM 604 MICROPROCESSOR" INTERNATIONAL CONFERENCE ON COMPUTER DESIGN: VLSI IN COMPUTERS AND PROCESSORS, US, NEW YORK, IEEE, 2 October 1995 (1995-10-02), pages 212-215, XP00631915 discloses a system for optimising the performance of a computer system, said computer system comprises a plurality of functional units, said system for optimising comprising:
- a source for providing transactions to be processed by said computer system;
- means for selecting transactions for sampling to be processed by a plurality of functional units of the computer system;
- a processor and software for analysing the state information.
-
- According to the present invention, such a system is characterised by said transactions being concurrently sampled by said functional units; and
by buffers for storing state information while the selected transactions are processed by the functional units, said state information including at least one of an address information, a transaction source information, and a latency information,
wherein the buffers store state information as an aggregate of state information over time, and the aggregate of state information is analysed to estimate performance statistics of said computer system, the performance statistics being used to dynamically optimise the performance of the computer system while the computer system is operating. - Transactions to be processed by a particular functional unit of the computer system are selected for monitoring. The transactions can be selected concurrently. State information is stored while the selected transactions are processed by the functional unit. The state information is analysed to guide optimisation.
- In one aspect, multiple different functional units can concurrently be sampled.
- The invention also provides a method of optimising the performance of a computer system having a plurality of functional units, said method comprising the steps of:
- providing, from a source, transactions to be processed by said computer system;
- selecting transactions to be processed by a plurality of functional units of the computer system, said transactions being concurrently sampled by the functional units;
- storing state information as an aggregate of state information over time in buffers while the selected transactions are processed by the functional units, said state information including at least one of an address information, a transaction source information, and a latency information; and
- analysing the aggregrate of state information using a processor and software to estimate performance statistics of said computer system, the performance statistics being used to dynamically optimise the performance of the computer system while the computer system is operating.
-
- In the accompanying drawings:
- Figure 1 is a block diagram of a complex computer system to be sampled;
- Figure 2 is a block diagram of a mechanism for selecting transactions processed by the system of Figure 1 according to a preferred embodiment;
- Figure 3 is a block diagram of a sampling buffer; and
- Figure 4 is a block diagram of method for sampling and optimizing a computer systems.
-
- Figure 1 shows a
computer system 100. The computer system includes one or more functional units 111-114, for example processors, memories, input/output interface, and network controllers. Typically, the units 111-114 are connected to each other by buses, data channels, and networks, e.g., 150, depending on a particular configuration. - The
processors 111 can be of varied architecture, CISC or RISC, single or multi-issue, loosely or tightly coupled. Thememories 112 typically are arranged at hierarchical levels, memories closer to the processors having higher bandwidth and less storage, and farther memories having lower bandwidth and more storage. The memories can include on-chip and off-chip caches, SAM, DRAM, disk, and the like. The I/O interfaces 113 couple to peripheral devices. Some of the interfaces can include internal processors and memories. Thenetwork controllers 114 can interface to local and wide area networks. - During operation of the
system 100, transactions (T) 101 are generated by asource 110 as input for the system. The various functional units 111-114 of thesystem 110 process thetransactions 101 to provideoutput 102 for adrain 120. It should be noted, that the transactions can originate from outside the system, or from within due to the processing. In addition, the processing of transactions, for example, instructions, usually generates many additional internal transactions such as memory references, disk transfers, or network messages. - While the
transactions 101 are processed,events 104 are signaled, e.g., instruction aborts and traps, cache misses, clock cycles, exception conditions, and so forth. Theactual events 104 that can be signaled depend on the implementation of the functional units 111-114. - While the
system 100 is operating,state 130 is maintained. Thestate 130 is usually distributed over the functional units. Processing the transactions causes state transitions. Some of the state transitions may be of particular interest to an understanding of the performance of the system. - In order to perform the sampling of transactions, events, and state, the transactions are presented to a transaction selector. The selector may be replicated for the different functional units 111-114 using a common design as described herein.
- In general terms, the selector needs a means for choosing transactions based on the state of the system and the transaction itself. Although not part of the invention, transactions can be chosen randomly, for example, by initializing a counter to a randomly chosen value, incrementing the counter for each transaction, and selecting a transaction when the counter overflows (or underflows). Transactions can be chosen only from those possessing certain properties (for example by incrementing the counter only for transactions matching a specified set of properties), or can be chosen only when the system is in certain states (by incrementing the counter only when in a specified state).
- Figure 2 shows the salient features of one possible implementation of a
selector 200. Theselector 200 includes atrigger 210, acounter 220, and amarker 230. - The
counter 220 is set and reset (initialized) with a value (init value) 221 on line 222. Thevalue 221 can be generated by hardware (HW) 223 or software (SW) 224. As will be described below, thevalue 221, in part, determines a rate of sampling, small initial values increase the rate of sampling, and large values decrease the rate of sampling. If the counter counts down, then small initial values increase the rate of sampling and large initial values decrease the rate. - As an advantage, the
value 221 can uniformly and randomly be chosen from an interval of integers. The average rate of sampling can be adjusted by choosing an appropriate interval of integers from which thevalue 221 is chosen. - The
counter 220 is incremented (or decremented depending on design) by a counter event signal received online 225. Thecounter event signal 225 can be selected from one or more event signals (event1, event2, event3) 104 by a count select signal online 229. The event signals 104 can include clock cycles, transactions available for processing, transactions accepted for processing, and so forth. - The
trigger 210 determines when and under what conditions thecounter 220 counts up (or down), and themarker 230 determines which transactions are marked as selected transactions (T) 103. - Therefore, the
trigger 210 receives thetransactions 101,events 104, andstate 130, depending on the particular functional unit which is sampled. The current transaction information, the events, and state are logically combined by thetrigger 210 using a function, for example, a logical function including Boolean operators (AND, OR, NOT). If the result of the combination is true, then thecounter 220 is enabled for counting, otherwise, if false, then it is not. - Some specific examples of useful trigger functions include, but are not limited to, those that match on: any transaction, transactions of a particular type (memory reference instructions, transactions that reference a particular level of the memory hierarchy, e.g., a particular cache or cache block), transactions that will cause a particular state transition, e.g., dirty data evictions, transactions that reference a particular region in the memories, e.g., a range of addresses, a particular cache line, a particular cache block within a particular cache line, a particular region of the cache, etc., transactions from a particular source, e.g., from a processor pipeline, from an I/O interface, e.g., a direct memory access, transactions related to data coherency messages, and so forth. It should be noted that the
trigger 210 is programmable by either the hardware 223 or the software 224. - The use of the trigger function 250 enables the sampling hardware to skip specified transactions. For example, in a sophisticated function example, this would allow one to count three access transactions to a particular cache block, and then to gather memory transaction samples for the next two misses to that same block. In another useful example, one can trigger marking after a transaction originating from a particular context, such as a processor, a process a thread, and I/O interface, and then gather samples for a specified number of subsequent transactions, or a specified amount of time.
- The
marker 230 identifies a transaction as a selected transaction T' 103 whenever the counter overflows (or underflows). At this point thecounter 220 can be reset with anew value 221. It should be noted, that the value can dynamically change depending on what type of sampling is desired, detailed sampling over a short interval of time with many samples, or low overhead general sampling over a longer interval of time using random sampling. - The
marker 230 is also configured so that it can receiveevents 104 andstate 130, as well as the transactions. The job of themarker 230 is to determine whether the current transaction is of interest for sampling at the time that marking is triggered due to thecounter 220 overflowing, if not, than the transaction can be ignored, and the counter can be reset. - The various functions that actually cause the
marker 230 to select a transaction include, but are not limited to, transactions that reference a particular level in the memory hierarchy, references to a particular region of memory within a particular level of the memory hierarchy, transactions of a particular type, e.g., branch instructions, transactions having an associated event, e.g., a miss, a branch mispredict, an abort, a particular state transition, e.g., dirty evictions, transactions originating from a particular source, e.g., an instruction executing in the processor pipeline, an instruction execution from a particular context, process, thread, or address space, direct memory access from an input/output interface, cache coherency messages in a multiprocessor computer system, and so forth. - The marking of the selected transaction can be achieved by providing the transaction with an additional "sample" bit, e.g., from T to T'. For example, if the transaction is an instruction, the instruction field is augmented with an additional bit which is carried with the transaction until the transaction is completely processed. Alternatively, the transactions are numbered or otherwise identified. In the present invention, multiple transactions are selected concurrently, in which case multiple bits are needed to mark them.
- After a transaction has been selected for sampling, the corresponding functional unit that will process the
marked transaction 103 checks the sample bit at each pertinent stage ofprocessing, and collect state information available to it. The collected state information is stored in a plurality of buffers, described in detail below. When more than one buffer is used multiple transactions can concurrently be sampled. The location of the buffer is a designer's choice, preferably close to where sample information is generated. - Some state information can be recorded before the transaction is processed by the functional unit to capture an initial state, and additional information can be recorded after the transaction completes to capture a final state. After a specified number of transactions have been recorded, for example, when the sampling buffer is full, a read signal can be generated. The read signal can be in the form of an interrupt, a software pollable value set in a register, or an exception condition. The read signal can enable software to read the sampled data for further processing.
- It should be noted, that multiple buffers can be used to collect multiple samples. Increasing the number of buffers amortizes the cost of sampling overhead, by transferring more than one sample per read signal.
- Termination of processing of a sample transaction can be complete processing of the transaction, or abortion of the processing due to arriving at some incorrect or illegal state, or interruption of the processing due to some external event.
- Figure 3 shows the details of how a
buffer 300 can be allocated for storing state information. Thebuffer 300 can be implemented as a set of software readable registers, or other types of memories. The buffer includes astatus field 310, anaddress field 320, acontext field 330, atransaction source field 340, aninstruction field 350, alatency field 360, and fields 370 for other states and events. - The
status field 310 stores state information pertaining to the particular transaction being processed. For example, if the transaction is a memory reference, the state can indicate whether a cache block is dirty or clean (modified or not), exclusive (non-shared), valid or invalid (the data are legitimate), and cache hit or miss status. - The
address field 320 can store the virtual and/or physical addresses associated with the transaction. - The
context field 330 can store the address space number (ASN), the hardware context identifier (HCI) in case of a multi-threaded processor, a process identifier (PID), and/or a thread identifier (TID) of the source of the transaction. The field can also store the address space number (ASN) referenced by the transaction. - The
source field 340 can be used to store the source of the transaction, e.g., a load or store instruction, a DMA request, or cache coherency protocol operation, as well as additional information to identify the source, depending on the particular functional unit. - If the source of the transaction is a fetch unit of processor pipeline, then the program counter (PC) of the instruction can be stored in the
instruction field 350. Theprogram counter field 350 can also be used to store information about other kinds of sources to save a register. For example, if the source is a coherency operation from another processor in a multiprocessor computer system, then thefield 350 can be used to hold the processor number of the processor originating the DMA request that caused the coherency operation. For DMA type of transactions, the identity of the I/O device that initiated the DMA can be stored. - The time interval (latency) between successive transactions or successive stages of transaction processing can be stored in the
latency field 360. The interval can be measured in terms of processor clock cycles, or the interval can be measured in other units such as the number of transactions processed. The interval can also be broken down into the time required to process the transaction at each level of a memory hierarchy (in case of sampling memory performance), or stages of a processor pipeline (in the case of a processor). - Additional registers such as
field 370 can be added to this structure to store additional system state that is captured at the time that the sampled transaction is processed. This state can include the contents or number of valid entries in memory system structures such as write buffers, victim caches, translation lookaside buffers (TLBs), miss-address files (MAFs), and memory transaction queues, in the case of a functional memory unit. - A brief outline of some example sampling strategies are now given. The present invention can be used to perform concurrent sampling.
- One way that interesting information can be collected is by sampling at least two consecutive transactions, i.e., a "pair." By way of example, two memory references to the same cache block, or two related instructions. Pairwise sampling can be expended to N-wise sampling over a predetermined time window.
- Therefore, the apparatus and method disclosed herein can sample transactions to: specific cache blocks clean or dirty, specific regions of memories, all memory locations, all memory locations where cache blocks are dirty, to memory locations where the data are not in the cache.
- The notion of storing state information for successive transactions can be generalized to sequential accesses that match simple, software specified criteria, such as successive misses, successive hits, successive invalidations, and so forth.
- Additionally, the sampling techniques as described herein permit a fine grained monitoring of functional units with low hardware overhead. This information can be used in many ways. For example, the collected information can help system designers to better understand the performance of processor and memory sub-systems, such as caches, DRAM, and the like. The performance data is used to guide optimizations.
- For example, to estimate the extent of memory sharing, one can select pairs of memory transactions where the second transaction in the pair is a cache hit. This indicates that there was sharing between the first and second transaction. By examining the context identifying information associated with both samples, it is possible to determine which contexts usefully shared this physical space during the sampled time interval. By aggregating this information over many such pairs of samples, one can statistically estimate metrics concerning both intra-context and inter-context sharing of physical locations.
- One useful metric is determined by counting the number of pairs where the first pair in the sample matches one specific context, and where the second pair in the sample matches a second specific context, effectively yielding a matrix of counts that is indexed by the identifiers of the first and second contexts. Similarly, by analyzing pairs where the second sampled transaction experienced a cache miss, one can statistically estimate metrics concerning intra-context and inter-context conflict for physical locations.
- An alternative use of this hardware is to choose a specific cache region to monitor. The chosen region corresponds to the space in the cache that stores a particular program variable or data structure. By collecting samples and filtering the samples to obtain sample pairs where at least one of the transactions involves the variable or data structure of interest, it is possible to estimate cache conflict rates and to identify other specific program variables or data structures that are the sources of the conflicts.
- This estimation can be done dynamically to enable on-line program debugging or optimization of performance problems within a running program or system. This technique enables programmers to interactively debug memory system performance by identifying conflicts in executing programs that are investigated. Similar techniques can be used by adaptive runtime software to avoid severe cache conflicts through dynamic data relocation.
- Sampling individual memory system transactions makes it possible to compute a variety of statistical metrics about distributions of properties of memory system behavior. For example, it is possible to estimate distributions of latencies to service memory requests, or to estimate rates of cache hits at a particular level or region in the memory hierarchy. Filtering mechanisms can be used to identify subsets of the recorded transactions that are of interest, permitting the statistics to focus in on particular aspects of the memory system that are of interest, such as transactions to a particular region or level in the memory hierarchy, or a particular class of transactions such as reads, writes, or invalidates.
- After a set of samples of interest has been identified, standard statistical techniques can be used to derive averages, standard deviations, histograms and other statistics about the samples of interest. Averages can be used to estimate rates of occurrence for particular events, such as cache hits or misses, or evictions.
- It is also possible to estimate the fraction of requests due to reads, writes, or invalidates. These rates can also be estimated with respect to a particular context, so as to estimate metrics such as cache hit rates per process, or average memory system latency experienced by a thread. It is also possible to estimate the fraction of a level of the memory hierarchy that is being consumed by a particular context.
- Standard error estimation techniques can be used to obtain confidence intervals on the accuracy of the derived statistics. In particular, for statistics that involve a number of samples with a specific property, error bounds can be approximated using the reciprocal of the square root of the number of samples with that property. These error bounds can also be used to dynamically control the rate at which selected transactions are sampled, so as to trade off accuracy with sampling overhead.
- When the recorded state information includes latency information, either in the form of the latency required to process the memory transaction, or in terms of the latency between two consecutive sampled memory transactions, the information can be used to compute latency-based statistics. Latency is typically measured in units of time, such as processor clock cycles, but may also be measured in other units, such as the number of memory transactions processed.
- In a very general sense, processors execute instructions that operate on data. In many modern computer systems, the instructions and data are usually maintained as separate structures using different memory pages because the access patterns for instructions is quite different than that for data. Virtual to physical memory mapping for instructions and data is usually performed by the operating system. Alternatively, relocation of structures can be done manually, or by compilers, linkers, and loaders. Some systems can relocate structures dynamically as the instructions execute.
- Using the hardware described herein, it is possible to give feedback to a variety of interesting pieces of software. For example, sampled memory transaction state information can be used to drive, for example, page remapping policies, or to avoid self-interference by providing feedback to compilers, linkers, or loaders.
- For example, software can aggregate conflicting addresses at the page level to inform dynamic page-remapping algorithms implemented by operating systems. It is also possible to provide interesting profiling tools that identify potential performance problems to programmers and users.
- For example, it is now possible to estimate how often data are dirty when the data are evicted, and how often DMA transfers or cache coherency protocol transactions occur, giving a sense of how effectively the memory system is being used.
- In non-uniform memory access (NUMA) multiprocessor systems, each processor has portions of the memory system that it can access more quickly (or with higher bandwidth) than other pieces of the memory system. In order to improve performance, data (which can either be program data or instructions) that are frequently accessed by a processor can be moved to a region of the memory system that can be accessed more quickly by that processor.
- This motion can be accomplished in two ways. The data can be replicated by making multiple copies of the data. Ideally, the data are judiciously "scattered" throughout the memory system. Alternatively, the data can be migrated by actually moving the data into a lower latency or higher bandwidth memory.
- Information about the type of accesses (e.g., reads, writes, and invalidates) can further guide the decision of whether to replicate or to migrate, or to leave the data in place. For example, data that are frequently written by multiple processors (e.g., write-shared pages) should probably not be replicated or migrated, while data that are frequently read but only infrequently written (e.g., read-shared pages) are good candidates for replication. Pages that are heavily accessed by only a single processor are good candidates for migration to a memory that is closer to the accessing processor. This information can be gathered by statistical sampling of memory system transaction information as described herein.
- The information about memory system transactions is aggregated dynamically and can be used in an on-line manner to dynamically control the replication and migration policies of the computer system. Typically, replication and migration are handled by the operating system, but they can also be handled by other software or hardware layers.
- There are several potential performance metrics that replication or migration policies can attempt to improve, including an increase in total system throughput, an increase in throughput for particular high-priority jobs, a decrease in traffic between processors and memories, a decrease in total memory latency, or an overall increase in system performance.
- Because caches in a hierarchical memory store data originating from various hardware contexts, threads executing in different hardware contexts compete for lines in a cache. Therefore, it is desired to schedule threads so that resource conflicts are minimized. This can be done by sampling memory system transaction information as described herein.
- Scheduling decisions can benefit from considering various metrics, including increasing the amount of sharing among contexts competing for memory resources or decreasing conflicts among contexts competing for memory resources.
- For example, it makes sense to preferentially co-schedule a thread that has a large cache footprint concurrently with a thread that is making only modest use of the cache, because the memory system demands of such threads complement each other, thereby increasing sharing. Also, it makes sense to use, as much as possible, non-overlapping regions of the cache.
- On the other hand, the operating system software should strive to avoid co-scheduling two threads with large cache footprints, where possible, because this will result in many more conflict misses as the threads evict each other's useful data from the cache, thereby decreasing conflicts.
- By capturing old and new context identifiers as part of a cache monitor, the operating system software can statistically estimate the degree to which different contexts are sharing and conflicting in the cache. These estimates can be supplied to a scheduler.
- Judicious scheduling is especially important for multithreaded processors where memory references from different hardware contexts are interleaved at a very fine-grained level, and the relevance is increased when these contexts share memory system resources, such as caches. However, it is also important for single-threaded processors when the caches are large enough relative to the number of memory transactions made by a thread during a scheduling quantum. Then there is some hope of retaining some useful cache contents when the next quantum is allocated to a particular context. All of these scheduling decisions can dynamically adapt to feedback gathered from statistical sampling of memory system transactions during on-line operation.
- Share-based or proportional-share scheduling policies ideally want to give each context a specified share of each cache memory in the memory hierarchy. With the present sampling technique, it is possible to statistically estimate the portion of cache occupied by each context. This allows the scheduler to base its decisions on metrics such as giving each process a specified share of the memory system resources, effectively partitioning memory system resources among contexts in proportion to their needs.
- To accomplish this, contexts which occupy more than their allotted share can be slowed down or suspended. While some contexts are suspended, others can increase their share of the cache. The suspended context can be allowed to continue after its cache usage has decreased as a result of increased cache pressure from other active contexts. This can be distinguished from known approaches that generally do not allow information to be monitored at the cache line or block level, other than through simulation.
- All of these scheduling decisions can dynamically adapt to feedback gathered from statistical sampling of memory system transactions during on-line operation.
- The profiling hardware described above can be utilized in a variety of different ways. Because the present technique provides very detailed information about the processing of individual transactions such as instructions, one application could profile a large number of instructions. The sample information can be stored in a memory buffer for later processing by profiling tools to produce detailed instruction-level information.
- The information can be used to develop, for example, histograms of load latencies for each load instruction, histograms of instruction execution times, and perhaps even a moderately comprehensive analysis of the pipeline state for each instruction. Because the amount of information provided by this approach is likely to be quite high, the overall memory overhead of the present technique is also likely to be quite high because a substantial amount of memory traffic is involved. For example, if a billion instructions are fetched per second, and sampling is performed every 10,000 fetched instructions, then the data rate for the profile information will be approximately 2.4 MB per second.
- The following sections describes software-implemented methods for reducing bandwidth by aggregating profile information.
- The volume of sampled data can be reduced by ignoring some fields of the profile record, e.g., the data in the
buffer 300, except when they are explicitly requested. A user of thesystem 100 may desire different levels of profiling. In a lowest overhead mode, the profiling application software can generate a profile report for all or part of a program, using just the PC and retire-delay fields. Depending on the optimization to be performed, other per-PC values may be summarized by averaging or other statistical metrics, such as minimum, maximum, or computing standard deviation. Given more time to process data, the profiling application may produce histograms of various instruction latencies. - The effective memory address, branch target address, and branch history samples will likely require more expensive processing than the other fields. These fields can probably be ignored except when gathering data to perform specific optimization tasks. Given the inter-instruction fetch distance between instructions in cycles, the profiling application can also gather information about levels of concurrency.
- Filtering of the profiling information can also be done by hardware means, for example, a mask register, or programmable logic. For example, only sample when there was a cache miss, or when the instruction retired, or other Boolean combinations of opcodes, operands, addresses, events and latencies.
- The present profiling technique can be used to get a precise understanding of the internal operation of an out-of-order issue processor, such as the Alpha 21264 processor. One of the first things to notice about this type of machine organization is that there are many places where an instruction might stall in the pipeline, and a large number of reasons why it might stall.
- For example, an instruction might stall because some of its operands are not data ready, because some of the resources required for the execution of the selected instruction are unavailable, or because other instructions were chosen to execute ahead of it.
- Determining exactly where an instruction stalled, why it stalled, and how long it stalled depends heavily on the precise state of the machine when that instruction is executed. Because the processor is so dynamic, it is difficult for software performance tools to determine this state statically.
- The profiling technique described herein can also be used to perform N-wise sampling. Here, the dynamic state of interactions between multiple concurrently processed transactions can be captured. Instead of profiling a single transaction, two or more separate transactions are concurrently profiled. The dynamic "distance" between the selected transactions can be measured as the number of transactions submitted for processing, or the number of clock cycles that "separate" the paired transactions.
- Profile information for N-wise sampled instructions has many possible uses. First, the information can be analyzed to measure useful concurrency levels. This makes it possible to locate true bottlenecks. True bottlenecks are characterized by long stalls coupled with low concurrency. N-wise samples can also facilitate path profiling, and disambiguate candidate execution paths by constraining the paths to include at least two points along the path. Furthermore, from N-wise sampling it may also be possible to statistically reconstruct detailed processor pipeline states. Here, the selection of the group of instructions can be based on some measure of similarity between the instructions, for example, recent branch history, stalls, instruction types, or other recent state history.
- Pinpointing performance bottlenecks in out-of-order processors requires detailed information about both stall times and concurrency levels. In contrast to in-order processors, a long-latency instruction is not problematic when there is sufficient concurrency to efficiently utilize the processor while the long-latency instruction is stalled.
- One approach for obtaining concurrency information is to snapshot the entire pipeline state. That will directly reveal where sets of concurrently executing instructions are in the stages of the pipeline at a given point in time. However, "dumping" the entire pipeline state into sampling registers and buffers could be extremely costly, both in time and space. Furthermore, the voluminous data produced probably cannot be efficiently aggregated to amortize the cost of sampling. Worse yet, this approach is actually insufficient because only those instructions that retire are counted as "useful," and information about which instructions fetched but may abort is not yet known.
- A different form of multi-way sampling can also be used to determine the average number of instructions processed by the pipeline over a fixed-size number of processor cycles.
- It is also possible to use sampled state information to identify interesting cases while aggregating concurrency information. For example, it may be useful to compute the average concurrency level when a memory access transaction "hits" in one of the caches, and then to compare the average concurrency level with the case where a cache miss is incurred. Other interesting aspects to examine for correlation with varying concurrency levels include register dependent stalls, cache miss stalls, branch-misprediction stalls, and recent branch history.
- An additional benefit of profiling a cluster of instructions is the ability to obtain path profiles. Path profiles are useful for numerous compiler optimizations, and trace scheduling.
- Furthermore, by constraining multiple points along a program's execution path together with recent branch taken history, path profiles are disambiguated. Disambiguation improves with N-wise sampling; i.e., as N increases, disambiguation improves. For heavily executed code, concurrent profiling can reveal the relative order of execution of instructions at each stage of a processor pipeline for all executing instructions. Thus, one can now statistically reconstruct the actual operation of the execution pipeline in an operational system.
- The latest generation of microprocessors exploit all the tricks that computer architects allow in order to deliver the highest possible performance. These microprocessors fetch, issue, and commit multiple instructions per cycle. In addition, these processors execute instructions out-of-order. Some of them even execute memory operations out-of-order.
- Unfortunately, performance characteristics can be quite variable because of the many heuristic mechanisms used by processors which issue instructions and memory operations out-of-order. As an advantage, the profiling techniques as described herein allow the system to measure a program's performance in sufficient detail so that the performance of the
system 100 can automatically be improved. - The present profiling techniques can also be used to perform optimization of the
system 100. The following sections are intended to guide programmer and compiler-directed optimizations of software programs. - Because out-of-order superscalar microprocessors reschedule instructions according to data and resource availability, compile-time instruction scheduling is much less important than it is for architecturally simpler processors. Now, major bottlenecks are due to instruction fetching and memory operations.
- Specifically, cycles are lost in the processor pipeline due to branch or jump mispredictions, on-chip cache misses, and TLB faults. These are difficult, if not impossible, conditions to deduce statically. Cycles are also lost to delays in higher level off-chip operations because of cache misses, resource traps, and ordering traps. Lost cycles waste time.
- With conventional event counters, one can measure the aggregate number of these performance-debilitating events, but it is extremely difficult, if not impossible to attribute lost cycles to a particular instruction in the program. The profiling technique as described herein allows a user to measure major performance problems and correlating problems to the specific instructions.
- One front-end optimization that helps performance is the reordering of instructions in basic-blocks and basic blocks in procedures. A basic block is defined as a set of instructions that are linearly executed as a unit, or not at all. Procedures generally are a cohesive set of basic blocks reached via call instructions. Procedures can include multiple basic blocks. Reordering of instructions in basic blocks and basic blocks in procedures can alter the execution flow and data accesses to optimize page and cache temporal localities, and to reduce the number of branches. Branches waste cycles since they only redirect the execution flow, and do no useful work on data. This optimization, as input, needs to know control-flow graph edge frequencies.
- Similarly, in order to perform trace scheduling of instructions, a compiler needs control-flow graph edge or path frequencies. A trace scheduler might do an even better job when it has an estimate of how long it took to execute each basic block or a larger execution path. For a large scale operational system, such as the Alta Vista search engine, this is difficult to measure with traditional tools in real time.
- Many compiler optimizations, such as trace scheduling and hot-cold optimization rely on knowing which execution paths are frequently taken through a program. These are called "hot" paths. Until recently, frequently executed paths were inferred by profiling the program, either through instrumentation or simulation, to gather basic block or edge counts, and then, using these counts, to indirectly infer the hot and cold paths.
- More recently, techniques have been used to gather path information directly. Although these techniques give exact path information, they also tend to have a fairly high overhead, making them unsuitable for measuring active large scale computer systems. With the present profiling, path information can randomly be captured, at a minimal overhead, and still reflect a statistically correct view of actual execution flows.
- Most modem microprocessors keep track of the directions of the last N branches in a global branch history register. The branch history register, as a moving window, can be used to view recent branch predictions, and influence future instruction fetching accordingly. By capturing the contents of this register at instruction fetch time, along with the PC of the instruction being sampled, it is sometimes possible to use static analysis of the control flow graph to hypothesize the exact path through the last N branches that the processor must have taken.
- However, since conventional history registers usually contain only the directions of the branches and not the actual target destinations, the information can be imprecise. In particular, merges in control flows can create ambiguities in identifying actual paths taken.
- Also, asynchronous events that cause branched code to execute, such as interrupts or context switches, can pollute the branch history bits. However, these events should be relatively infrequent, and their occurrences in an operational system should be randomly distributed over the code. Because the goal is to identify high frequency paths, low frequency paths including those generated by "noisy" branch history bits generated by unpredictable asynchronous events can be ignored.
- Other information about recent execution history of the process can also aid in identifying the execution path that has been taken to get to a particular instruction. One piece of information that is useful is the knowledge of a second PC value of an instruction that was recently executed. By using multiple PC values, perhaps with N-wise sampling, paths including only one PC can be eliminated.
- High miss rates in caches or translation look-aside buffers (TLBs) can significantly degrade the performance of the system. Prior art approaches have generally relied on either specialized hardware, or specialized software schemes for gathering cache miss addresses, such as periodically flushing the TLB. The observed miss patterns give an approximate understanding of the frequently accessed or "hot" pages which can be used to influence virtual-to-physical page mapping policies. However, address information necessary to do a complete analysis may not be available by the time the event is detected.
- One important task performed during code optimization is ideal instruction scheduling. Ideal instruction scheduling reorders code to minimize delays due to memory latencies. Although static ordering of neighboring instructions in a basic block is less important than it was for the previous generation of in-order RISC processors, macroscopic instruction scheduling is much more important in out-of-order processors.
- One very difficult aspect of instruction scheduling is the scheduling of loads and stores. This is true because static schedulers do not always have exact dependency information which would allow them to optimally schedule the memory access instructions. In addition, it is difficult to exactly predict the latency of memory access instructions. Since instruction schedulers usually lack precise information about memory accesses, they generally schedule loads and stores assuming D-cache hits. For example, balanced scheduling tries to generate a schedule that includes an equal amount of latency per load. This is an improvement over always assuming that load/store operations will always hit in the cache.
- If one gathers load and store latencies via random sampling, then one can schedule each instruction according to its histogram of latencies. The present technique can be used to drive optimizations by collecting latency information without incurring the expense of a full cache simulation.
- Figure 4 shows the steps 401-404 of sampling the performance of any or all of the functional units 111-114 of the
computer system 100. The samples are aggregated over time, and then analyzed. The analysis is used to dynamically update the system while it is operating. The sampling can be continued for the optimized system over time so that the system remains optimally "tuned" as load varies. - The foregoing description has been directed to specific embodiments-It will be apparent to those skilled in the art that modifications may be made to the described embodiments, with the attainment of all or some of the advantages.
Claims (10)
- A system for optimising the performance of a computer system (100), said computer system comprises a plurality of functional units (111-114), said system for optimising comprising:wherein the buffers (300) store state information as an aggregate of state information over time, and the aggregate of state information is analysed to estimate performance statistics of said computer system (110), the performance statistics being used to dynamically optimise the performance of the computer system (110) while the computer system is operating.a source (110) for providing transactions (101) to be processed by said computer system;means (200) for selecting transactions for sampling to be processed by a plurality of functional units of the computer system;a processor (111) and software for analysing the state information; characterised bysaid transactions being concurrently sampled by said functional units; andby buffers (300) for storing state information (130) while the selected transactions (103) are processed by the functional units, said state information including at least one of an address information (320), a transaction source information (340), and a latency information (360),
- A system according to claim 1, wherein said selecting means (230) selects a plurality of concurrently processed transactions (101).
- A system according to either claim 1 or claim 2, wherein the transactions (101) are instructions executed by the processor (111), said processor being one of said plurality of functional units.
- A system according to either claim 1 or claim 2, wherein the transactions (101) are data accesses provided to a memory subsystem (112), said memory subsystem being one of said plurality of functional units.
- A system according to either claim 1 or claim 2, wherein the transactions (101) are network messages processed by a network controller (114), said network controller being one of said plurality of functional units.
- A system according to any one of the preceding claims, wherein the state information (130) is stored in said memory before and after the selected transactions (103) are analysed.
- A system according to claim 1, wherein the state information (130) is read and stored after a predetermined number of selected transactions (101) have been selected by said selecting means (200).
- A system according to any one of the preceding claims, wherein the functional units (111-114) include processors (111), memories (112), I/O interfaces (113), and network controllers (114).
- A system according to any one of the preceding claims, wherein the means (200) for selecting is a selector having means for controlling the sampling rate of said selector, said selector concurrently selecting transactions including executable and memory reference instructions to execute in order to sample the flow rate of data in and out of the memory; and wherein the rate data flows in and out of the memory are analysed to enable optimisation of the computer system.
- A method of optimising the performance of a computer system (110) having a plurality of functional units (111-114), said method comprising the steps of:providing, from a source (110), transactions (101) to be processed by said computer system;selecting transactions to be processed by a plurality of functional units of the computer system, said transactions being concurrently sampled by the functional units;storing state information (130) as an aggregate of state information over time in buffers (300) while the selected transactions are processed by the functional units, said state information including at least one of an address information (320), a transaction source information (340), and a latency information (360); andanalysing the aggregrate of state information using a processor (111) and software to estimate performance statistics of said computer system, the performance statistics being used to dynamically optimise the performance of the computer system (110) while the computer system is operating.
Applications Claiming Priority (2)
| Application Number | Priority Date | Filing Date | Title |
|---|---|---|---|
| US08/980,124 US6374367B1 (en) | 1997-11-26 | 1997-11-26 | Apparatus and method for monitoring a computer system to guide optimization |
| US980124 | 1997-11-26 |
Publications (3)
| Publication Number | Publication Date |
|---|---|
| EP0919919A2 EP0919919A2 (en) | 1999-06-02 |
| EP0919919A3 EP0919919A3 (en) | 2000-02-23 |
| EP0919919B1 true EP0919919B1 (en) | 2004-06-23 |
Family
ID=25527371
Family Applications (1)
| Application Number | Title | Priority Date | Filing Date |
|---|---|---|---|
| EP98309634A Expired - Lifetime EP0919919B1 (en) | 1997-11-26 | 1998-11-25 | System and method for optimising the performance of a computer system |
Country Status (4)
| Country | Link |
|---|---|
| US (1) | US6374367B1 (en) |
| EP (1) | EP0919919B1 (en) |
| JP (1) | JPH11272519A (en) |
| DE (1) | DE69824688T2 (en) |
Cited By (12)
| Publication number | Priority date | Publication date | Assignee | Title |
|---|---|---|---|---|
| US9158660B2 (en) | 2012-03-16 | 2015-10-13 | International Business Machines Corporation | Controlling operation of a run-time instrumentation facility |
| US9250903B2 (en) | 2012-03-16 | 2016-02-02 | International Business Machinecs Corporation | Determining the status of run-time-instrumentation controls |
| US9280346B2 (en) | 2012-03-16 | 2016-03-08 | International Business Machines Corporation | Run-time instrumentation reporting |
| US9280447B2 (en) | 2012-03-16 | 2016-03-08 | International Business Machines Corporation | Modifying run-time-instrumentation controls from a lesser-privileged state |
| US9367313B2 (en) | 2012-03-16 | 2016-06-14 | International Business Machines Corporation | Run-time instrumentation directed sampling |
| US9367316B2 (en) | 2012-03-16 | 2016-06-14 | International Business Machines Corporation | Run-time instrumentation indirect sampling by instruction operation code |
| US9372693B2 (en) | 2012-03-16 | 2016-06-21 | International Business Machines Corporation | Run-time instrumentation sampling in transactional-execution mode |
| US9395989B2 (en) | 2012-03-16 | 2016-07-19 | International Business Machines Corporation | Run-time-instrumentation controls emit instruction |
| US9400736B2 (en) | 2012-03-16 | 2016-07-26 | International Business Machines Corporation | Transformation of a program-event-recording event into a run-time instrumentation event |
| US9405541B2 (en) | 2012-03-16 | 2016-08-02 | International Business Machines Corporation | Run-time instrumentation indirect sampling by address |
| US9454462B2 (en) | 2012-03-16 | 2016-09-27 | International Business Machines Corporation | Run-time instrumentation monitoring for processor characteristic changes |
| US9483268B2 (en) | 2012-03-16 | 2016-11-01 | International Business Machines Corporation | Hardware based run-time instrumentation facility for managed run-times |
Families Citing this family (67)
| Publication number | Priority date | Publication date | Assignee | Title |
|---|---|---|---|---|
| US6742003B2 (en) * | 2001-04-30 | 2004-05-25 | Microsoft Corporation | Apparatus and accompanying methods for visualizing clusters of data and hierarchical cluster classifications |
| US6954923B1 (en) | 1999-01-28 | 2005-10-11 | Ati International Srl | Recording classification of instructions executed by a computer |
| US8074055B1 (en) | 1999-01-28 | 2011-12-06 | Ati Technologies Ulc | Altering data storage conventions of a processor when execution flows from first architecture code to second architecture code |
| US8127121B2 (en) | 1999-01-28 | 2012-02-28 | Ati Technologies Ulc | Apparatus for executing programs for a first computer architechture on a computer of a second architechture |
| US7275246B1 (en) * | 1999-01-28 | 2007-09-25 | Ati International Srl | Executing programs for a first computer architecture on a computer of a second architecture |
| US6826748B1 (en) | 1999-01-28 | 2004-11-30 | Ati International Srl | Profiling program execution into registers of a computer |
| US7941647B2 (en) | 1999-01-28 | 2011-05-10 | Ati Technologies Ulc | Computer for executing two instruction sets and adds a macroinstruction end marker for performing iterations after loop termination |
| US8121828B2 (en) * | 1999-01-28 | 2012-02-21 | Ati Technologies Ulc | Detecting conditions for transfer of execution from one computer instruction stream to another and executing transfer on satisfaction of the conditions |
| US7111290B1 (en) | 1999-01-28 | 2006-09-19 | Ati International Srl | Profiling program execution to identify frequently-executed portions and to assist binary translation |
| US6636905B1 (en) * | 1999-03-26 | 2003-10-21 | Unisys Corporation | Method for analyzing input/output performance of a data processing system |
| US6779107B1 (en) | 1999-05-28 | 2004-08-17 | Ati International Srl | Computer execution by opportunistic adaptation |
| US6748589B1 (en) | 1999-10-20 | 2004-06-08 | Transmeta Corporation | Method for increasing the speed of speculative execution |
| US7197431B2 (en) * | 2000-08-22 | 2007-03-27 | International Business Machines Corporation | Method and system for determining the use and non-use of software programs |
| US7103877B1 (en) * | 2000-11-01 | 2006-09-05 | International Business Machines Corporation | System and method for characterizing program behavior by sampling at selected program points |
| US6772370B1 (en) * | 2000-11-03 | 2004-08-03 | Freescale Semiconductor, Inc. | Method and apparatus for generation of pipeline hazard test sequences |
| US6751759B1 (en) * | 2000-11-03 | 2004-06-15 | Freescale Semiconductor, Inc. | Method and apparatus for pipeline hazard detection |
| US6801994B2 (en) * | 2000-12-20 | 2004-10-05 | Microsoft Corporation | Software management systems and methods for automotive computing devices |
| US7093108B2 (en) * | 2001-02-01 | 2006-08-15 | Arm Limited | Apparatus and method for efficiently incorporating instruction set information with instruction addresses |
| US7093236B2 (en) * | 2001-02-01 | 2006-08-15 | Arm Limited | Tracing out-of-order data |
| US20030004974A1 (en) * | 2001-06-28 | 2003-01-02 | Hong Wang | Configurable system monitoring for dynamic optimization of program execution |
| US6742179B2 (en) * | 2001-07-12 | 2004-05-25 | International Business Machines Corporation | Restructuring of executable computer code and large data sets |
| JP4143283B2 (en) * | 2001-09-12 | 2008-09-03 | 株式会社日立製作所 | Computer processing performance change device |
| US7159216B2 (en) * | 2001-11-07 | 2007-01-02 | International Business Machines Corporation | Method and apparatus for dispatching tasks in a non-uniform memory access (NUMA) computer system |
| US6918098B2 (en) * | 2002-07-16 | 2005-07-12 | Hewlett-Packard Development Company, L.P. | Random code generation using genetic algorithms |
| GB2393272A (en) * | 2002-09-19 | 2004-03-24 | Advanced Risc Mach Ltd | Controlling performance counters within a data processing system |
| US20040128446A1 (en) * | 2002-12-27 | 2004-07-01 | Carole Dulong | Value profiling with low overhead |
| US20090052608A1 (en) * | 2007-08-21 | 2009-02-26 | International Business Machines Corporation | Method for dynamically adjusting hardware event counting time-slice windows |
| US20040187108A1 (en) * | 2003-02-21 | 2004-09-23 | Knowles W. Jeffrey | Method of scheduling and event processing in computer operating system |
| US20040167854A1 (en) * | 2003-02-21 | 2004-08-26 | Knowles W. Jeffrey | System and method of currency conversion in financial transaction process |
| US20040167863A1 (en) * | 2003-02-21 | 2004-08-26 | Knowles W. Jeffrey | System and method of transferring data through transaction process |
| US8041633B2 (en) * | 2003-02-21 | 2011-10-18 | Mtrex, Inc. | System and method of electronic data transaction processing |
| US20040193395A1 (en) * | 2003-03-26 | 2004-09-30 | Dominic Paulraj | Program analyzer for a cycle accurate simulator |
| TWI227398B (en) * | 2003-04-15 | 2005-02-01 | Asustek Comp Inc | Automatic adjusting device of computer system performance |
| US20050027648A1 (en) * | 2003-07-29 | 2005-02-03 | Knowles W. Jeffrey | System and method of account reconciliation for electronic transactions |
| US6925928B2 (en) * | 2003-09-18 | 2005-08-09 | Anthony Fox | Trash compactor for fast food restaurant waste |
| US7308683B2 (en) * | 2003-10-30 | 2007-12-11 | International Business Machines Corporation | Ordering of high use program code segments using simulated annealing |
| US7421592B1 (en) * | 2004-02-13 | 2008-09-02 | Microsoft Corporation | High performance counter for realistic measurement of computer system load |
| US7735073B1 (en) * | 2004-02-28 | 2010-06-08 | Oracle International Corporation | Method and apparatus for data object profiling |
| US7389502B2 (en) * | 2004-03-31 | 2008-06-17 | Intel Corporation | Program phase detection for dynamic optimization |
| US7350046B2 (en) * | 2004-04-02 | 2008-03-25 | Seagate Technology Llc | Managed reliability storage system and method monitoring storage conditions |
| JP4599902B2 (en) * | 2004-06-18 | 2010-12-15 | 株式会社日立製作所 | Performance analysis method using hardware monitor |
| US20060005180A1 (en) * | 2004-06-30 | 2006-01-05 | Nefian Ara V | Method and system for hot path detection and dynamic optimization |
| US8640114B2 (en) | 2006-09-07 | 2014-01-28 | Oracle America, Inc. | Method and apparatus for specification and application of a user-specified filter in a data space profiler |
| US8990377B2 (en) * | 2004-12-06 | 2015-03-24 | International Business Machines Corporation | Method to effectively collect data from systems that consists of dynamic sub-systems |
| US7426684B2 (en) * | 2005-04-29 | 2008-09-16 | Hewlett-Packard Development Company, L.P. | Lost-cycle measurement using cycle counter |
| US7703079B1 (en) | 2005-05-03 | 2010-04-20 | Oracle America, Inc. | System performance prediction |
| US20070089094A1 (en) * | 2005-10-13 | 2007-04-19 | Levine Frank E | Temporal sample-based profiling |
| US8253748B1 (en) * | 2005-11-29 | 2012-08-28 | Nvidia Corporation | Shader performance registers |
| US7809928B1 (en) | 2005-11-29 | 2010-10-05 | Nvidia Corporation | Generating event signals for performance register control using non-operative instructions |
| JP4760491B2 (en) * | 2005-12-08 | 2011-08-31 | 株式会社日立製作所 | Event processing system, event processing method, event processing apparatus, and event processing program |
| US7596719B2 (en) * | 2006-02-14 | 2009-09-29 | Atmel Corporation | Microcontroller information extraction system and method |
| DE102006041444B4 (en) | 2006-09-04 | 2014-10-30 | Infineon Technologies Ag | Circuit arrangement and method for detecting an execution time of a command in a computer system |
| US8813055B2 (en) | 2006-11-08 | 2014-08-19 | Oracle America, Inc. | Method and apparatus for associating user-specified data with events in a data space profiler |
| JP4836811B2 (en) | 2007-01-26 | 2011-12-14 | 株式会社東芝 | Performance monitoring apparatus and information processing apparatus |
| US8762951B1 (en) * | 2007-03-21 | 2014-06-24 | Oracle America, Inc. | Apparatus and method for profiling system events in a fine grain multi-threaded multi-core processor |
| US8341612B2 (en) * | 2007-05-16 | 2012-12-25 | International Business Machines Corporation | Method and apparatus for run-time statistics dependent program execution using source-coding |
| JP2009129301A (en) * | 2007-11-27 | 2009-06-11 | Nec Electronics Corp | Self-diagnostic circuit and self-diagnostic method |
| US8296749B2 (en) * | 2007-12-28 | 2012-10-23 | Intel Corporation | Program translation and transactional memory formation |
| US7840677B2 (en) * | 2008-03-11 | 2010-11-23 | International Business Machines Corporation | Systems, methods and computer program products for improving placement performance of message transforms by exploiting guided replication |
| US7493610B1 (en) | 2008-03-27 | 2009-02-17 | International Business Machines Corporation | Versioning optimization for dynamically-typed languages |
| JP5217870B2 (en) | 2008-10-07 | 2013-06-19 | 富士通株式会社 | Program performance measuring apparatus, method, program, program recording medium |
| US8429665B2 (en) * | 2010-03-19 | 2013-04-23 | Vmware, Inc. | Cache performance prediction, partitioning and scheduling based on cache pressure of threads |
| US9880848B2 (en) * | 2010-06-11 | 2018-01-30 | Advanced Micro Devices, Inc. | Processor support for hardware transactional memory |
| US10129168B2 (en) * | 2014-06-17 | 2018-11-13 | Analitiqa Corporation | Methods and systems providing a scalable process for anomaly identification and information technology infrastructure resource optimization |
| US9710354B2 (en) | 2015-08-31 | 2017-07-18 | International Business Machines Corporation | Basic block profiling using grouping events |
| US11003428B2 (en) | 2016-05-25 | 2021-05-11 | Microsoft Technolgy Licensing, Llc. | Sample driven profile guided optimization with precise correlation |
| US11645075B1 (en) * | 2021-06-30 | 2023-05-09 | Amazon Technologies, Inc. | Program flow classification |
Family Cites Families (70)
| Publication number | Priority date | Publication date | Assignee | Title |
|---|---|---|---|---|
| US4084231A (en) | 1975-12-18 | 1978-04-11 | International Business Machines Corporation | System for facilitating the copying back of data in disc and tape units of a memory hierarchial system |
| US4481583A (en) | 1981-10-30 | 1984-11-06 | At&T Bell Laboratories | Method for distributing resources in a time-shared system |
| JPS6047623B2 (en) | 1982-02-12 | 1985-10-22 | 株式会社日立製作所 | Address translation method |
| US4583165A (en) | 1982-06-30 | 1986-04-15 | International Business Machines Corporation | Apparatus and method for controlling storage access in a multilevel storage system |
| US4800521A (en) | 1982-09-21 | 1989-01-24 | Xerox Corporation | Task control manager |
| US4590550A (en) | 1983-06-29 | 1986-05-20 | International Business Machines Corporation | Internally distributed monitoring system |
| US5103394A (en) | 1984-04-30 | 1992-04-07 | Hewlett-Packard Company | Software performance analyzer |
| US4845615A (en) | 1984-04-30 | 1989-07-04 | Hewlett-Packard Company | Software performance analyzer |
| US4972338A (en) | 1985-06-13 | 1990-11-20 | Intel Corporation | Memory management for microprocessor system |
| US4821178A (en) | 1986-08-15 | 1989-04-11 | International Business Machines Corporation | Internal performance monitoring by event sampling |
| US4965717A (en) | 1988-12-09 | 1990-10-23 | Tandem Computers Incorporated | Multiple processor system having shared memory with private-write capability |
| JPH02271435A (en) | 1989-04-13 | 1990-11-06 | Mitsubishi Electric Corp | Task tracing device |
| JPH03210649A (en) | 1990-01-12 | 1991-09-13 | Fujitsu Ltd | Microcomputer and its bus cycle control method |
| US5282274A (en) | 1990-05-24 | 1994-01-25 | International Business Machines Corporation | Translation of multiple virtual pages upon a TLB miss |
| US5301299A (en) | 1990-06-07 | 1994-04-05 | Intel Corporation | Optimized write protocol for memory accesses utilizing row and column strobes |
| US5151981A (en) | 1990-07-13 | 1992-09-29 | International Business Machines Corporation | Instruction sampling instrumentation |
| US5450609A (en) | 1990-11-13 | 1995-09-12 | Compaq Computer Corp. | Drive array performance monitor |
| US5339425A (en) | 1990-12-11 | 1994-08-16 | Fisher Controls International, Inc. | Operating system for a process controller |
| JPH0774984B2 (en) | 1991-06-10 | 1995-08-09 | インターナショナル・ビジネス・マシーンズ・コーポレイション | System resource utilization measurement method and data processing system |
| US5630157A (en) | 1991-06-13 | 1997-05-13 | International Business Machines Corporation | Computer organization for multiple and out-of-order execution of condition code testing and setting instructions |
| JPH079632B2 (en) | 1991-06-18 | 1995-02-01 | インターナショナル・ビジネス・マシーンズ・コーポレイション | Address translation device and method |
| US5450586A (en) | 1991-08-14 | 1995-09-12 | Hewlett-Packard Company | System for analyzing and debugging embedded software through dynamic and interactive use of code markers |
| US5269017A (en) | 1991-08-29 | 1993-12-07 | International Business Machines Corporation | Type 1, 2 and 3 retry and checkpointing |
| US5287508A (en) | 1992-04-07 | 1994-02-15 | Sun Microsystems, Inc. | Method and apparatus for efficient scheduling in a multiprocessor system |
| GB2266606B (en) | 1992-04-27 | 1996-02-14 | Intel Corp | A microprocessor with an external command mode |
| JP3544214B2 (en) | 1992-04-29 | 2004-07-21 | サン・マイクロシステムズ・インコーポレイテッド | Method and system for monitoring processor status |
| US5515538A (en) | 1992-05-29 | 1996-05-07 | Sun Microsystems, Inc. | Apparatus and method for interrupt handling in a multi-threaded operating system kernel |
| US5418973A (en) | 1992-06-22 | 1995-05-23 | Digital Equipment Corporation | Digital computer system with cache controller coordinating both vector and scalar operations |
| US5450349A (en) | 1992-10-27 | 1995-09-12 | Digital Equipment Corporation | Computer system performance evaluation system and method |
| US5452457A (en) | 1993-01-29 | 1995-09-19 | International Business Machines Corporation | Program construct and methods/systems for optimizing assembled code for execution |
| JPH06290079A (en) | 1993-03-30 | 1994-10-18 | Hitachi Ltd | Information processing system |
| US5594741A (en) | 1993-03-31 | 1997-01-14 | Digital Equipment Corporation | Method for control of random test vector generation |
| US5452440A (en) | 1993-07-16 | 1995-09-19 | Zitel Corporation | Method and structure for evaluating and enhancing the performance of cache memory systems |
| US5379432A (en) | 1993-07-19 | 1995-01-03 | Taligent, Inc. | Object-oriented interface for a procedural operating system |
| US5485574A (en) | 1993-11-04 | 1996-01-16 | Microsoft Corporation | Operating system based performance monitoring of programs |
| US5623627A (en) | 1993-12-09 | 1997-04-22 | Advanced Micro Devices, Inc. | Computer memory architecture including a replacement cache |
| US5922070A (en) | 1994-01-11 | 1999-07-13 | Texas Instruments Incorporated | Pipelined data processing including program counter recycling |
| US5603004A (en) | 1994-02-14 | 1997-02-11 | Hewlett-Packard Company | Method for decreasing time penalty resulting from a cache miss in a multi-level cache system |
| US5493673A (en) | 1994-03-24 | 1996-02-20 | International Business Machines Corporation | Method and apparatus for dynamically sampling digital counters to improve statistical accuracy |
| US5446876A (en) | 1994-04-15 | 1995-08-29 | International Business Machines Corporation | Hardware mechanism for instruction/data address tracing |
| US5581482A (en) | 1994-04-26 | 1996-12-03 | Unisys Corporation | Performance monitor for digital computer system |
| EP0689141A3 (en) * | 1994-06-20 | 1997-10-15 | At & T Corp | Interrupt-based hardware support for profiling system performance |
| US5528753A (en) | 1994-06-30 | 1996-06-18 | International Business Machines Corporation | System and method for enabling stripped object software monitoring in a computer system |
| US5537541A (en) | 1994-08-16 | 1996-07-16 | Digital Equipment Corporation | System independent interface for performance counters |
| JP3588485B2 (en) | 1994-08-26 | 2004-11-10 | 富士通株式会社 | Process scheduling method |
| JP2908739B2 (en) | 1994-12-16 | 1999-06-21 | インターナショナル・ビジネス・マシーンズ・コーポレイション | System and method for monitoring a CPU in a multiprocessor system |
| US5655115A (en) | 1995-02-14 | 1997-08-05 | Hal Computer Systems, Inc. | Processor structure and method for watchpoint of plural simultaneous unresolved branch evaluation |
| US5748468A (en) | 1995-05-04 | 1998-05-05 | Microsoft Corporation | Prioritized co-processor resource manager and method |
| US5608892A (en) | 1995-06-09 | 1997-03-04 | Alantec Corporation | Active cache for a microprocessor |
| DE69633568T2 (en) | 1995-07-26 | 2005-12-22 | Pioneer Hi-Bred International, Inc. | EXPRESSION CONTROL SEQUENCE FOR GENERAL AND EFFECTIVE GENE EXPRESSION IN PLANTS |
| JPH0997214A (en) | 1995-09-29 | 1997-04-08 | Internatl Business Mach Corp <Ibm> | Information-processing system inclusive of address conversion for auxiliary processor |
| US5691920A (en) | 1995-10-02 | 1997-11-25 | International Business Machines Corporation | Method and system for performance monitoring of dispatch unit efficiency in a processing system |
| US5751945A (en) | 1995-10-02 | 1998-05-12 | International Business Machines Corporation | Method and system for performance monitoring stalls to identify pipeline bottlenecks and stalls in a processing system |
| US5765204A (en) | 1996-06-05 | 1998-06-09 | International Business Machines Corporation | Method and apparatus for adaptive localization of frequently accessed, randomly addressed data |
| US5854934A (en) | 1996-08-23 | 1998-12-29 | Hewlett-Packard Company | Optimizing compiler having data cache prefetch spreading |
| US5799143A (en) | 1996-08-26 | 1998-08-25 | Motorola, Inc. | Multiple context software analysis |
| US5802593A (en) | 1996-09-06 | 1998-09-01 | Intel Corporation | Method and apparatus for improving disk drive performance |
| US5802386A (en) | 1996-11-19 | 1998-09-01 | International Business Machines Corporation | Latency-based scheduling of instructions in a superscalar processor |
| US5862371A (en) | 1996-11-25 | 1999-01-19 | International Business Machines Corporation | Method and system for instruction trace reconstruction utilizing performance monitor outputs and bus monitoring |
| US5878208A (en) | 1996-11-25 | 1999-03-02 | International Business Machines Corporation | Method and system for instruction trace reconstruction utilizing limited output pins and bus monitoring |
| US5884080A (en) | 1996-11-26 | 1999-03-16 | International Business Machines Corporation | System and method for instruction burst performance profiling for single-processor and multi-processor systems |
| US5857097A (en) | 1997-03-10 | 1999-01-05 | Digital Equipment Corporation | Method for identifying reasons for dynamic stall cycles during the execution of a program |
| US5944841A (en) | 1997-04-15 | 1999-08-31 | Advanced Micro Devices, Inc. | Microprocessor with built-in instruction tracing capability |
| US5933626A (en) | 1997-06-12 | 1999-08-03 | Advanced Micro Devices, Inc. | Apparatus and method for tracing microprocessor instructions |
| US5860018A (en) | 1997-06-25 | 1999-01-12 | Sun Microsystems, Inc. | Method for tracking pipeline resources in a superscalar processor |
| US5987598A (en) | 1997-07-07 | 1999-11-16 | International Business Machines Corporation | Method and system for tracking instruction progress within a data processing system |
| US6000044A (en) | 1997-11-26 | 1999-12-07 | Digital Equipment Corporation | Apparatus for randomly sampling instructions in a processor pipeline |
| US5923872A (en) | 1997-11-26 | 1999-07-13 | Digital Equipment Corporation | Apparatus for sampling instruction operand or result values in a processor pipeline |
| US5964867A (en) | 1997-11-26 | 1999-10-12 | Digital Equipment Corporation | Method for inserting memory prefetch operations based on measured latencies in a program optimizer |
| US5809450A (en) | 1997-11-26 | 1998-09-15 | Digital Equipment Corporation | Method for estimating statistics of properties of instructions processed by a processor pipeline |
-
1997
- 1997-11-26 US US08/980,124 patent/US6374367B1/en not_active Expired - Lifetime
-
1998
- 1998-11-25 DE DE69824688T patent/DE69824688T2/en not_active Expired - Fee Related
- 1998-11-25 EP EP98309634A patent/EP0919919B1/en not_active Expired - Lifetime
- 1998-11-26 JP JP10375365A patent/JPH11272519A/en active Pending
Cited By (24)
| Publication number | Priority date | Publication date | Assignee | Title |
|---|---|---|---|---|
| US9158660B2 (en) | 2012-03-16 | 2015-10-13 | International Business Machines Corporation | Controlling operation of a run-time instrumentation facility |
| US9250903B2 (en) | 2012-03-16 | 2016-02-02 | International Business Machinecs Corporation | Determining the status of run-time-instrumentation controls |
| US9250902B2 (en) | 2012-03-16 | 2016-02-02 | International Business Machines Corporation | Determining the status of run-time-instrumentation controls |
| US9280448B2 (en) | 2012-03-16 | 2016-03-08 | International Business Machines Corporation | Controlling operation of a run-time instrumentation facility from a lesser-privileged state |
| US9280346B2 (en) | 2012-03-16 | 2016-03-08 | International Business Machines Corporation | Run-time instrumentation reporting |
| US9280447B2 (en) | 2012-03-16 | 2016-03-08 | International Business Machines Corporation | Modifying run-time-instrumentation controls from a lesser-privileged state |
| US9367313B2 (en) | 2012-03-16 | 2016-06-14 | International Business Machines Corporation | Run-time instrumentation directed sampling |
| US9367316B2 (en) | 2012-03-16 | 2016-06-14 | International Business Machines Corporation | Run-time instrumentation indirect sampling by instruction operation code |
| US9372693B2 (en) | 2012-03-16 | 2016-06-21 | International Business Machines Corporation | Run-time instrumentation sampling in transactional-execution mode |
| US9395989B2 (en) | 2012-03-16 | 2016-07-19 | International Business Machines Corporation | Run-time-instrumentation controls emit instruction |
| US9400736B2 (en) | 2012-03-16 | 2016-07-26 | International Business Machines Corporation | Transformation of a program-event-recording event into a run-time instrumentation event |
| US9405541B2 (en) | 2012-03-16 | 2016-08-02 | International Business Machines Corporation | Run-time instrumentation indirect sampling by address |
| US9405543B2 (en) | 2012-03-16 | 2016-08-02 | International Business Machines Corporation | Run-time instrumentation indirect sampling by address |
| US9411591B2 (en) | 2012-03-16 | 2016-08-09 | International Business Machines Corporation | Run-time instrumentation sampling in transactional-execution mode |
| US9430238B2 (en) | 2012-03-16 | 2016-08-30 | International Business Machines Corporation | Run-time-instrumentation controls emit instruction |
| US9442824B2 (en) | 2012-03-16 | 2016-09-13 | International Business Machines Corporation | Transformation of a program-event-recording event into a run-time instrumentation event |
| US9442728B2 (en) | 2012-03-16 | 2016-09-13 | International Business Machines Corporation | Run-time instrumentation indirect sampling by instruction operation code |
| US9454462B2 (en) | 2012-03-16 | 2016-09-27 | International Business Machines Corporation | Run-time instrumentation monitoring for processor characteristic changes |
| US9459873B2 (en) | 2012-03-16 | 2016-10-04 | International Business Machines Corporation | Run-time instrumentation monitoring of processor characteristics |
| US9465716B2 (en) | 2012-03-16 | 2016-10-11 | International Business Machines Corporation | Run-time instrumentation directed sampling |
| US9471315B2 (en) | 2012-03-16 | 2016-10-18 | International Business Machines Corporation | Run-time instrumentation reporting |
| US9483268B2 (en) | 2012-03-16 | 2016-11-01 | International Business Machines Corporation | Hardware based run-time instrumentation facility for managed run-times |
| US9483269B2 (en) | 2012-03-16 | 2016-11-01 | International Business Machines Corporation | Hardware based run-time instrumentation facility for managed run-times |
| US9489285B2 (en) | 2012-03-16 | 2016-11-08 | International Business Machines Corporation | Modifying run-time-instrumentation controls from a lesser-privileged state |
Also Published As
| Publication number | Publication date |
|---|---|
| DE69824688D1 (en) | 2004-07-29 |
| EP0919919A2 (en) | 1999-06-02 |
| DE69824688T2 (en) | 2005-07-14 |
| EP0919919A3 (en) | 2000-02-23 |
| US6374367B1 (en) | 2002-04-16 |
| JPH11272519A (en) | 1999-10-08 |
Similar Documents
| Publication | Publication Date | Title |
|---|---|---|
| EP0919919B1 (en) | System and method for optimising the performance of a computer system | |
| EP0918288B1 (en) | Apparatus for spatial and temporal sampling in a computer memory system | |
| US6000044A (en) | Apparatus for randomly sampling instructions in a processor pipeline | |
| US6442585B1 (en) | Method for scheduling contexts based on statistics of memory system interactions in a computer system | |
| EP0919923B1 (en) | Method for estimating statistics of properties of memory system interactions among contexts in a computer system | |
| US6092180A (en) | Method for measuring latencies by randomly selected sampling of the instructions while the instruction are executed | |
| US5809450A (en) | Method for estimating statistics of properties of instructions processed by a processor pipeline | |
| US5923872A (en) | Apparatus for sampling instruction operand or result values in a processor pipeline | |
| US6070009A (en) | Method for estimating execution rates of program execution paths | |
| US6119075A (en) | Method for estimating statistics of properties of interactions processed by a processor pipeline | |
| US6549930B1 (en) | Method for scheduling threads in a multithreaded processor | |
| US6163840A (en) | Method and apparatus for sampling multiple potentially concurrent instructions in a processor pipeline | |
| US5964867A (en) | Method for inserting memory prefetch operations based on measured latencies in a program optimizer | |
| US6195748B1 (en) | Apparatus for sampling instruction execution information in a processor pipeline | |
| EP0919920B1 (en) | Method for estimating statistics of properties of memory system transactions | |
| US6237073B1 (en) | Method for providing virtual memory to physical memory page mapping in a computer operating system that randomly samples state information | |
| US5752062A (en) | Method and system for performance monitoring through monitoring an order of processor events during execution in a processing system | |
| US6112317A (en) | Processor performance counter for sampling the execution frequency of individual instructions | |
| US5797019A (en) | Method and system for performance monitoring time lengths of disabled interrupts in a processing system | |
| US6009514A (en) | Computer method and apparatus for analyzing program instructions executing in a computer system | |
| US5751945A (en) | Method and system for performance monitoring stalls to identify pipeline bottlenecks and stalls in a processing system | |
| US6148396A (en) | Apparatus for sampling path history in a processor pipeline | |
| US5949971A (en) | Method and system for performance monitoring through identification of frequency and length of time of execution of serialization instructions in a processing system | |
| US6175814B1 (en) | Apparatus for determining the instantaneous average number of instructions processed | |
| JPH0830494A (en) | Interrupt-based hardware support for profiling of system performance |
Legal Events
| Date | Code | Title | Description |
|---|---|---|---|
| PUAI | Public reference made under article 153(3) epc to a published international application that has entered the european phase |
Free format text: ORIGINAL CODE: 0009012 |
|
| AK | Designated contracting states |
Kind code of ref document: A2 Designated state(s): DE FR GB |
|
| AX | Request for extension of the european patent |
Free format text: AL;LT;LV;MK;RO;SI |
|
| PUAL | Search report despatched |
Free format text: ORIGINAL CODE: 0009013 |
|
| AK | Designated contracting states |
Kind code of ref document: A3 Designated state(s): AT BE CH CY DE DK ES FI FR GB GR IE IT LI LU MC NL PT SE |
|
| AX | Request for extension of the european patent |
Free format text: AL;LT;LV;MK;RO;SI |
|
| RAP1 | Party data changed (applicant data changed or rights of an application transferred) |
Owner name: COMPAQ COMPUTER CORPORATION |
|
| 17P | Request for examination filed |
Effective date: 20000811 |
|
| AKX | Designation fees paid |
Free format text: DE FR GB |
|
| 17Q | First examination report despatched |
Effective date: 20001115 |
|
| RTI1 | Title (correction) |
Free format text: SYSTEM AND METHOD FOR OPTIMISING THE PERFORMANCE OF A COMPUTER SYSTEM |
|
| RTI1 | Title (correction) |
Free format text: SYSTEM AND METHOD FOR OPTIMISING THE PERFORMANCE OF A COMPUTER SYSTEM |
|
| GRAP | Despatch of communication of intention to grant a patent |
Free format text: ORIGINAL CODE: EPIDOSNIGR1 |
|
| GRAS | Grant fee paid |
Free format text: ORIGINAL CODE: EPIDOSNIGR3 |
|
| GRAA | (expected) grant |
Free format text: ORIGINAL CODE: 0009210 |
|
| AK | Designated contracting states |
Kind code of ref document: B1 Designated state(s): DE FR GB |
|
| REG | Reference to a national code |
Ref country code: GB Ref legal event code: FG4D |
|
| REF | Corresponds to: |
Ref document number: 69824688 Country of ref document: DE Date of ref document: 20040729 Kind code of ref document: P |
|
| ET | Fr: translation filed | ||
| PLBE | No opposition filed within time limit |
Free format text: ORIGINAL CODE: 0009261 |
|
| STAA | Information on the status of an ep patent application or granted ep patent |
Free format text: STATUS: NO OPPOSITION FILED WITHIN TIME LIMIT |
|
| 26N | No opposition filed |
Effective date: 20050324 |
|
| PGFP | Annual fee paid to national office [announced via postgrant information from national office to epo] |
Ref country code: GB Payment date: 20070125 Year of fee payment: 9 |
|
| PGFP | Annual fee paid to national office [announced via postgrant information from national office to epo] |
Ref country code: DE Payment date: 20070228 Year of fee payment: 9 |
|
| PGFP | Annual fee paid to national office [announced via postgrant information from national office to epo] |
Ref country code: FR Payment date: 20070207 Year of fee payment: 9 |
|
| GBPC | Gb: european patent ceased through non-payment of renewal fee |
Effective date: 20071125 |
|
| PG25 | Lapsed in a contracting state [announced via postgrant information from national office to epo] |
Ref country code: DE Free format text: LAPSE BECAUSE OF NON-PAYMENT OF DUE FEES Effective date: 20080603 |
|
| REG | Reference to a national code |
Ref country code: FR Ref legal event code: ST Effective date: 20080930 |
|
| PG25 | Lapsed in a contracting state [announced via postgrant information from national office to epo] |
Ref country code: GB Free format text: LAPSE BECAUSE OF NON-PAYMENT OF DUE FEES Effective date: 20071125 |
|
| PG25 | Lapsed in a contracting state [announced via postgrant information from national office to epo] |
Ref country code: FR Free format text: LAPSE BECAUSE OF NON-PAYMENT OF DUE FEES Effective date: 20071130 |