EP0935210A2 - Computer aided visualisation of expression comparison - Google Patents
Computer aided visualisation of expression comparison Download PDFInfo
- Publication number
- EP0935210A2 EP0935210A2 EP99300900A EP99300900A EP0935210A2 EP 0935210 A2 EP0935210 A2 EP 0935210A2 EP 99300900 A EP99300900 A EP 99300900A EP 99300900 A EP99300900 A EP 99300900A EP 0935210 A2 EP0935210 A2 EP 0935210A2
- Authority
- EP
- European Patent Office
- Prior art keywords
- sample
- axis
- expression level
- probe
- expressed sequence
- Prior art date
- Legal status (The legal status is an assumption and is not a legal conclusion. Google has not performed a legal analysis and makes no representation as to the accuracy of the status listed.)
- Ceased
Links
Images


Classifications
-
- G—PHYSICS
- G16—INFORMATION AND COMMUNICATION TECHNOLOGY [ICT] SPECIALLY ADAPTED FOR SPECIFIC APPLICATION FIELDS
- G16B—BIOINFORMATICS, i.e. INFORMATION AND COMMUNICATION TECHNOLOGY [ICT] SPECIALLY ADAPTED FOR GENETIC OR PROTEIN-RELATED DATA PROCESSING IN COMPUTATIONAL MOLECULAR BIOLOGY
- G16B25/00—ICT specially adapted for hybridisation; ICT specially adapted for gene or protein expression
- G16B25/10—Gene or protein expression profiling; Expression-ratio estimation or normalisation
-
- G—PHYSICS
- G06—COMPUTING; CALCULATING OR COUNTING
- G06T—IMAGE DATA PROCESSING OR GENERATION, IN GENERAL
- G06T11/00—2D [Two Dimensional] image generation
- G06T11/20—Drawing from basic elements, e.g. lines or circles
- G06T11/206—Drawing of charts or graphs
-
- C—CHEMISTRY; METALLURGY
- C12—BIOCHEMISTRY; BEER; SPIRITS; WINE; VINEGAR; MICROBIOLOGY; ENZYMOLOGY; MUTATION OR GENETIC ENGINEERING
- C12N—MICROORGANISMS OR ENZYMES; COMPOSITIONS THEREOF; PROPAGATING, PRESERVING, OR MAINTAINING MICROORGANISMS; MUTATION OR GENETIC ENGINEERING; CULTURE MEDIA
- C12N15/00—Mutation or genetic engineering; DNA or RNA concerning genetic engineering, vectors, e.g. plasmids, or their isolation, preparation or purification; Use of hosts therefor
- C12N15/09—Recombinant DNA-technology
- C12N15/10—Processes for the isolation, preparation or purification of DNA or RNA
- C12N15/1034—Isolating an individual clone by screening libraries
- C12N15/1089—Design, preparation, screening or analysis of libraries using computer algorithms
-
- C—CHEMISTRY; METALLURGY
- C12—BIOCHEMISTRY; BEER; SPIRITS; WINE; VINEGAR; MICROBIOLOGY; ENZYMOLOGY; MUTATION OR GENETIC ENGINEERING
- C12Q—MEASURING OR TESTING PROCESSES INVOLVING ENZYMES, NUCLEIC ACIDS OR MICROORGANISMS; COMPOSITIONS OR TEST PAPERS THEREFOR; PROCESSES OF PREPARING SUCH COMPOSITIONS; CONDITION-RESPONSIVE CONTROL IN MICROBIOLOGICAL OR ENZYMOLOGICAL PROCESSES
- C12Q1/00—Measuring or testing processes involving enzymes, nucleic acids or microorganisms; Compositions therefor; Processes of preparing such compositions
- C12Q1/68—Measuring or testing processes involving enzymes, nucleic acids or microorganisms; Compositions therefor; Processes of preparing such compositions involving nucleic acids
-
- G—PHYSICS
- G16—INFORMATION AND COMMUNICATION TECHNOLOGY [ICT] SPECIALLY ADAPTED FOR SPECIFIC APPLICATION FIELDS
- G16B—BIOINFORMATICS, i.e. INFORMATION AND COMMUNICATION TECHNOLOGY [ICT] SPECIALLY ADAPTED FOR GENETIC OR PROTEIN-RELATED DATA PROCESSING IN COMPUTATIONAL MOLECULAR BIOLOGY
- G16B45/00—ICT specially adapted for bioinformatics-related data visualisation, e.g. displaying of maps or networks
-
- G—PHYSICS
- G16—INFORMATION AND COMMUNICATION TECHNOLOGY [ICT] SPECIALLY ADAPTED FOR SPECIFIC APPLICATION FIELDS
- G16B—BIOINFORMATICS, i.e. INFORMATION AND COMMUNICATION TECHNOLOGY [ICT] SPECIALLY ADAPTED FOR GENETIC OR PROTEIN-RELATED DATA PROCESSING IN COMPUTATIONAL MOLECULAR BIOLOGY
- G16B25/00—ICT specially adapted for hybridisation; ICT specially adapted for gene or protein expression
Definitions
- the present invention relates to the field of computer systems. More specifically, the present invention relates to computer systems for visualizing analysis results.
- an array of nucleic acid probes is fabricated at known locations on a substrate or chip.
- a fluorescently labeled nucleic acid is then brought into contact with the chip and a scanner generates an image file (which is processed into a cell file) indicating the locations where the labeled nucleic acids bound to the chip.
- image file which is processed into a cell file
- Such systems have been used to form, for example, arrays of DNA that may be used to study and detect mutations relevant to cystic fibrosis, the P53 gene (relevant to certain cancers), HIV, and other genetic characteristics.
- the present invention provides innovative systems and methods for visualizing information collected from analyzing samples.
- the samples may include nucleic acids, proteins, or other polymers.
- Gene expression level as determined from analysis of a nucleic acid sample is one possible analysis result that may be visualized.
- a computer system may display the expression levels of multiple genes simultaneously in a way that facilitates user identification of genes whose expression is significant to a characteristic such as disease or resistance to disease. Additionally, the computer system may facilitate display of further information about relevant genes once they are identified.
- a first aspect of the invention provides a computer-implemented method for presenting expression level information as collected from first and second samples.
- the method includes steps of: displaying a first axis corresponding to expression level in the first sample, and displaying a second axis substantially perpendicular to the first axis, the second axis corresponding to expression level in the second sample.
- the method further includes a step of: for a selected expressed sequence, displaying a mark at a position. The position is selected relative to the first axis in accordance with an expression level of the selected expressed sequence in the first sample and relative to the second axis in accordance with an expression level of the selected expressed sequence in the second sample.
- a particularly useful application is displaying many marks simultaneously for many selected genes to discover which ones of the selected genes may be relevant to the characteristic.
- a second aspect of the invention provides a computer-implemented method of presenting sample analysis information.
- the method includes steps of: displaying a first axis corresponding to a concentration of a compound in a first sample as determined by monitoring binding of the compound to a selected polymer having binding affinity to the compound, and displaying a second axis substantially perpendicular to the first axis.
- the second axis corresponds to a concentration of the compound in the second sample as determined by monitoring binding of the compound to the selected polymer.
- the method further preferably includes a step of displaying a mark at a position. The position is selected relative to the first axis in accordance with the concentration in the first sample and relative to the second axis in accordance with the concentration in the second sample.
- Fig. 1 illustrates an example of a computer system that may be used to execute software embodiments of the present invention.
- Fig. 2 shows a system block diagram of a typical computer system.
- Fig. 3 illustrates an overall system for forming and analyzing arrays of polymers including biological materials such as DNA or RNA.
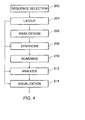
- Fig. 4 is an illustration of an embodiment of software for the overall system.
- Fig. 5 shows a flowchart of a process of monitoring the expression of a gene by comparing hybridization intensities of pairs of perfect match and mismatch probes.
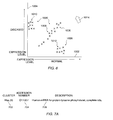
- Fig. 6 shows a screen display illustrating gene expression levels for multiple genes as collected from both normal and diseased tissue.
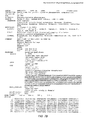
- Figs. 7A-7B show screen displays illustrating information about a particular gene selected from the display of Fig. 6.
- the present invention provides innovative methods of monitoring visualizing gene expression.
- the invention will be described in reference to preferred embodiments. However, the description is provided for purposes of illustration and not for limiting the spirit and scope of the invention.
- Fig. 1 illustrates an example of a computer system that may be used to execute software embodiments of the present invention.
- Fig. 1 shows a computer system 1 which includes a monitor 3, screen 5, cabinet 7, keyboard 9, and mouse 11.
- Mouse 11 may have one or more buttons such as mouse buttons 13.
- Cabinet 7 houses a CD-ROM drive 15 and a hard drive (not shown) that may be utilized to store and retrieve software programs including computer code incorporating the present invention.
- a CD-ROM 17 is shown as the computer readable medium, other computer readable media including floppy disks, DRAM, hard drives, flash memory, tape, and the like may be utilized.
- Cabinet 7 also houses familiar computer components (not shown) such as a processor, memory, and the like.
- Fig. 2 shows a system block diagram of computer system 1 used to execute software embodiments of the present invention.
- computer system 1 includes monitor 3 and keyboard 9.
- Computer system 1 further includes subsystems such as a central processor 50, system memory 52, I/O controller 54, display adapter 56, removable disk 58, fixed disk 60, network interface 62, and speaker 64.
- Removable disk 58 is representative of removable computer readable media like floppies, tape, CD-ROM, removable hard drive, flash memory, and the like.
- Fixed disk 60 is representative of an internal hard drive or the like.
- Other computer systems suitable for use with the present invention may include additional or fewer subsystems.
- another computer system could include more than one processor 50 (i.e., a multi-processor system) or memory cache.
- Arrows such as 66 represent the system bus architecture of computer system 1. However, these arrows are illustrative of any interconnection scheme serving to link the subsystems.
- display adapter 56 may be connected to central processor 50 through a local bus or the system may include a memory cache.
- Computer system 1 shown in Fig. 2 is but an example of a computer system suitable for use with the present invention. Other configurations of subsystems suitable for use with the present invention will be readily apparent to one of ordinary skill in the art. In one embodiment, the computer system is an IBM compatible personal computer.
- the VILSIPSTM and GeneChipTM technologies provide methods of making and using very large arrays of polymers, such as nucleic acids, on very small chips. See U.S. Patent No. 5,143,854 and PCT Patent Publication Nos. WO 90/15070 and 92/10092, each of which is hereby incorporated by reference for all purposes. Nucleic acid probes on the chip are used to detect complementary nucleic acid sequences in a sample nucleic acid of interest (the "target" nucleic acid).
- probes need not be nucleic acid probes but may also be other receptors, such as antibodies, or polymers such as peptides.
- Peptide probes may be used to detect the concentration of other peptides, proteins, or other compounds in a sample. The probes must be carefully selected to have bonding affinity to the compound whose concentration they are to be used to measure.
- the present invention provides methods of visualizing information relating to the concentration of compounds in a sample as measured by monitoring affinity of the compounds to probes.
- the concentration information is generated by analysis of hybridization intensity files for a chip containing hybridized nucleic acid probes.
- the hybridization of a nucleic acid sample to certain probes may represent the expression level of one more genes or expressed sequence tags (ESTs).
- ESTs expressed sequence tags
- Expression level information visualized by virtue of the present invention need not be obtained from probes but may originate from any source. If the expression information is collected from a probe array, the probe array need not meet any particular criteria for size and density. Furthermore, the present invention is not limited to visualizing fluorescent measurements of bondings such as hybridizations but may be readily utilized to visualize other measurements.
- a probe array may include peptide probes which may be exposed to protein samples, polypeptide samples, or other compounds which may or may not bond to the peptide probes. By appropriate selection of the peptide probes, one may detect the presence or absence of particular compounds which would bond to the peptide probes.
- the present invention is described as being part of a system that designs a chip mask, synthesizes the probes on the chip, labels nucleic acids from a target sample, and scans the hybridized probes.
- a system is set forth in U.S. Patent No. 5,571,639 which is hereby incorporated by reference for all purposes.
- the present invention may be used separately from the overall system for analyzing data generated by such systems, such as at remote locations, or for visualizing the results of other systems for generating expression information, or for visualizing concentrations of polymers other than nucleic acids.
- Fig. 3 illustrates a computerized system for forming and analyzing arrays of biological materials such as RNA or DNA.
- a computer 100 is used to design arrays of biological polymers such as RNA or DNA.
- the computer 100 may be, for example, an appropriately programmed IBM personal computer compatible running Windows NT including appropriate memory and a CPU as shown in Figs. 1 and 2.
- the computer system 100 obtains inputs from a user regarding characteristics of a gene of interest, and other inputs regarding the desired features of the array.
- the computer system may obtain information regarding a specific genetic sequence of interest from an external or internal database 102 such as GenBank.
- the output of the computer system 100 is a set of chip design computer files 104 in the form of, for example, a switch matrix, as described in PCT application WO 92/10092, and other associated computer files.
- the chip design files are provided to a system 106 that designs the lithographic masks used in the fabrication of arrays of molecules such as DNA.
- the system or process 106 may include the hardware necessary to manufacture masks 110 and also the necessary computer hardware and software 108 necessary to lay the mask patterns out on the mask in an efficient manner. As with the other features in Fig. 3, such equipment may or may not be located at the same physical site, but is shown together for ease of illustration in Fig. 3.
- the system 106 generates masks 110 or other synthesis patterns such as chrome-on-glass masks for use in the fabrication of polymer arrays.
- Synthesis system 112 includes the necessary hardware and software used to fabricate arrays of polymers on a substrate or chip 114.
- synthesizer 112 includes a light source 116 and a chemical flow cell 118 on which the substrate or chip 114 is placed.
- Mask 110 is placed between the light source and the substrate/chip, and the two are translated relative to each other at appropriate times for deprotection of selected regions of the chip.
- Selected chemical reagents are directed through flow cell 118 for coupling to deprotected regions, as well as for washing and other operations. All operations are preferably directed by an appropriately programmed computer 119, which may or may not be the same computer as the computer(s) used in mask design and mask making.
- the substrates fabricated by synthesis system 112 are optionally diced into smaller chips and exposed to marked targets.
- the targets may or may not be complementary to one or more of the molecules on the substrate.
- the targets are marked with a label such as a fluorescein label (indicated by an asterisk in Fig. 3) and placed in scanning system 120.
- Scanning system 120 again operates under the direction of an appropriately programmed digital computer 122, which also may or may not be the same computer as the computers used in synthesis, mask making, and mask design.
- the scanner 120 includes a detection device 124 such as a confocal microscope or CCD (charge-coupled device) that is used to detect the location where labeled target has bound to the substrate.
- a detection device 124 such as a confocal microscope or CCD (charge-coupled device) that is used to detect the location where labeled target has bound to the substrate.
- the output of scanner 120 is an image file(s) 124 indicating, in the case of fluorescein labeled target, the fluorescence intensity (photon counts or other related measurements, such as voltage) as a function of position on the substrate. Since higher photon counts will be observed where the labeled target has bound more strongly to the array of polymers, and since the monomer sequence of the polymers on the substrate is known as a function of position, it becomes possible to determine the sequence(s) of polymer(s) on the substrate that are complementary to the target.
- the image file 124 is provided as input to an analysis system 126 that incorporates the visualization and analysis methods of the present invention.
- the analysis system may be any one of a wide variety of computer system.
- the present invention provides various methods of analyzing and visualizing the chip design files and the image files, providing appropriate output 128.
- the chip design need not include any particular number of probes. It should be understood that the present invention does not require any particular source of expression level information.
- Fig. 4 provides a simplified illustration of the overall software system used in the operation of one embodiment of the invention.
- the system first identifies the nucleotide sequence(s) or targets that would be of interest in a particular expression level analysis at step 202.
- the sequences of interest correspond to mRNA transcripts of one or more genes, ESTs or nucleic acids derived from the mRNA transcripts. Sequence selection may be provided via manual input of text files or may be from external sources such as GenBank.
- the system evaluates the sequences of interest to determine or assist the user in determining which probes would be desirable on the chip, and provides an appropriate "layout" on the chip for the probes.
- the process of selecting probes for an expression level analysis is explained in PCT Publication No. WO 97/10365, the contents of which are herein incorporated by reference.
- An alternative probe selection process that does not require prior knowledge of sequences of interest is explained in PCT Publication No. WO97/27317 (Attorney Docket No. 18547-019410PC), the contents of which are herein incorporated by reference. Further general background on probe selection is found in PCT Publication No. WO95/11995 (Attorney Docket No.
- perfect match probe refers to a probe that has a sequence that is perfectly complementary to a particular target sequence.
- the test probe is typically perfectly complementary to a portion (subsequence) of the target sequence.
- mismatch control or mismatch probe” refer to probes whose sequence is deliberately selected not to be perfectly complementary to a particular target sequence. For each mismatch (MM) control in an array there typically exists a corresponding perfect match (PM) probe that is perfectly complementary to the same particular target sequence.
- the process compares hybridization intensities of pairs of perfect match and mismatch probes that are preferably covalently attached to the surface of a substrate or chip.
- the nucleic acid probes have a density greater than about 60 different nucleic acid probes per 1 cm 2 of the substrate.
- nucleic acid probes are selected that are complementary to the target sequence. These probes are the perfect match probes. Another set of probes is specified that are intended to be not perfectly complementary to the target sequence. These probes are the mismatch probes and each mismatch probe includes at least one nucleotide mismatch from a perfect match probe. Accordingly, a mismatch probe and the perfect match probe to which it is identical except for one base make up a pair. As mentioned earlier, the nucleotide mismatch is preferably near the center of the mismatch probe.
- the probe lengths of the perfect match probes are typically chosen to exhibit detectably greater hybridization with the target sequence relative to the mismatch probes.
- the nucleic acid probes may be all 20-mers.
- probes of varying lengths may also be synthesized on the substrate for any number of reasons including resolving ambiguities.
- the masks for the synthesis are designed.
- the software utilizes the mask design and layout information to make the DNA or other polymer chips. This step 208 will control, among other things, relative translation of a substrate and the mask, the flow of desired reagents through a flow cell, the synthesis temperature of the flow cell, and other parameters.
- another piece of software is used in scanning a chip thus synthesized and exposed to a labeled target. The software controls the scanning of the chip, and stores the data thus obtained in a file that may later be utilized to extract hybridization information.
- a computer system utilizes the layout information and the fluorescence information to evaluate the hybridized nucleic acid probes on the chip.
- the important pieces of information obtained from DNA chips are the relative fluorescent intensities obtained from the perfect match probes and mismatch probes. These intensity levels are used to estimate an expression level for a gene or EST.
- the computer system used for analysis will preferably have available other details of the experiment including possibly the gene name, gene sequence, probe sequences, probe locations bn the substrate, and the like.
- the same computer system used for analysis or another one displays the expression level information in a format useful for identifying genes of interest.
- the visualized expression level information may include information collected from multiple applications of one or more previous steps of Fig. 4.
- Fig. 5 is a flowchart describing steps of estimating an expression level for a particular gene and determining whether the expression level is sufficiently high to be displayed.
- the computer system receives raw scan data of N pairs of perfect match and mismatch probes.
- the hybridization intensities are photon counts from a fluorescein labeled target that has hybridized to the probes on the substrate.
- the hybridization intensity of a perfect match probe will be designed "I pm " and the hybridization intensity of a mismatch probe will be designed "I mm .”
- Hybridization intensities for a pair of probes are retrieved at step 954.
- the background signal intensity is subtracted from each of the hybridization intensities of the pair at step 956. Background subtraction can also be performed on all the raw scan data at the same time.
- the hybridization intensities of the pair of probes are compared to a difference threshold (D) and a ratio threshold (R). It is determined if the difference between the hybridization intensities of the pair (I pm - I mm ) is greater than or equal to the difference threshold AND the quotient of the hybridization intensities of the pair (I pm / I mm ) is greater than or equal to the ratio threshold.
- the difference thresholds are typically user defined values that have been determined to produce accurate expression monitoring of a gene or genes. In one embodiment, the difference threshold is 20 and the ratio threshold is 1.2.
- NPOS is a value that indicates the number of pairs of probes which have hybridization intensities indicating that the gene is likely expressed. NPOS is utilized in a determination of the expression of the gene.
- NNEG is a value that indicates the number of pairs of probes which have hybridization intensities indicating that the gene is likely not expressed.
- NNEG like NPOS, is utilized in a determination of the expression of the gene.
- LR log ratio value
- IDIF intensity difference value
- a decision matrix is utilized to indicate if the gene is expressed.
- the decision matrix utilizes the values N, NPOS, NNEG, LR (multiple LRs), and IDIF (multiple IDIFs).
- P1 NPOS / NNEG
- P2 NPOS / N
- SUM(LR) / N P4 SUM(IDIF)/N
- an average of the IDIF values for the probes that incremented NPOS or NNEG is calculated at step 975, which is utilized as an expression level.
- other values including one of P1 through P4 could be used to indicate expression level.
- Fig. 5 was described in reference to a single gene or EST.
- the visualization system of the present invention displays expression results for many genes to facilitate discovery of genes of interest or ESTs.
- the present invention contemplates display of expression levels of a single gene or ESTs' as collected from two or more different samples such as tissue samples.
- the sample sources preferably differ in some characteristic. It will be understood that when the term "sample” is used herein, measurements made on a single “sample” can be based on an aggregation of multiple sample collection events or even multiple organisms.
- Fig. 6 shows a screen display illustrating gene expression levels for multiple genes as collected from two tissue samples.
- a displayed horizontal axis 1002 represents expression level measured in one or more nucleic acid samples taken from the first tissue sample.
- a displayed vertical axis 1004 represents expression level in one or more nucleic acid samples taken from the second tissue sample.
- Each of marks 1006 represent a particular gene whose expression level has been measured in both the first and second tissue samples. Each mark 1006 is placed at a distance from vertical axis 1004 corresponding to expression level in the first tissue sample and at a distance from the horizontal axis 1002 corresponding to expression level in the second tissue sample.
- the expression levels used for determining the position of marks 1006 are preferably taken from the result of step 975.
- the position of each of marks 1006 depends on two iterations of the steps of Fig. 5, once for the sample taken from the first tissue sample and once for the sample taken from the second tissue sample. However, a mark is preferably displayed only if one of the samples meets the threshold criteria at step 972.
- the first tissue sample is a cancerous tissue sample and the second tissue sample is a normal tissue sample.
- the individual marks represent the expression levels of selected genes in both cancerous and normal tissue.
- a first group of marks 1008 represent genes that are neither tumor suppressors nor oncogenes since their expression levels are roughly similar for both normal and cancerous tissue. These marks 1008 fall roughly along a line which is rotated 45 degrees from each of the axes.
- a second group of marks 1010 represent genes that are likely oncogenes since their expression levels are found to be significantly higher in cancerous tissue than in normal tissue.
- a third group of marks 1012 represent genes that are likely tumor suppressors since their expression levels are found to be significantly higher in normal tissue than in cancerous tissue. It will be appreciated that expression levels for large numbers of genes can be reviewed at once to discover the oncogenes and tumor suppressors.
- the present invention would aid in the discovery of genes whose expression is associated with any characteristic that varies among tissue samples. For example, once can compare expression results from tissue from individuals who have been exposed to HIV but remain infected to tissue obtained from infected individuals to identify genes conferring resistance to HIV. One can compare expression results between tissue from plants that survive drought to plants that do not. One can compare expression levels among tissue samples at successive stages or severity levels of the same disease, among tissue samples where different ultimate outcomes of the disease (e.g., patient death or remission) are known, among diseased tissue samples that have been subject to different treatment regimes including e.g, chemotherapy, antisense RNA, etc. For cancers, one can compare expression levels between malignant cells and non-malignant cells. Also expression levels can be compared among different organs, between species, and among different stages of development of an organ.
- a third visual dimension can be used to illustrate expression level from a third tissue sample.
- the time dimension can also be used to illustrate successive groups of two or three tissue samples at successive time periods.
- the time dimension can be also used to correspond to tissue samples obtained at, e.g, successive stages of a disease.
- senses can also be incorporated within the presentation system of the present invention.
- the senses may correspond to additional dimensions.
- marks can be displayed in succession accompanies by a sound having characteristics corresponding to expression level in another tissue sample.
- the user can employ a cursor 1014 to identify a particular mark as being of interest.
- Cursor 1014 can be moved to a particular mark by use of, e.g., mouse 11.
- the mark can be selected by, e.g., depression of one of mouse buttons 13. Selection of a particular mark can be facilitated by use of a zoom display feature (not shown).
- a special mouse can transmit a tactile sensation back to the user corresponding to expression level in a tissue sample as the user passes the mouse over a corresponding mark.
- Fig. 6 is not limited to expression information.
- the two dimensions of Fig. 6 may correspond to indicators of the presence of various polymers other than nucleic acids in two different samples.
- each mark may correspond to a different polymer, polypeptide, or other compound.
- the distance of the mark from each axis would correspond to a measure of presence of the particular polymer in the sample corresponding to the axis.
- One possible measure is produced by fluorescently tagging polymer samples such as protein samples and exposing a probe array such as a peptide probe array to the protein samples.
- the fluorescent intensity of the probes will then correspond to the bonding affinity of the sample to the probes.
- the intensity measurement or a measurement derived from the intensity measurement may then be used to position the marks of Fig. 6.
- Fig. 7A shows a screen display giving information about a particular gene selected from the display of Fig. 6.
- a cluster number 702, a GenBank accession number 704, and a verbal description 706 for the selected gene are displayed.
- the user can also select a number of marks 1006 by circling them with cursor 1014. Then a list of information as shown in Fig. 7A is displayed for all the genes corresponding to the selected marks.
- GenBank accession number 704 By selecting GenBank accession number 704 with another cursor (not shown), the user can direct retrieval of the GenBank information for the selected gene. If the GenBank information is not available locally, the retrieval process can include formulating a query and transmitting the query to a GenBank web site. Once the GenBank information is retrieved, it can also be displayed. Fig. 7B depicts the GenBank information for the gene identified in Fig. 7A.
Abstract
Description
- The present invention relates to the field of computer systems. More specifically, the present invention relates to computer systems for visualizing analysis results.
- Devices and computer systems for forming and using arrays of materials on a substrate are known. For example, PCT Publication No. WO 92/10588, incorporated herein by reference for all purposes, describes techniques for sequencing or sequence checking nucleic acids and other materials. Arrays for performing these operations may be formed according to the methods of, for example, the pioneering techniques disclosed in U.S. Patent No. 5,143,854 and U.S. Patent No. 5,593,839 both incorporated herein by reference for all purposes.
- According to one aspect of the techniques described therein, an array of nucleic acid probes is fabricated at known locations on a substrate or chip. A fluorescently labeled nucleic acid is then brought into contact with the chip and a scanner generates an image file (which is processed into a cell file) indicating the locations where the labeled nucleic acids bound to the chip. Based upon the cell file and identities of the probes at specific locations, it becomes possible to extract information such as the monomer sequence of DNA or RNA. Such systems have been used to form, for example, arrays of DNA that may be used to study and detect mutations relevant to cystic fibrosis, the P53 gene (relevant to certain cancers), HIV, and other genetic characteristics.
- Computer-aided techniques for monitoring gene expression using such arrays of probes have also been developed as disclosed in U.S. Patent Application No. 08/828,952 (Attorney Docket No. 16528X-028900US) and PCT Publication No. WO 97/10365 (Attorney Docket No. 16528X-017110PC), the contents of which are herein incorporated by reference. Many disease states are characterized by differences in the expression levels of various genes either through changes in the copy number of the genetic DNA or through changes in levels of transcription (e.g., through control of initiation, provision of RNA precursors, RNA processing, etc.) of particular genes. For example, losses and gains of genetic material play an important role in malignant transformation and progression. Furthermore, changes in the expression (transcription) levels of particular genes (e.g., oncogenes or tumor suppressors), serve as signposts for the presence and progression of various cancers.
- It is desirable to identify genes having expression levels relevant to diagnosis of a diseased state by analyzing the expression levels of large numbers of genes in both diseased and normal individuals. Methods for collecting the expression level information have been developed. However, the user interfaces for gene expression monitoring systems that have been developed until now are designed to clearly present the expression of particular pre-selected genes. A user seeking to identify, e.g., an oncogene or a tumor suppressor gene, must individually review the expression level of large numbers of genes and compare the expression levels between diseased and normal individuals. What is needed is a user interface that takes advantage of collected gene expression information to help the user to identify particular genes of interest.
- The present invention provides innovative systems and methods for visualizing information collected from analyzing samples. The samples may include nucleic acids, proteins, or other polymers. Gene expression level as determined from analysis of a nucleic acid sample is one possible analysis result that may be visualized. In one embodiment, a computer system may display the expression levels of multiple genes simultaneously in a way that facilitates user identification of genes whose expression is significant to a characteristic such as disease or resistance to disease. Additionally, the computer system may facilitate display of further information about relevant genes once they are identified.
- A first aspect of the invention provides a computer-implemented method for presenting expression level information as collected from first and second samples. The method includes steps of: displaying a first axis corresponding to expression level in the first sample, and displaying a second axis substantially perpendicular to the first axis, the second axis corresponding to expression level in the second sample. The method further includes a step of: for a selected expressed sequence, displaying a mark at a position. The position is selected relative to the first axis in accordance with an expression level of the selected expressed sequence in the first sample and relative to the second axis in accordance with an expression level of the selected expressed sequence in the second sample. A particularly useful application is displaying many marks simultaneously for many selected genes to discover which ones of the selected genes may be relevant to the characteristic.
- A second aspect of the invention provides a computer-implemented method of presenting sample analysis information. The method includes steps of: displaying a first axis corresponding to a concentration of a compound in a first sample as determined by monitoring binding of the compound to a selected polymer having binding affinity to the compound, and displaying a second axis substantially perpendicular to the first axis. The second axis corresponds to a concentration of the compound in the second sample as determined by monitoring binding of the compound to the selected polymer. The method further preferably includes a step of displaying a mark at a position. The position is selected relative to the first axis in accordance with the concentration in the first sample and relative to the second axis in accordance with the concentration in the second sample.
- A further understanding of the nature and advantages of the inventions herein may be realized by reference to the remaining portions of the specification and the attached drawings.
- Fig. 1 illustrates an example of a computer system that may be used to execute software embodiments of the present invention.
- Fig. 2 shows a system block diagram of a typical computer system.
- Fig. 3 illustrates an overall system for forming and analyzing arrays of polymers including biological materials such as DNA or RNA.
- Fig. 4 is an illustration of an embodiment of software for the overall system.
- Fig. 5 shows a flowchart of a process of monitoring the expression of a gene by comparing hybridization intensities of pairs of perfect match and mismatch probes.
- Fig. 6 shows a screen display illustrating gene expression levels for multiple genes as collected from both normal and diseased tissue.
- Figs. 7A-7B show screen displays illustrating information about a particular gene selected from the display of Fig. 6.
- The present invention provides innovative methods of monitoring visualizing gene expression. In the description that follows, the invention will be described in reference to preferred embodiments. However, the description is provided for purposes of illustration and not for limiting the spirit and scope of the invention.
- Fig. 1 illustrates an example of a computer system that may be used to execute software embodiments of the present invention. Fig. 1 shows a
computer system 1 which includes amonitor 3,screen 5,cabinet 7,keyboard 9, andmouse 11.Mouse 11 may have one or more buttons such asmouse buttons 13.Cabinet 7 houses a CD-ROM drive 15 and a hard drive (not shown) that may be utilized to store and retrieve software programs including computer code incorporating the present invention. Although a CD-ROM 17 is shown as the computer readable medium, other computer readable media including floppy disks, DRAM, hard drives, flash memory, tape, and the like may be utilized.Cabinet 7 also houses familiar computer components (not shown) such as a processor, memory, and the like. - Fig. 2 shows a system block diagram of
computer system 1 used to execute software embodiments of the present invention. As in Fig. 1,computer system 1 includesmonitor 3 andkeyboard 9.Computer system 1 further includes subsystems such as acentral processor 50,system memory 52, I/O controller 54,display adapter 56,removable disk 58,fixed disk 60,network interface 62, andspeaker 64.Removable disk 58 is representative of removable computer readable media like floppies, tape, CD-ROM, removable hard drive, flash memory, and the like. Fixeddisk 60 is representative of an internal hard drive or the like. Other computer systems suitable for use with the present invention may include additional or fewer subsystems. For example, another computer system could include more than one processor 50 (i.e., a multi-processor system) or memory cache. - Arrows such as 66 represent the system bus architecture of
computer system 1. However, these arrows are illustrative of any interconnection scheme serving to link the subsystems. For example,display adapter 56 may be connected tocentral processor 50 through a local bus or the system may include a memory cache.Computer system 1 shown in Fig. 2 is but an example of a computer system suitable for use with the present invention. Other configurations of subsystems suitable for use with the present invention will be readily apparent to one of ordinary skill in the art. In one embodiment, the computer system is an IBM compatible personal computer. - The VILSIPS™ and GeneChip™ technologies provide methods of making and using very large arrays of polymers, such as nucleic acids, on very small chips. See U.S. Patent No. 5,143,854 and PCT Patent Publication Nos. WO 90/15070 and 92/10092, each of which is hereby incorporated by reference for all purposes. Nucleic acid probes on the chip are used to detect complementary nucleic acid sequences in a sample nucleic acid of interest (the "target" nucleic acid).
- It should be understood that the probes need not be nucleic acid probes but may also be other receptors, such as antibodies, or polymers such as peptides. Peptide probes may be used to detect the concentration of other peptides, proteins, or other compounds in a sample. The probes must be carefully selected to have bonding affinity to the compound whose concentration they are to be used to measure.
- In one embodiment, the present invention provides methods of visualizing information relating to the concentration of compounds in a sample as measured by monitoring affinity of the compounds to probes. In a particular application, the concentration information is generated by analysis of hybridization intensity files for a chip containing hybridized nucleic acid probes. The hybridization of a nucleic acid sample to certain probes may represent the expression level of one more genes or expressed sequence tags (ESTs). The expression level of a gene or EST is herein understood to be the concentration within a sample of mRNA or protein that would result from the transcription of the gene or EST.
- Expression level information visualized by virtue of the present invention need not be obtained from probes but may originate from any source. If the expression information is collected from a probe array, the probe array need not meet any particular criteria for size and density. Furthermore, the present invention is not limited to visualizing fluorescent measurements of bondings such as hybridizations but may be readily utilized to visualize other measurements.
- Concentration of compounds other than nucleic acids may be visualized according to one embodiment of the present invention. For example, a probe array may include peptide probes which may be exposed to protein samples, polypeptide samples, or other compounds which may or may not bond to the peptide probes. By appropriate selection of the peptide probes, one may detect the presence or absence of particular compounds which would bond to the peptide probes.
- For purposes of illustration, the present invention is described as being part of a system that designs a chip mask, synthesizes the probes on the chip, labels nucleic acids from a target sample, and scans the hybridized probes. Such a system is set forth in U.S. Patent No. 5,571,639 which is hereby incorporated by reference for all purposes. However, the present invention may be used separately from the overall system for analyzing data generated by such systems, such as at remote locations, or for visualizing the results of other systems for generating expression information, or for visualizing concentrations of polymers other than nucleic acids.
- Fig. 3 illustrates a computerized system for forming and analyzing arrays of biological materials such as RNA or DNA. A
computer 100 is used to design arrays of biological polymers such as RNA or DNA. Thecomputer 100 may be, for example, an appropriately programmed IBM personal computer compatible running Windows NT including appropriate memory and a CPU as shown in Figs. 1 and 2. Thecomputer system 100 obtains inputs from a user regarding characteristics of a gene of interest, and other inputs regarding the desired features of the array. Optionally, the computer system may obtain information regarding a specific genetic sequence of interest from an external orinternal database 102 such as GenBank. The output of thecomputer system 100 is a set of chip design computer files 104 in the form of, for example, a switch matrix, as described in PCT application WO 92/10092, and other associated computer files. - The chip design files are provided to a
system 106 that designs the lithographic masks used in the fabrication of arrays of molecules such as DNA. The system orprocess 106 may include the hardware necessary to manufacturemasks 110 and also the necessary computer hardware andsoftware 108 necessary to lay the mask patterns out on the mask in an efficient manner. As with the other features in Fig. 3, such equipment may or may not be located at the same physical site, but is shown together for ease of illustration in Fig. 3. Thesystem 106 generatesmasks 110 or other synthesis patterns such as chrome-on-glass masks for use in the fabrication of polymer arrays. - The
masks 110, as well as selected information relating to the design of the chips fromsystem 100, are used in asynthesis system 112.Synthesis system 112 includes the necessary hardware and software used to fabricate arrays of polymers on a substrate orchip 114. For example,synthesizer 112 includes alight source 116 and achemical flow cell 118 on which the substrate orchip 114 is placed.Mask 110 is placed between the light source and the substrate/chip, and the two are translated relative to each other at appropriate times for deprotection of selected regions of the chip. Selected chemical reagents are directed throughflow cell 118 for coupling to deprotected regions, as well as for washing and other operations. All operations are preferably directed by an appropriately programmedcomputer 119, which may or may not be the same computer as the computer(s) used in mask design and mask making. - The substrates fabricated by
synthesis system 112 are optionally diced into smaller chips and exposed to marked targets. The targets may or may not be complementary to one or more of the molecules on the substrate. The targets are marked with a label such as a fluorescein label (indicated by an asterisk in Fig. 3) and placed inscanning system 120.Scanning system 120 again operates under the direction of an appropriately programmeddigital computer 122, which also may or may not be the same computer as the computers used in synthesis, mask making, and mask design. Thescanner 120 includes adetection device 124 such as a confocal microscope or CCD (charge-coupled device) that is used to detect the location where labeled target has bound to the substrate. The output ofscanner 120 is an image file(s) 124 indicating, in the case of fluorescein labeled target, the fluorescence intensity (photon counts or other related measurements, such as voltage) as a function of position on the substrate. Since higher photon counts will be observed where the labeled target has bound more strongly to the array of polymers, and since the monomer sequence of the polymers on the substrate is known as a function of position, it becomes possible to determine the sequence(s) of polymer(s) on the substrate that are complementary to the target. - The
image file 124 is provided as input to ananalysis system 126 that incorporates the visualization and analysis methods of the present invention. Again, the analysis system may be any one of a wide variety of computer system. The present invention provides various methods of analyzing and visualizing the chip design files and the image files, providingappropriate output 128. The chip design need not include any particular number of probes. It should be understood that the present invention does not require any particular source of expression level information. - Fig. 4 provides a simplified illustration of the overall software system used in the operation of one embodiment of the invention. As shown in Fig. 4, the system first identifies the nucleotide sequence(s) or targets that would be of interest in a particular expression level analysis at
step 202. The sequences of interest correspond to mRNA transcripts of one or more genes, ESTs or nucleic acids derived from the mRNA transcripts. Sequence selection may be provided via manual input of text files or may be from external sources such as GenBank. - At
step 204 the system evaluates the sequences of interest to determine or assist the user in determining which probes would be desirable on the chip, and provides an appropriate "layout" on the chip for the probes. The process of selecting probes for an expression level analysis is explained in PCT Publication No. WO 97/10365, the contents of which are herein incorporated by reference. An alternative probe selection process that does not require prior knowledge of sequences of interest is explained in PCT Publication No. WO97/27317 (Attorney Docket No. 18547-019410PC), the contents of which are herein incorporated by reference. Further general background on probe selection is found in PCT Publication No. WO95/11995 (Attorney Docket No. 18547-004111PC) and PCT Publication No. WO97/29212 (Attorney Docket No. 18547-018540PC), the contents of which are herein incorporated by reference. The term "perfect match probe" refers to a probe that has a sequence that is perfectly complementary to a particular target sequence. The test probe is typically perfectly complementary to a portion (subsequence) of the target sequence. The term "mismatch control" or "mismatch probe" refer to probes whose sequence is deliberately selected not to be perfectly complementary to a particular target sequence. For each mismatch (MM) control in an array there typically exists a corresponding perfect match (PM) probe that is perfectly complementary to the same particular target sequence. - The process compares hybridization intensities of pairs of perfect match and mismatch probes that are preferably covalently attached to the surface of a substrate or chip. Most preferably, the nucleic acid probes have a density greater than about 60 different nucleic acid probes per 1 cm2 of the substrate.
- Initially, nucleic acid probes are selected that are complementary to the target sequence. These probes are the perfect match probes. Another set of probes is specified that are intended to be not perfectly complementary to the target sequence. These probes are the mismatch probes and each mismatch probe includes at least one nucleotide mismatch from a perfect match probe. Accordingly, a mismatch probe and the perfect match probe to which it is identical except for one base make up a pair. As mentioned earlier, the nucleotide mismatch is preferably near the center of the mismatch probe.
- The probe lengths of the perfect match probes are typically chosen to exhibit detectably greater hybridization with the target sequence relative to the mismatch probes. For example, the nucleic acid probes may be all 20-mers. However, probes of varying lengths may also be synthesized on the substrate for any number of reasons including resolving ambiguities.
- Again referring to Fig. 4, at
step 206 the masks for the synthesis are designed. Atstep 208 the software utilizes the mask design and layout information to make the DNA or other polymer chips. Thisstep 208 will control, among other things, relative translation of a substrate and the mask, the flow of desired reagents through a flow cell, the synthesis temperature of the flow cell, and other parameters. Atstep 210, another piece of software is used in scanning a chip thus synthesized and exposed to a labeled target. The software controls the scanning of the chip, and stores the data thus obtained in a file that may later be utilized to extract hybridization information. - At step 212 a computer system utilizes the layout information and the fluorescence information to evaluate the hybridized nucleic acid probes on the chip. Among the important pieces of information obtained from DNA chips are the relative fluorescent intensities obtained from the perfect match probes and mismatch probes. These intensity levels are used to estimate an expression level for a gene or EST. The computer system used for analysis will preferably have available other details of the experiment including possibly the gene name, gene sequence, probe sequences, probe locations bn the substrate, and the like.
- According to the present invention, at
step 214, the same computer system used for analysis or another one displays the expression level information in a format useful for identifying genes of interest. The visualized expression level information may include information collected from multiple applications of one or more previous steps of Fig. 4. - Fig. 5 is a flowchart describing steps of estimating an expression level for a particular gene and determining whether the expression level is sufficiently high to be displayed. At
step 952, the computer system receives raw scan data of N pairs of perfect match and mismatch probes. In a preferred embodiment, the hybridization intensities are photon counts from a fluorescein labeled target that has hybridized to the probes on the substrate. For simplicity, the hybridization intensity of a perfect match probe will be designed "Ipm" and the hybridization intensity of a mismatch probe will be designed "Imm." - Hybridization intensities for a pair of probes are retrieved at
step 954. The background signal intensity is subtracted from each of the hybridization intensities of the pair atstep 956. Background subtraction can also be performed on all the raw scan data at the same time. - At
step 958, the hybridization intensities of the pair of probes are compared to a difference threshold (D) and a ratio threshold (R). It is determined if the difference between the hybridization intensities of the pair (Ipm - Imm) is greater than or equal to the difference threshold AND the quotient of the hybridization intensities of the pair (Ipm / Imm) is greater than or equal to the ratio threshold. The difference thresholds are typically user defined values that have been determined to produce accurate expression monitoring of a gene or genes. In one embodiment, the difference threshold is 20 and the ratio threshold is 1.2. - If Ipm - Imm > = D and Ipm / Imm > = R, the value NPOS is incremented at
step 960. In general, NPOS is a value that indicates the number of pairs of probes which have hybridization intensities indicating that the gene is likely expressed. NPOS is utilized in a determination of the expression of the gene. - At
step 962, it is determined if Imm - Ipm > = D and Imm / Ipm > = R. If these expressions are true, the value NNEG is incremented atstep 964. In general, NNEG is a value that indicates the number of pairs of probes which have hybridization intensities indicating that the gene is likely not expressed. NNEG, like NPOS, is utilized in a determination of the expression of the gene. - For each pair that exhibits hybridization intensities either indicating the gene is expressed or not expressed, a log ratio value (LR) and intensity difference value (IDIF) are calculated at
step 966. LR is calculated by the log of the quotient of the hybridization intensities of the pair (Ipm / Imm). The IDIF is calculated by the difference between the hybridization intensities of the pair (Ipm - Imm). If there is a next pair of hybridization intensities atstep 968, they are retrieved atstep 954. - At
step 972, a decision matrix is utilized to indicate if the gene is expressed. The decision matrix utilizes the values N, NPOS, NNEG, LR (multiple LRs), and IDIF (multiple IDIFs). The following four assignments are performed:
P1 > 2.2
P2 > 0.3
P3 > 0.8
P4 > 30 - Once all the pairs of probes have been processed and the expression of the gene indicated, an average of the IDIF values for the probes that incremented NPOS or NNEG is calculated at
step 975, which is utilized as an expression level. Of course, other values including one of P1 through P4 could be used to indicate expression level. - For simplicity, Fig. 5 was described in reference to a single gene or EST. However, the visualization system of the present invention displays expression results for many genes to facilitate discovery of genes of interest or ESTs. Furthermore, the present invention contemplates display of expression levels of a single gene or ESTs' as collected from two or more different samples such as tissue samples. The sample sources preferably differ in some characteristic. It will be understood that when the term "sample" is used herein, measurements made on a single "sample" can be based on an aggregation of multiple sample collection events or even multiple organisms.
- Fig. 6 shows a screen display illustrating gene expression levels for multiple genes as collected from two tissue samples. A displayed
horizontal axis 1002 represents expression level measured in one or more nucleic acid samples taken from the first tissue sample. A displayedvertical axis 1004 represents expression level in one or more nucleic acid samples taken from the second tissue sample. Each ofmarks 1006 represent a particular gene whose expression level has been measured in both the first and second tissue samples. Eachmark 1006 is placed at a distance fromvertical axis 1004 corresponding to expression level in the first tissue sample and at a distance from thehorizontal axis 1002 corresponding to expression level in the second tissue sample. - The expression levels used for determining the position of
marks 1006 are preferably taken from the result ofstep 975. The position of each ofmarks 1006 depends on two iterations of the steps of Fig. 5, once for the sample taken from the first tissue sample and once for the sample taken from the second tissue sample. However, a mark is preferably displayed only if one of the samples meets the threshold criteria atstep 972. - In the depicted representative screen display, the first tissue sample is a cancerous tissue sample and the second tissue sample is a normal tissue sample. The individual marks represent the expression levels of selected genes in both cancerous and normal tissue. A first group of
marks 1008 represent genes that are neither tumor suppressors nor oncogenes since their expression levels are roughly similar for both normal and cancerous tissue. Thesemarks 1008 fall roughly along a line which is rotated 45 degrees from each of the axes. A second group ofmarks 1010 represent genes that are likely oncogenes since their expression levels are found to be significantly higher in cancerous tissue than in normal tissue. A third group ofmarks 1012 represent genes that are likely tumor suppressors since their expression levels are found to be significantly higher in normal tissue than in cancerous tissue. It will be appreciated that expression levels for large numbers of genes can be reviewed at once to discover the oncogenes and tumor suppressors. - Although in the depicted display, the two types of tissue are normal tissue and cancerous tissue, the present invention would aid in the discovery of genes whose expression is associated with any characteristic that varies among tissue samples. For example, once can compare expression results from tissue from individuals who have been exposed to HIV but remain infected to tissue obtained from infected individuals to identify genes conferring resistance to HIV. One can compare expression results between tissue from plants that survive drought to plants that do not. One can compare expression levels among tissue samples at successive stages or severity levels of the same disease, among tissue samples where different ultimate outcomes of the disease (e.g., patient death or remission) are known, among diseased tissue samples that have been subject to different treatment regimes including e.g, chemotherapy, antisense RNA, etc. For cancers, one can compare expression levels between malignant cells and non-malignant cells. Also expression levels can be compared among different organs, between species, and among different stages of development of an organ.
- It will be appreciated that the present invention also encompasses displays with more than two dimensions. A third visual dimension can be used to illustrate expression level from a third tissue sample. The time dimension can also be used to illustrate successive groups of two or three tissue samples at successive time periods. The time dimension can be also used to correspond to tissue samples obtained at, e.g, successive stages of a disease.
- Other interface methods corresponding to human senses other than sight can also be incorporated within the presentation system of the present invention. The senses may correspond to additional dimensions. For example, marks can be displayed in succession accompanies by a sound having characteristics corresponding to expression level in another tissue sample.
- The user can employ a
cursor 1014 to identify a particular mark as being of interest.Cursor 1014 can be moved to a particular mark by use of, e.g.,mouse 11. Oncecursor 1014 is over a mark of interest, the mark can be selected by, e.g., depression of one ofmouse buttons 13. Selection of a particular mark can be facilitated by use of a zoom display feature (not shown). Once a particular mark is selected, further information is displayed about the gene represented by the mark. A special mouse can transmit a tactile sensation back to the user corresponding to expression level in a tissue sample as the user passes the mouse over a corresponding mark. - It will be appreciated that the display of Fig. 6 is not limited to expression information. The two dimensions of Fig. 6 may correspond to indicators of the presence of various polymers other than nucleic acids in two different samples. For example, each mark may correspond to a different polymer, polypeptide, or other compound. The distance of the mark from each axis would correspond to a measure of presence of the particular polymer in the sample corresponding to the axis. One possible measure is produced by fluorescently tagging polymer samples such as protein samples and exposing a probe array such as a peptide probe array to the protein samples. The fluorescent intensity of the probes will then correspond to the bonding affinity of the sample to the probes. The intensity measurement or a measurement derived from the intensity measurement may then be used to position the marks of Fig. 6.
- Fig. 7A shows a screen display giving information about a particular gene selected from the display of Fig. 6. A
cluster number 702, aGenBank accession number 704, and averbal description 706 for the selected gene are displayed. The user can also select a number ofmarks 1006 by circling them withcursor 1014. Then a list of information as shown in Fig. 7A is displayed for all the genes corresponding to the selected marks. - By selecting
GenBank accession number 704 with another cursor (not shown), the user can direct retrieval of the GenBank information for the selected gene. If the GenBank information is not available locally, the retrieval process can include formulating a query and transmitting the query to a GenBank web site. Once the GenBank information is retrieved, it can also be displayed. Fig. 7B depicts the GenBank information for the gene identified in Fig. 7A. - In the foregoing specification, the invention has been described with reference to specific exemplary embodiments thereof. It will, however, be evident that various modifications and changes may be made thereunto without departing from the broader spirit and scope of the invention as set forth in the appended claims and their full scope of equivalents.
Claims (54)
- A computer-implemented method of presenting expression level information as collected from first and second samples, said method comprising the steps of:displaying a first axis corresponding to expression level in said first sample;displaying a second axis substantially perpendicular to said first axis, said second axis corresponding to expression level in said second sample; andfor a selected expressed sequence, displaying a mark at a position, wherein said position is selected relative to said first axis in accordance with an expression level of said selected expressed sequence in said first sample and relative to said second axis in accordance with an expression level of said selected expressed sequence in said second sample.
- The method of claim 1 wherein said selected expressed sequence comprises a gene.
- The method of claim 1 wherein said selected expressed sequence comprises a portion of a gene.
- The method of claim 1 further comprising the step of repeating said displaying a mark step for a plurality of selected expressed sequences.
- The method of claim 1 further comprising the steps of:
monitoring said expression level of said expressed sequence in said first sample and said second sample. - The method of claim 3 wherein said monitoring step for one of said samples comprises substeps of:inputting a plurality of hybridization intensities of pairs of perfect match and mismatch probes, said perfect match probes being perfectly complementary to a target nucleic acid sequence indicative of expression of said selected gene and said mismatch probes having at least one base mismatch with said target sequence, and said hybridization intensities indicating hybridization affinity between said perfect match and mismatch probes and a sample nucleic acid sequence from said one of said samples;comparing the hybridization intensities of each pair of perfect match probe and mismatch probe; andgenerating said expression level for said expressed sequence and said one of said samples responsive to results of said comparing step.
- The method of claim 6 further comprising the step of:
comparing a difference between hybridization intensities of perfect match and mismatch probes at a base position to a difference threshold. - The method of claim 7 further comprising the step of:
comparing a quotient of hybridization intensities of perfect match and mismatch probes at a base position to a ratio threshold. - The method of claim 6 further comprising the steps of:a) counting a probe pair as a positive probe pair to increment a positive probe pair count if a perfect match probe intensity minus a mismatch probe intensity exceeds a difference threshold and said perfect match probe intensity divided by said mismatch probe intensity exceeds a ratio threshold;b) counting said probe pair as a negative probe pair to increment a negative probe pair count if said mismatch probe intensity minus said perfect match probe intensity exceeds said difference threshold and said mismatch probe intensity divided by said perfect match probe intensity exceeds said ratio threshold; andc) computing a logarithmic ratio of said perfect match probe intensity to said mismatch probe intensity.
- The method of claim 9 further comprising the steps of:repeating said a), b), and c) steps for each of said probe pairs, accumulating a sum of differences of said perfect match and mismatch probe intensities for probe pairs that cause; anddetermining an expression level of said selected expressed sequence to be an average of said differences.
- The method of claim 1 further comprising the steps of:receiving user input selecting said mark; andin response to said user input, displaying information about said selected expressed sequence.
- The method of claim 11 further comprising the steps of:
in response to said user input, displaying information about said selected expressed sequence. - The method of claim 12 wherein said information about said selected expressed sequence comprises a GenBank accession number.
- The method of claim 12 wherein said information about said selected expressed sequence comprises a GenBank database record for said selected expressed sequence.
- The method of claim 1 wherein said first sample and said second sample are collected from tissue samples differing in a particular characteristic.
- The method of claim 15 wherein said particular characteristic comprises presence of disease.
- The method of claim 15 wherein said particular characteristic comprises a treatment strategy for a disease.
- The method of claim 1 wherein said particular characteristic is a stage of a disease.
- The method of claim 1 further comprising the step of :
displaying a third axis substantially perpendicular to said first axis and to said second axis in a three-dimensional display environment wherein said position of said mark is further selected relative to said third axis in accordance with an expression level of said selected expressed sequence in a third sample. - A computer-implemented method of presenting sample analysis information comprising the steps of:displaying a first axis corresponding to a concentration of a compound in a first sample as determined by monitoring binding of said compound to a selected polymer having binding affinity to said compound;displaying a second axis substantially perpendicular to said first axis, said second axis corresponding to a concentration of said compound in said second sample as determined by monitoring binding of said compound to said selected polymer; anddisplaying a mark at a position, wherein said position is selected relative to said first axis in accordance with said concentration in said first sample and relative to said second axis in accordance with said concentration in said second sample.
- The method of claim 20 wherein said selected polymer comprises a nucleic acid sequence.
- The method of claim 20 wherein said selected polymer comprises a protein.
- The method of claim 21 further comprising the step of:
obtaining said concentration of said compound in said first sample by exposing said first sample to a plurality of nucleic acid probes. - The method of claim 22 further comprising the step of:
obtaining said concentration of said compound in said first sample by exposing said first sample to a plurality of peptide probes. - A computer program product for presenting expression level information as collected from first and second samples, said product comprising::code for displaying a first axis corresponding to expression level in said first sample;code for displaying a second axis substantially perpendicular to said first axis, said second axis corresponding to expression level in said second sample;code for, for a selected expressed sequence, displaying a mark at a position, wherein said position is selected relative to said first axis in accordance with an expression level of said selected expressed sequence in said first sample and relative to said second axis in accordance with an expression level of said selected expressed sequence in said second sample; anda computer-readable storage medium for storing the codes.
- The product of claim 25 wherein said selected expressed sequence comprises a gene.
- The product of claim 25 wherein said selected expressed sequence comprises a portion of a gene.
- The product of claim 25 further comprising code for repeatedly applying said displaying a mark code for a plurality of selected expressed sequences.
- The product of claim 25 further comprising:
code for monitoring said expression level of said expressed sequence in said first sample and said second sample. - The product of claim 27 wherein said monitoring step for one of said samples comprises:code for inputting a plurality of hybridization intensities of pairs of perfect match and mismatch probes, said perfect match probes being perfectly complementary to a target nucleic acid sequence indicative of expression of said selected gene and said mismatch probes having at least one base mismatch with said target sequence, and said hybridization intensities indicating hybridization affinity between said perfect match and mismatch probes and a sample nucleic acid sequence from said one of said samples;comparing the hybridization intensities of each pair of perfect match probe and mismatch probe; andgenerating said expression level for said expressed sequence and said one of said samples responsive to results of said comparing step.
- The product of claim 30 further comprising:
code for comparing a difference between hybridization intensities of perfect match and mismatch probes at a base position to a difference threshold. - The product of claim 31 further comprising:
code for comparing a quotient of hybridization intensities of perfect match and mismatch probes at a base position to a ratio threshold. - The product of claim 30 further comprising:a) code for counting a probe pair as a positive probe pair to increment a positive probe pair count if a perfect match probe intensity minus a mismatch probe intensity exceeds a difference threshold and said perfect match probe intensity divided by said mismatch probe intensity exceeds a ratio threshold;b) code for counting said probe pair as a negative probe pair to increment a negative probe pair count if said mismatch probe intensity minus said perfect match probe intensity exceeds said difference threshold and said mismatch probe intensity divided by said perfect match probe intensity exceeds said ratio threshold; andc) code for computing a logarithmic ratio of said perfect match probe intensity to said mismatch probe intensity.
- The product of claim 33 further comprising:code for repeatedly applying said a), b), and c) codes for each of said probe pairs, accumulating a sum of differences of said perfect match and mismatch probe intensities for probe pairs that cause; andcode for determining an expression level of said selected expressed sequence to be an average of said differences.
- The product of claim 25 further comprising:code for receiving user input selecting said mark; andcode for, in response to said user input, displaying information about said selected expressed sequence.
- The product of claim 35 further comprising:
code for, in response to said user input, displaying information about said selected expressed sequence. - The product of claim 36 wherein said information about said selected expressed sequence comprises a GenBank accession number.
- The product of claim 36 wherein said information about said selected expressed sequence comprises a GenBank database record for said selected expressed sequence.
- The product of claim 25 wherein said first sample and said second sample are collected from tissue samples differing in a particular characteristic.
- The product of claim 39 wherein said particular characteristic comprises presence of disease.
- The product of claim 39 wherein said particular characteristic comprises a treatment strategy for a disease.
- The product of claim 25 wherein said particular characteristic is a stage of a disease.
- The product of claim 25 further comprising the step of :
displaying a third axis substantially perpendicular to said first axis and to said second axis in a three-dimensional display environment wherein said position of said mark is further selected relative to said third axis in accordance with an expression level of said selected expressed sequence in a third sample. - A computer program product for presenting sample analysis information comprising:code for displaying a first axis corresponding to a concentration of a compound in a first sample as determined by monitoring binding of said compound to a selected polymer having bonding affinity to said compound;code for displaying a second axis substantially perpendicular to said first axis, said second axis corresponding to concentration of said compound in a second sample as determined by monitoring binding of said compound to said selected polymer;code for displaying a mark at a position, wherein said position is selected relative to said first axis in accordance with said concentration in said first sample and relative to said second axis in accordance with said concentration in said second sample; anda computer-readable storage medium that stores the codes.
- The product of claim 44 wherein said selected polymer comprises a nucleic acid sequence.
- The product of claim 44 wherein said selected polymer comprises a protein.
- A computer system comprising a display, a processor, and a memory that stores instructions for configuring said processor to:display a first axis corresponding to expression level in said first sample;display a second axis substantially perpendicular to said first axis, said second axis corresponding to expression level in said second sample; andfor a selected expressed sequence, display a mark at a position, wherein said position is selected relative to said first axis in accordance with an expression level of said selected expressed sequence in said first sample and relative to said second axis in accordance with an expression level of said selected expressed sequence in said second sample.
- A computer system comprising a display, a processor, and a memory that stores instructions for configuring said processor to:display a first axis corresponding to a concentration of a compound in a first sample as determined by monitoring binding of said compound to a selected polymer having binding affinity to said compound;display a second axis substantially perpendicular to said first axis, said second axis corresponding to a concentration of said compound in said second sample as determined by monitoring binding of said compound to said selected polymer; anddisplay a mark at a position, wherein said position is selected relative to said first axis in accordance with said concentration in said first sample and relative to said second axis in accordance with said concentration in said second sample.
- A method of monitoring gene expression in first and second samples, the method comprising presenting expression level information as collected from said first and second samples, in accordance with any of claims 1 to 19, and using the displayed mark to monitor said gene expression.
- A method of analysing first and second samples, the method comprising presenting sample analysis information relating to said first and second samples, in accordance with any of claims 20 to 24, and using the displayed mark to analyse said samples.
- A method of identifying a gene of interest, the method comprising presenting expression level information relating to a gene, as collected from said first and second samples, in accordance with any of claims 1 to 19, and using the displayed mark to identify whether said gene is of interest.
- A method of identifying a gene having different expression levels in first and second samples, the method comprising presenting expression level information relating to said gene in accordance with any of claims 1 to 19, said expression level information being collected from said first and second samples, and using the displayed mark to identify said gene.
- A method of identifying a gene having an effect on a characteristic of a tissue sample, the method comprising presenting expression level information relating to said gene in accordance with any of claims 1 to 19, said expression level information being collected from said first and second samples differing in said characteristic, and using the displayed mark to identify said gene.
- A method of identifying a compound having different concentrations in first and second samples, the method comprising presenting sample analysis information relating to said first and second samples, in accordance with any of claims 20 to 24, and using the displayed mark to analyse said samples.
Applications Claiming Priority (2)
| Application Number | Priority Date | Filing Date | Title |
|---|---|---|---|
| US20743 | 1998-02-09 | ||
| US09/020,743 US6420108B2 (en) | 1998-02-09 | 1998-02-09 | Computer-aided display for comparative gene expression |
Publications (2)
| Publication Number | Publication Date |
|---|---|
| EP0935210A2 true EP0935210A2 (en) | 1999-08-11 |
| EP0935210A3 EP0935210A3 (en) | 2002-11-20 |
Family
ID=21800291
Family Applications (1)
| Application Number | Title | Priority Date | Filing Date |
|---|---|---|---|
| EP99300900A Ceased EP0935210A3 (en) | 1998-02-09 | 1999-02-08 | Computer aided visualisation of expression comparison |
Country Status (4)
| Country | Link |
|---|---|
| US (4) | US6420108B2 (en) |
| EP (1) | EP0935210A3 (en) |
| JP (1) | JPH11342000A (en) |
| CA (1) | CA2259887A1 (en) |
Cited By (8)
| Publication number | Priority date | Publication date | Assignee | Title |
|---|---|---|---|---|
| EP1146127A2 (en) * | 2000-03-27 | 2001-10-17 | Hitachi Software Engineering Co., Ltd. | Method for displaying gene experiment data |
| WO2001084139A1 (en) * | 2000-05-04 | 2001-11-08 | The Board Of Trustees Of The Leland Stanford Junior University | Significance analysis of microarrays |
| EP1277103A2 (en) * | 2000-08-22 | 2003-01-22 | Affymetrix, Inc. | System, method, and computer software product for linked window interfaces |
| EP1328880A1 (en) * | 2000-10-12 | 2003-07-23 | Iconix Pharmaceuticals, Inc. | Interactive correlation of compound information and genomic information |
| EP1314787A3 (en) * | 2001-11-26 | 2004-01-07 | Kudoh, Norio | The Midkine gene is associated with cancer |
| EP1588142A2 (en) * | 2002-11-21 | 2005-10-26 | Wyeth | Methods for diagnosing rcc and other solid tumors |
| US7467118B2 (en) | 2006-01-12 | 2008-12-16 | Entelos Inc. | Adjusted sparse linear programming method for classifying multi-dimensional biological data |
| US7588892B2 (en) | 2004-07-19 | 2009-09-15 | Entelos, Inc. | Reagent sets and gene signatures for renal tubule injury |
Families Citing this family (93)
| Publication number | Priority date | Publication date | Assignee | Title |
|---|---|---|---|---|
| US5959098A (en) | 1996-04-17 | 1999-09-28 | Affymetrix, Inc. | Substrate preparation process |
| US6706875B1 (en) * | 1996-04-17 | 2004-03-16 | Affyemtrix, Inc. | Substrate preparation process |
| US6420108B2 (en) * | 1998-02-09 | 2002-07-16 | Affymetrix, Inc. | Computer-aided display for comparative gene expression |
| US6142681A (en) | 1999-02-22 | 2000-11-07 | Vialogy Corporation | Method and apparatus for interpreting hybridized bioelectronic DNA microarray patterns using self-scaling convergent reverberant dynamics |
| US20040111219A1 (en) * | 1999-02-22 | 2004-06-10 | Sandeep Gulati | Active interferometric signal analysis in software |
| US6245511B1 (en) * | 1999-02-22 | 2001-06-12 | Vialogy Corp | Method and apparatus for exponentially convergent therapy effectiveness monitoring using DNA microarray based viral load measurements |
| US6136541A (en) | 1999-02-22 | 2000-10-24 | Vialogy Corporation | Method and apparatus for analyzing hybridized biochip patterns using resonance interactions employing quantum expressor functions |
| DE60026190T2 (en) * | 1999-03-30 | 2006-08-31 | Fuji Photo Film Co., Ltd., Minami-Ashigara | Method and device for the selective display of results and matching images |
| DE60030859T2 (en) * | 1999-06-18 | 2007-06-14 | The Research Foundation Of State University Of New York | GROUPS OF BORRELIA BURGDORFERI CREATING LYME DISEASE |
| JP3451035B2 (en) | 1999-07-27 | 2003-09-29 | 日立ソフトウエアエンジニアリング株式会社 | Microarray information display method |
| US6510391B2 (en) * | 2000-11-22 | 2003-01-21 | Affymetrix, Inc. | Computer software products for nucleic acid hybridization analysis |
| AU2002221104A1 (en) * | 2000-12-11 | 2002-06-24 | Chugai Seiyaku Kabushiki Kaisha | Method of detecting relation between genes |
| US20020183936A1 (en) * | 2001-01-24 | 2002-12-05 | Affymetrix, Inc. | Method, system, and computer software for providing a genomic web portal |
| US20030009294A1 (en) * | 2001-06-07 | 2003-01-09 | Jill Cheng | Integrated system for gene expression analysis |
| AU2002357368A1 (en) * | 2001-12-19 | 2003-07-09 | Affymetrix, Inc. | Array plates and method for constructing array plates |
| JP3563394B2 (en) * | 2002-03-26 | 2004-09-08 | 株式会社日立製作所 | Screen display system |
| EP1502098B1 (en) * | 2002-05-03 | 2008-09-17 | ViaLogy, LLC | Method for characterizing microarray output data |
| US9453251B2 (en) | 2002-10-08 | 2016-09-27 | Pfenex Inc. | Expression of mammalian proteins in Pseudomonas fluorescens |
| AU2004234996B2 (en) * | 2003-05-01 | 2007-07-19 | Japan Science And Technology Agency | Array having substances fixed on support arranged with chromosomal order or sequence position information added thereto, process for producing the same, analytical system using the array and use of these |
| US20050027460A1 (en) * | 2003-07-29 | 2005-02-03 | Kelkar Bhooshan Prafulla | Method, program product and apparatus for discovering functionally similar gene expression profiles |
| WO2005042760A2 (en) | 2003-09-29 | 2005-05-12 | Pathwork Informatics, Inc. | Systems and methods for detecting biological features |
| US8321137B2 (en) * | 2003-09-29 | 2012-11-27 | Pathwork Diagnostics, Inc. | Knowledge-based storage of diagnostic models |
| US20050069863A1 (en) * | 2003-09-29 | 2005-03-31 | Jorge Moraleda | Systems and methods for analyzing gene expression data for clinical diagnostics |
| CA2497324A1 (en) | 2004-02-17 | 2005-08-17 | Affymetrix, Inc. | Methods for fragmenting and labelling dna |
| US8603824B2 (en) | 2004-07-26 | 2013-12-10 | Pfenex, Inc. | Process for improved protein expression by strain engineering |
| US8484000B2 (en) * | 2004-09-02 | 2013-07-09 | Vialogy Llc | Detecting events of interest using quantum resonance interferometry |
| US20060073506A1 (en) | 2004-09-17 | 2006-04-06 | Affymetrix, Inc. | Methods for identifying biological samples |
| US20060073511A1 (en) | 2004-10-05 | 2006-04-06 | Affymetrix, Inc. | Methods for amplifying and analyzing nucleic acids |
| US7682782B2 (en) | 2004-10-29 | 2010-03-23 | Affymetrix, Inc. | System, method, and product for multiple wavelength detection using single source excitation |
| JP2006126204A (en) | 2004-10-29 | 2006-05-18 | Affymetrix Inc | Automated method for manufacturing polymer array |
| WO2006088208A1 (en) * | 2005-02-21 | 2006-08-24 | Dainippon Sumitomo Pharma Co., Ltd | Method of estimating physiological change in living body and apparatus tehrefor |
| US8121793B2 (en) * | 2005-06-03 | 2012-02-21 | Eppendorf Ag | Method and device for comparative display of biological data |
| JP2007034343A (en) * | 2005-07-21 | 2007-02-08 | Fujitsu Ltd | Genetic information display device, genetic information display method, genetic information display program and recording medium |
| US7707907B2 (en) | 2005-11-17 | 2010-05-04 | Socovar, Société En Commandite | Planar parallel mechanism and method |
| US20070198653A1 (en) * | 2005-12-30 | 2007-08-23 | Kurt Jarnagin | Systems and methods for remote computer-based analysis of user-provided chemogenomic data |
| US8009889B2 (en) | 2006-06-27 | 2011-08-30 | Affymetrix, Inc. | Feature intensity reconstruction of biological probe array |
| US8586006B2 (en) | 2006-08-09 | 2013-11-19 | Institute For Systems Biology | Organ-specific proteins and methods of their use |
| US8058918B2 (en) * | 2006-11-02 | 2011-11-15 | Redmere Technology Ltd. | Programmable high-speed cable with boost device |
| JP2010508815A (en) | 2006-11-02 | 2010-03-25 | イエール・ユニバーシテイ | Evaluation of oocyte receptivity |
| US9580719B2 (en) * | 2007-04-27 | 2017-02-28 | Pfenex, Inc. | Method for rapidly screening microbial hosts to identify certain strains with improved yield and/or quality in the expression of heterologous proteins |
| BRPI0810120A2 (en) | 2007-04-27 | 2014-11-11 | Dow Global Technologies Inc | PROCESS TO QUICKLY SELECT MICROBIAN HOST FOR THE IDENTIFICATION OF CERTAIN BETTER YIELDS AND / OR QUALITY IN EXPRESSION OF HETEROLOGICAL PROTEINS |
| ES2642793T3 (en) | 2008-11-06 | 2017-11-20 | University Of Miami | Role of soluble uPAR in the pathogenesis of proteinuric renal disease |
| ES2595410T3 (en) | 2009-01-07 | 2016-12-29 | Myriad Genetics, Inc. | Cancer biomarkers |
| CN104878086A (en) | 2009-02-11 | 2015-09-02 | 卡里斯Mpi公司 | Molecular Profiling For Personalized Medicine |
| WO2011056688A2 (en) | 2009-10-27 | 2011-05-12 | Caris Life Sciences, Inc. | Molecular profiling for personalized medicine |
| US20110201008A1 (en) * | 2009-12-01 | 2011-08-18 | University Of Miami | Assays, methods and kits for measuring response to therapy and predicting clinical outcome in patients with b-cell lymphoma |
| US8835358B2 (en) | 2009-12-15 | 2014-09-16 | Cellular Research, Inc. | Digital counting of individual molecules by stochastic attachment of diverse labels |
| US9798855B2 (en) | 2010-01-07 | 2017-10-24 | Affymetrix, Inc. | Differential filtering of genetic data |
| US9216189B2 (en) | 2010-01-25 | 2015-12-22 | Icahn School Of Medicine At Mount Sinai | Antibodies which bind type I cannabinoid receptor/angiotensis II receptor heteromers |
| EP2563380B1 (en) | 2010-04-26 | 2018-05-30 | aTyr Pharma, Inc. | Innovative discovery of therapeutic, diagnostic, and antibody compositions related to protein fragments of cysteinyl-trna synthetase |
| WO2011139799A2 (en) | 2010-04-27 | 2011-11-10 | Atyr Pharma, Inc. | Innovative discovery of therapeutic, diagnostic, and antibody compositions related to protein fragments of isoleucyl trna synthetases |
| US8993723B2 (en) | 2010-04-28 | 2015-03-31 | Atyr Pharma, Inc. | Innovative discovery of therapeutic, diagnostic, and antibody compositions related to protein fragments of alanyl-tRNA synthetases |
| US8986680B2 (en) | 2010-04-29 | 2015-03-24 | Atyr Pharma, Inc. | Innovative discovery of therapeutic, diagnostic, and antibody compositions related to protein fragments of Asparaginyl tRNA synthetases |
| US9068177B2 (en) | 2010-04-29 | 2015-06-30 | Atyr Pharma, Inc | Innovative discovery of therapeutic, diagnostic, and antibody compositions related to protein fragments of glutaminyl-tRNA synthetases |
| AU2011248457B2 (en) | 2010-04-29 | 2017-02-16 | Pangu Biopharma Limited | Innovative discovery of therapeutic, diagnostic, and antibody compositions related to protein fragments of valyl tRNA synthetases |
| JP6008840B2 (en) | 2010-05-03 | 2016-10-19 | エータイアー ファーマ, インコーポレイテッド | Innovative discovery of therapeutic, diagnostic and antibody compositions related to protein fragments of phenylalanyl αtRNA synthetase |
| US8981045B2 (en) | 2010-05-03 | 2015-03-17 | Atyr Pharma, Inc. | Innovative discovery of therapeutic, diagnostic, and antibody compositions related to protein fragments of methionyl-tRNA synthetases |
| EP2566515B1 (en) | 2010-05-03 | 2017-08-02 | aTyr Pharma, Inc. | Innovative discovery of therapeutic, diagnostic, and antibody compositions related to protein fragments of arginyl-trna synthetases |
| CA2798139C (en) | 2010-05-04 | 2019-09-24 | Atyr Pharma, Inc. | Innovative discovery of therapeutic, diagnostic, and antibody compositions related to protein fragments of p38 multi-trna synthetase complex |
| EP2568996B1 (en) | 2010-05-14 | 2017-10-04 | aTyr Pharma, Inc. | Therapeutic, diagnostic, and antibody compositions related to protein fragments of phenylalanyl-beta-trna synthetases |
| US8962560B2 (en) | 2010-06-01 | 2015-02-24 | Atyr Pharma Inc. | Innovative discovery of therapeutic, diagnostic, and antibody compositions related to protein fragments of Lysyl-tRNA synthetases |
| EP2591126B1 (en) | 2010-07-07 | 2020-12-30 | Myriad Genetics, Inc. | Gene signatures for cancer prognosis |
| JP6116479B2 (en) | 2010-07-12 | 2017-04-19 | エータイアー ファーマ, インコーポレイテッド | Innovative discovery of therapeutic, diagnostic and antibody compositions related to protein fragments of glycyl-tRNA synthetase |
| EP2608801B1 (en) | 2010-08-25 | 2019-08-21 | aTyr Pharma, Inc. | INNOVATIVE DISCOVERY OF THERAPEUTIC, DIAGNOSTIC, AND ANTIBODY COMPOSITIONS RELATED TO PROTEIN FRAGMENTS OF TYROSYL-tRNA SYNTHETASES |
| GB201021502D0 (en) | 2010-12-20 | 2011-02-02 | Cambridge Entpr Ltd | Biomarkers |
| AU2012367247B2 (en) | 2012-01-24 | 2018-04-05 | Cd Diagnostics, Inc. | System for detecting infection in synovial fluid |
| EP3311847A1 (en) | 2012-02-16 | 2018-04-25 | Atyr Pharma, Inc. | Histidyl-trna synthetases for treating autoimmune and inflammatory diseases |
| EP2820174B1 (en) | 2012-02-27 | 2019-12-25 | The University of North Carolina at Chapel Hill | Methods and uses for molecular tags |
| WO2013130674A1 (en) | 2012-02-27 | 2013-09-06 | Cellular Research, Inc. | Compositions and kits for molecular counting |
| GB201210565D0 (en) | 2012-06-14 | 2012-08-01 | Cambridge Entpr Ltd | Biomarkers |
| EP2920322B1 (en) | 2012-11-16 | 2023-01-11 | Myriad Genetics, Inc. | Gene signatures for cancer prognosis |
| AU2013352339B2 (en) | 2012-11-27 | 2019-07-04 | Pontificia Universidad Catolica De Chile | Compositions and methods for diagnosing thyroid tumors |
| US10535420B2 (en) | 2013-03-15 | 2020-01-14 | Affymetrix, Inc. | Systems and methods for probe design to detect the presence of simple and complex indels |
| US11021752B2 (en) | 2013-03-15 | 2021-06-01 | Myriad Genetics, Inc. | Genes and gene signatures for diagnosis and treatment of melanoma |
| GB201404189D0 (en) | 2014-03-10 | 2014-04-23 | Cambridge Entpr Ltd | Novel biomarkers |
| EP3623482A1 (en) | 2014-05-13 | 2020-03-18 | Myriad Genetics, Inc. | Gene signatures for cancer prognosis |
| EP4250299A3 (en) | 2014-07-02 | 2023-12-06 | Myriad myPath, LLC | Genes and gene signatures for diagnosis and treatment of melanoma |
| WO2016042067A1 (en) * | 2014-09-17 | 2016-03-24 | Vito Nv | Methods and tools for analyzing hybridization |
| GB201500729D0 (en) | 2015-01-16 | 2015-03-04 | Cambridge Entpr Ltd | Novel Biomarkers |
| AU2016301231A1 (en) | 2015-08-04 | 2018-02-22 | Cd Diagnostics, Inc. | Methods for detecting adverse local tissue reaction (ALTR) necrosis |
| WO2017087819A1 (en) | 2015-11-19 | 2017-05-26 | Myriad Genetics, Inc. | Signatures for predicting cancer immune therapy response |
| WO2017120456A1 (en) | 2016-01-06 | 2017-07-13 | Myriad Genetics, Inc. | Genes and gene signatures for diagnosis and treatment of melanoma |
| WO2017193062A1 (en) | 2016-05-06 | 2017-11-09 | Myriad Genetics, Inc. | Gene signatures for renal cancer prognosis |
| WO2019046832A1 (en) | 2017-09-01 | 2019-03-07 | Juno Therapeutics, Inc. | Gene expression and assessment of risk of developing toxicity following cell therapy |
| WO2019246160A2 (en) | 2018-06-18 | 2019-12-26 | Igenomix, S.L. | Methods, compositions, and kits for assessing endometrial transformation |
| WO2020002621A2 (en) | 2018-06-29 | 2020-01-02 | F. Hoffmann-La Roche Ag | Detection of microsatellite instability |
| US20210388449A1 (en) | 2018-10-09 | 2021-12-16 | Genecentric Therapeutics, Inc. | Detecting cancer cell of origin |
| WO2020113237A1 (en) | 2018-11-30 | 2020-06-04 | Caris Mpi, Inc. | Next-generation molecular profiling |
| US20220220564A1 (en) | 2019-04-17 | 2022-07-14 | Igenomix, S.L. | Improved methods for the early diagnosis of uterine leiomyomas and leiomyosarcomas |
| KR20220034782A (en) | 2019-06-12 | 2022-03-18 | 주노 쎄러퓨티크스 인코퍼레이티드 | Combination therapy of cell-mediated cytotoxicity therapy and pro-survival BLC2 family protein inhibitors |
| US20220298222A1 (en) | 2019-08-22 | 2022-09-22 | Juno Therapeutics, Inc. | Combination therapy of a t cell therapy and an enhancer of zeste homolog 2 (ezh2) inhibitor and related methods |
| AU2020397802A1 (en) | 2019-12-02 | 2022-06-16 | Caris Mpi, Inc. | Pan-cancer platinum response predictor |
| GB201919092D0 (en) | 2019-12-20 | 2020-02-05 | Cambridge Entpr Ltd | Method of determining risk of fetal size abnormality |
Citations (3)
| Publication number | Priority date | Publication date | Assignee | Title |
|---|---|---|---|---|
| US4845653A (en) * | 1987-05-07 | 1989-07-04 | Becton, Dickinson And Company | Method of displaying multi-parameter data sets to aid in the analysis of data characteristics |
| EP0561241A2 (en) * | 1992-03-20 | 1993-09-22 | International Business Machines Corporation | An interactive graphical method for analyzing many-dimensional data sets |
| WO1997027317A1 (en) * | 1996-01-23 | 1997-07-31 | Affymetrix, Inc. | Nucleic acid analysis techniques |
Family Cites Families (51)
| Publication number | Priority date | Publication date | Assignee | Title |
|---|---|---|---|---|
| US4617431A (en) * | 1983-12-02 | 1986-10-14 | Plantronics, Inc. | Voice tube assemblies for post-auricle headsets |
| US4683202A (en) | 1985-03-28 | 1987-07-28 | Cetus Corporation | Process for amplifying nucleic acid sequences |
| NO870613L (en) | 1986-03-05 | 1987-09-07 | Molecular Diagnostics Inc | DETECTION OF MICROORGANISMS IN A SAMPLE CONTAINING NUCLEIC ACID. |
| EP0307476A4 (en) | 1986-12-20 | 1990-12-12 | Kukita, Takeshi | Bilirubin antigen, monoclonal antibody therefor, process for their preparation, and their use |
| US5525464A (en) | 1987-04-01 | 1996-06-11 | Hyseq, Inc. | Method of sequencing by hybridization of oligonucleotide probes |
| US5202231A (en) | 1987-04-01 | 1993-04-13 | Drmanac Radoje T | Method of sequencing of genomes by hybridization of oligonucleotide probes |
| US5700637A (en) | 1988-05-03 | 1997-12-23 | Isis Innovation Limited | Apparatus and method for analyzing polynucleotide sequences and method of generating oligonucleotide arrays |
| DE68928853T2 (en) | 1988-05-20 | 1999-08-05 | Cetus Corp | FASTENING OF SEQUENCE-SPECIFIC SAMPLES |
| US5206137A (en) | 1988-09-08 | 1993-04-27 | Lifecodes Corporation | Compositions and methods useful for genetic analysis |
| US6203977B1 (en) * | 1988-11-15 | 2001-03-20 | Yale University | Delineation of individual human chromosomes in metaphase and interphase cells by in situ suppression hybridization |
| EP0392546A3 (en) | 1989-04-14 | 1991-09-11 | Ro Institut Za Molekularnu Genetiku I Geneticko Inzenjerstvo | Process for determination of a complete or a partial contents of very short sequences in the samples of nucleic acids connected to the discrete particles of microscopic size by hybridization with oligonucleotide probes |
| US6040138A (en) * | 1995-09-15 | 2000-03-21 | Affymetrix, Inc. | Expression monitoring by hybridization to high density oligonucleotide arrays |
| US5800992A (en) * | 1989-06-07 | 1998-09-01 | Fodor; Stephen P.A. | Method of detecting nucleic acids |
| US5871928A (en) * | 1989-06-07 | 1999-02-16 | Fodor; Stephen P. A. | Methods for nucleic acid analysis |
| US5143854A (en) | 1989-06-07 | 1992-09-01 | Affymax Technologies N.V. | Large scale photolithographic solid phase synthesis of polypeptides and receptor binding screening thereof |
| US5925525A (en) * | 1989-06-07 | 1999-07-20 | Affymetrix, Inc. | Method of identifying nucleotide differences |
| ES2155822T3 (en) | 1990-12-06 | 2001-06-01 | Affymetrix Inc | COMPOUNDS AND ITS USE IN A BINARY SYNTHESIS STRATEGY. |
| EP0834576B1 (en) | 1990-12-06 | 2002-01-16 | Affymetrix, Inc. (a Delaware Corporation) | Detection of nucleic acid sequences |
| ATE198358T1 (en) | 1992-04-27 | 2001-01-15 | Dartmouth College | DETECTION OF GENE SEQUENCES IN BIOLOGICAL LIQUIDS |
| US6251920B1 (en) * | 1993-05-13 | 2001-06-26 | Neorx Corporation | Prevention and treatment of cardiovascular pathologies |
| US6395494B1 (en) * | 1993-05-13 | 2002-05-28 | Neorx Corporation | Method to determine TGF-β |
| US5524070A (en) * | 1992-10-07 | 1996-06-04 | The Research Foundation Of State University Of New York | Local adaptive contrast enhancement |
| WO1995011995A1 (en) | 1993-10-26 | 1995-05-04 | Affymax Technologies N.V. | Arrays of nucleic acid probes on biological chips |
| US5632282A (en) * | 1993-07-20 | 1997-05-27 | Hay; S. Hutson | Ocular disease detection apparatus |
| EP0725682B1 (en) * | 1993-10-28 | 2002-03-20 | Houston Advanced Research Center | Microfabricated, flowthrough porous apparatus |
| US5571639A (en) | 1994-05-24 | 1996-11-05 | Affymax Technologies N.V. | Computer-aided engineering system for design of sequence arrays and lithographic masks |
| KR100404274B1 (en) * | 1994-09-30 | 2004-04-30 | 코닌클리케 필립스 일렉트로닉스 엔.브이. | A multimedia system that receives a representation of a large amount of data, including an application that includes a multiplatform interpreter, a platform subsystem that interacts with the multiplatform interpreter, and a mass memory for that system or subsystem. |
| US6600996B2 (en) * | 1994-10-21 | 2003-07-29 | Affymetrix, Inc. | Computer-aided techniques for analyzing biological sequences |
| US5795716A (en) | 1994-10-21 | 1998-08-18 | Chee; Mark S. | Computer-aided visualization and analysis system for sequence evaluation |
| WO1996023078A1 (en) | 1995-01-27 | 1996-08-01 | Incyte Pharmaceuticals, Inc. | Computer system storing and analyzing microbiological data |
| US5961923A (en) * | 1995-04-25 | 1999-10-05 | Irori | Matrices with memories and uses thereof |
| US5707806A (en) | 1995-06-07 | 1998-01-13 | Genzyme Corporation | Direct sequence identification of mutations by cleavage- and ligation-associated mutation-specific sequencing |
| US5777888A (en) | 1995-08-09 | 1998-07-07 | Regents Of The University Of California | Systems for generating and analyzing stimulus-response output signal matrices |
| US5871697A (en) | 1995-10-24 | 1999-02-16 | Curagen Corporation | Method and apparatus for identifying, classifying, or quantifying DNA sequences in a sample without sequencing |
| GB9522615D0 (en) | 1995-11-03 | 1996-01-03 | Pharmacia Spa | 4-Phenyl-4-oxo-butanoic acid derivatives with kynurenine-3-hydroxylase inhibiting activity |
| US5778200A (en) | 1995-11-21 | 1998-07-07 | Advanced Micro Devices, Inc. | Bus arbiter including aging factor counters to dynamically vary arbitration priority |
| US6028593A (en) * | 1995-12-01 | 2000-02-22 | Immersion Corporation | Method and apparatus for providing simulated physical interactions within computer generated environments |
| US6228575B1 (en) | 1996-02-08 | 2001-05-08 | Affymetrix, Inc. | Chip-based species identification and phenotypic characterization of microorganisms |
| US5707808A (en) * | 1996-04-15 | 1998-01-13 | The Regents Of The University Of California | Optical selection and collection of DNA fragments |
| US5989835A (en) * | 1997-02-27 | 1999-11-23 | Cellomics, Inc. | System for cell-based screening |
| US6023659A (en) * | 1996-10-10 | 2000-02-08 | Incyte Pharmaceuticals, Inc. | Database system employing protein function hierarchies for viewing biomolecular sequence data |
| US5687972A (en) * | 1996-11-26 | 1997-11-18 | Petrak; Gregory H. | Unitary oil seal assembly |
| US6420108B2 (en) * | 1998-02-09 | 2002-07-16 | Affymetrix, Inc. | Computer-aided display for comparative gene expression |
| EP1007737A4 (en) * | 1997-07-25 | 2002-07-03 | Affymetrix Inc | System for providing a polymorphism database |
| US20030036855A1 (en) * | 1998-03-16 | 2003-02-20 | Praelux Incorporated, A Corporation Of New Jersey | Method and apparatus for screening chemical compounds |
| AU2342900A (en) * | 1998-09-23 | 2000-05-01 | Cleveland Clinic Foundation, The | Novel interferon stimulated and repressed genes |
| US6567570B1 (en) * | 1998-10-30 | 2003-05-20 | Hewlett-Packard Development Company, L.P. | Optical image scanner with internal measurement of point-spread function and compensation for optical aberrations |
| US6251601B1 (en) * | 1999-02-02 | 2001-06-26 | Vysis, Inc. | Simultaneous measurement of gene expression and genomic abnormalities using nucleic acid microarrays |
| US6284465B1 (en) * | 1999-04-15 | 2001-09-04 | Agilent Technologies, Inc. | Apparatus, systems and method for locating nucleic acids bound to surfaces |
| US6569615B1 (en) * | 2000-04-10 | 2003-05-27 | The United States Of America As Represented By The Department Of Veteran's Affairs | Composition and methods for tissue preservation |
| US7731904B2 (en) * | 2000-09-19 | 2010-06-08 | Canon Kabushiki Kaisha | Method for making probe support and apparatus used for the method |
-
1998
- 1998-02-09 US US09/020,743 patent/US6420108B2/en not_active Expired - Lifetime
-
1999
- 1999-01-22 CA CA002259887A patent/CA2259887A1/en not_active Abandoned
- 1999-02-08 JP JP3064299A patent/JPH11342000A/en active Pending
- 1999-02-08 EP EP99300900A patent/EP0935210A3/en not_active Ceased
-
2001
- 2001-12-21 US US10/028,748 patent/US20020150932A1/en not_active Abandoned
-
2006
- 2006-07-18 US US11/489,292 patent/US20070067111A1/en not_active Abandoned
-
2012
- 2012-09-25 US US13/626,773 patent/US20130169645A1/en not_active Abandoned
Patent Citations (3)
| Publication number | Priority date | Publication date | Assignee | Title |
|---|---|---|---|---|
| US4845653A (en) * | 1987-05-07 | 1989-07-04 | Becton, Dickinson And Company | Method of displaying multi-parameter data sets to aid in the analysis of data characteristics |
| EP0561241A2 (en) * | 1992-03-20 | 1993-09-22 | International Business Machines Corporation | An interactive graphical method for analyzing many-dimensional data sets |
| WO1997027317A1 (en) * | 1996-01-23 | 1997-07-31 | Affymetrix, Inc. | Nucleic acid analysis techniques |
Non-Patent Citations (1)
| Title |
|---|
| WEINSTEIN JOHN N ET AL: "An information-intensive approach to the molecular pharmacology of cancer" SCIENCE, AMERICAN ASSOCIATION FOR THE ADVANCEMENT OF SCIENCE,, US, vol. 275, no. 5298, 17 January 1997 (1997-01-17), pages 343-349, XP002199806 ISSN: 0036-8075 * |
Cited By (15)
| Publication number | Priority date | Publication date | Assignee | Title |
|---|---|---|---|---|
| EP1146127A2 (en) * | 2000-03-27 | 2001-10-17 | Hitachi Software Engineering Co., Ltd. | Method for displaying gene experiment data |
| WO2001084139A1 (en) * | 2000-05-04 | 2001-11-08 | The Board Of Trustees Of The Leland Stanford Junior University | Significance analysis of microarrays |
| US7363165B2 (en) | 2000-05-04 | 2008-04-22 | The Board Of Trustees Of The Leland Stanford Junior University | Significance analysis of microarrays |
| EP1277103A4 (en) * | 2000-08-22 | 2007-08-08 | Affymetrix Inc | System, method, and computer software product for linked window interfaces |
| EP1277103A2 (en) * | 2000-08-22 | 2003-01-22 | Affymetrix, Inc. | System, method, and computer software product for linked window interfaces |
| US7992098B2 (en) | 2000-08-22 | 2011-08-02 | Affymetrix, Inc. | System, method, and computer software product for linked window interfaces |
| EP1328880A1 (en) * | 2000-10-12 | 2003-07-23 | Iconix Pharmaceuticals, Inc. | Interactive correlation of compound information and genomic information |
| US7054755B2 (en) | 2000-10-12 | 2006-05-30 | Iconix Pharmaceuticals, Inc. | Interactive correlation of compound information and genomic information |
| EP1328880A4 (en) * | 2000-10-12 | 2004-12-15 | Iconix Pharm Inc | Interactive correlation of compound information and genomic information |
| EP1314787A3 (en) * | 2001-11-26 | 2004-01-07 | Kudoh, Norio | The Midkine gene is associated with cancer |
| JP2006514554A (en) * | 2002-11-21 | 2006-05-11 | ワイス | Diagnosis of renal cell carcinoma and other solid tumors |
| EP1588142A2 (en) * | 2002-11-21 | 2005-10-26 | Wyeth | Methods for diagnosing rcc and other solid tumors |
| EP1588142A4 (en) * | 2002-11-21 | 2007-10-31 | Wyeth Corp | Methods for diagnosing rcc and other solid tumors |
| US7588892B2 (en) | 2004-07-19 | 2009-09-15 | Entelos, Inc. | Reagent sets and gene signatures for renal tubule injury |
| US7467118B2 (en) | 2006-01-12 | 2008-12-16 | Entelos Inc. | Adjusted sparse linear programming method for classifying multi-dimensional biological data |
Also Published As
| Publication number | Publication date |
|---|---|
| US20020015948A1 (en) | 2002-02-07 |
| US6420108B2 (en) | 2002-07-16 |
| US20020150932A1 (en) | 2002-10-17 |
| US20070067111A1 (en) | 2007-03-22 |
| US20130169645A1 (en) | 2013-07-04 |
| JPH11342000A (en) | 1999-12-14 |
| CA2259887A1 (en) | 1999-08-09 |
| EP0935210A3 (en) | 2002-11-20 |
Similar Documents
| Publication | Publication Date | Title |
|---|---|---|
| EP0935210A2 (en) | Computer aided visualisation of expression comparison | |
| Waylen et al. | From whole-mount to single-cell spatial assessment of gene expression in 3D | |
| JP3776728B2 (en) | Gene expression and evaluation system | |
| US6600996B2 (en) | Computer-aided techniques for analyzing biological sequences | |
| EP1019536B1 (en) | Polymorphism detection utilizing clustering analysis | |
| Rosa et al. | VAMP: visualization and analysis of array-CGH, transcriptome and other molecular profiles | |
| US20020179097A1 (en) | Method for providing clinical diagnostic services | |
| CN102084366A (en) | A medical analysis system | |
| WO2021163630A1 (en) | Systems and methods for joint interactive visualization of gene expression and dna chromatin accessibility | |
| JP4557609B2 (en) | How to display splice variant sequence mapping | |
| US6994965B2 (en) | Method for displaying results of hybridization experiment | |
| WO2018088635A1 (en) | Detection of cancer-specific diagnostic markers in genome | |
| US20030220748A1 (en) | Computer-aided techniques for analyzing biological sequences | |
| EP1632579A2 (en) | Computer-aided techniques for analyzing biological sequences | |
| DATA | A thesis submitted in conformity with the requirements for the degree of Master of Science Graduate Department of Computer Science | |
| Mariani et al. | Microarray Techniques and Data in Asthma/Chronic Obstructuve Pulmonary Disease |
Legal Events
| Date | Code | Title | Description |
|---|---|---|---|
| PUAI | Public reference made under article 153(3) epc to a published international application that has entered the european phase |
Free format text: ORIGINAL CODE: 0009012 |
|
| AK | Designated contracting states |
Kind code of ref document: A2 Designated state(s): AT BE CH CY DE DK ES FI FR GB GR IE IT LI LU MC NL PT SE |
|
| AX | Request for extension of the european patent |
Free format text: AL;LT;LV;MK;RO;SI |
|
| PUAL | Search report despatched |
Free format text: ORIGINAL CODE: 0009013 |
|
| AK | Designated contracting states |
Kind code of ref document: A3 Designated state(s): AT BE CH CY DE DK ES FI FR GB GR IE IT LI LU MC NL PT SE |
|
| AX | Request for extension of the european patent |
Free format text: AL;LT;LV;MK;RO;SI |
|
| 17P | Request for examination filed |
Effective date: 20030519 |
|
| AKX | Designation fees paid |
Designated state(s): AT BE CH CY DE DK ES FI FR GB GR IE IT LI LU MC NL PT SE |
|
| STAA | Information on the status of an ep patent application or granted ep patent |
Free format text: STATUS: THE APPLICATION HAS BEEN REFUSED |
|
| 18R | Application refused |
Effective date: 20071126 |