BACKGROUND OF THE INVENTION
Field of the invention
-
The present invention relates to an object tracking system.
The present invention relates to an object infrastructure provided with an object tracking system.
The present invention further relates to a method for tracking objects.
Related Art
-
In "Measuring Traffic", Statistical Science, 2007, Vol. 22, No. 4, pp. 581-597, Peter J. Bickel et al. describe a traffic performance measurement system, PeMS, that functions as a statewide repository for traffic data gathered by thousands of automatic sensors. It has integrated data collection, processing and communications infrastructure with data storage and analytical tools. This system provides for global information relating to the average traffic speed and the traffic density.
-
There is a need for a system that provides information relating to the state of individual traffic participants. This information can be used in advanced cruise controllers for traffic management or for access control for example.
SUMMARY OF THE INVENTION
-
The object tracking system according to the present invention comprises
- a plurality of sensor nodes that each provide a message indicative for an occupancy status of a detection area of an object infrastructure monitored by said sensor node,
- a message interpretator including an object database facility with state information of objects present at the object infrastructure, and a database updating facility for updating the database facility on the basis of messages provided by the sensor nodes.
-
In the object tracking system according to the present invention objects can be tracked with relatively simple and cheap means. It is sufficient that the sensor nodes sense an occupancy state, i.e. whether a detection area associated with the sensor node is occupied by an object or not and that they merely provide a message that indicates whether the occupancy state is changed. The relatively cheap and simple construction of the sensor nodes contributes to an economically feasible application in object tracking systems for large object infrastructures. Optionally, the message may additionally include the value of the occupancy state after the change was detected.
-
In an embodiment the database update facility comprises
- an association facility for associating the messages provided by the sensor nodes with the state information present in the object data base facility,
- a state updating facility for updating the state information on the basis of the messages associated therewith.
The association facility selects for which state information the received messages are relevant, and provides the selected messages to the state updating facility. In this way the state updating facility can operate more efficiently, than in case no selection takes place.
-
The present invention is in particular suitable for tracking vehicles. For these objects, suitable sensor elements to be used in the sensor nodes are for example magneto restrictive sensors. These sensors determine whether their associated detection area is occupied by detection of a perturbation of the earth magnetic field. Alternatively, magnetic loop sensors, may be used, which detect a change of inductance caused by the presence of ferromagnetic material.
-
Preferably each sensor node is provided with a wireless transmission facility that transmits the preprocessed data, e.g. the occupance status or an indication of a change thereof to a data to a receiver facility coupled to the message interpreter. The absence of wiring towards the message interpreter makes the installation easier and cost effective. Furthermore it is attractive if the sensor nodes provide their message at an event basis, e.g. if a perturbation of the earth magnetic field exceeds a threshold value. This reduces communication load of the message interpreter and minimizes power consumption of the sensor nodes.
In an embodiment a set of sensor elements may be clustered in a sensor module. For example the sensor module may be a camera that monitors a part of the object infrastructure, wherein each photosensitive element of the camera serves as a sensor element of the object tracking system. A camera may be used for example if a perturbation of the earth magnetic field can not be measured. This is the case for example if (parts of) the infra structure comprises metal components e.g. a bridge. It is not necessary that the detection areas of the sensor elements are complementary. The detection areas may overlap, or spaces may exist between the detection areas, but it is required that the detection area of the sensor be smaller than the object to be tracked. Ideally the sensor elements are point detectors.
-
The sensor nodes can be either randomly distributed over the object infrastructure or placed in a pattern optimized for the object tracking problem in hand.
-
In an embodiment the object tracking system comprises a plurality of system modules, each module comprising a respective subset of the plurality of sensor nodes for monitoring a respective section of the object infrastructure and a respective message interpreter, the object tracking system has a communication facility for enabling system modules of mutually neighboring sections to exchange state and detection information. In this way the object tracking system can be easily expanded if required. A new system module need only to communicate with the system modules arranged for neighboring sections. Neighboring sections may be arranged in one dimensional scheme, e.g. in case of a narrow road. For example if a certain road is already provided with an object tracking system, it is sufficient to provide for a communication facility between the system module for the last section of said object tracking system and the new system module for the appended section. In case of infrastructures for unconstrained object movements the new module may communicate with other modules neighboring in various directions. As the system modules merely need to exchange state information and object-detection information (i.e. the unprocessed sensor signals) in a limited subarea of the respective sections, the amount of communication between the system modules is modest resulting in a scalable object tracking system.
-
The association facility associates the messages provided by the sensor nodes or neighboring system modules with the state information present in the object data base facility. In other words the association facility determines the probability that the detections are caused by a particular object for which state information is present in the object data base facility. If the messages cannot be associated with state information of an already identified object here or in the neighboring system module, a new entry may be added to the database. Alternatively, the entry for the new object may be added by a separate procedure. For example the object infrastructure may have an access with an object identification facility that provides for an identification of every object that enters the infrastructure.
-
The individual sensor nodes do not need to provide other information than an occupancy status of their associated detection area. However, optionally the sensor node may associate its own signal with a color, shape, or other signature of the tracked objects to facilitate or obviate association by the message interpreter. An association facility for associating the detection signals obtained on asynchronous basis with state information of a particular object may be based on one of the following methods.
- Gating,
- Nearest Neighbor (NN),
- (Joint) Probabilistic Data Association ((J)DPA),
- Multiple Hypothesis Tracker (MHT), and
- MCMCDA.
-
Gating comprises forming a gate around the predicted measurement of an object. The size and shape of the gate are chosen in such a way that unlikely messages are precluded to be associated with this particular object-track. The method determines a statistical, quadratic
distance from object i. A measurement y is associated with the state-vector x
oi of object i if
with G some constant threshold and
equal to:
Various methods can be used for finding the Threshold G. However, this data association method is not suitable for associating event based messages. Moreover problems arise when two gates overlap.
-
The Nearest Neighbor method also uses a gate, but it can handle overlapping gates. The sum of all possible combinations to associate a certain measurement to a certain track is analyzed. The chosen combination associates the most measurements to a track for a minimum sum of distances.
-
A (Joint) Probabilistic Data Association method is described in
Multitarget-Multisensor Tracking: Principles and Techniques. YBS, 1995, by Y. Bar-Shalom and R. Li, for example. The (Joint) Probabilistic Data Association methods (J)PDA is unsuitable for event-based sampling because it assumes that one target can give rise to at most one measurement and one measurement is a result of at most one object. This cannot be assumed with event based sampling. An extension to the JPDA can be found in
O. Songhwai, S. Sastry, and L. Schenato, "A Hierarchical Multiple-Target Tracking Algorithm for Sensor Networks," in Proc. of the 2005 IEEE International Conference on Robotics and Automation, Barcelona, Spain, 2005. Where the original JDPA assumes that a probability density function (PDF) of state-vector x
k+1|jk is a Gaussian function, in the extended JPDA the PDF can be a non-Gaussian function.
-
A Multiple Hypothesis Tracker (MHT) allows that the state-vector of a single object can has multiple tracks. This method resembles to the Particle filter as described in
B. Ristic, S. arulampalam, and N. Gordon, "Beyond the Kalman filter: Particle filter for tracking applications", 2002. Therein, each state is estimated by simulating N states with each a different probability. It is a drawback of this method that it requires a high computational power.
-
A further data association method is the Markov chain Monte Carlo data association (MCMCDA). All observations are used to classify and cluster them. To that end the whole set of observations is divided into a number of partitions represented by the set w. This is done nmc times resulting in nmc sets of w, i.e. possible partitions. The set of w with the highest probability, given the number of objects in the previous sample instant, is chosen and the state-vectors of the tracks a are updated according the partitioned observation. The computational time can be decreased by not using the total history of observations, but by using a moving horizon. A downside of this method is that each observation can belong to at most one object and, making this method unsuitable for event-based state-estimation.
-
Although these data association methods can be applied to associate messages obtained by (a) synchronous sampling, they are not suitable for association messages obtained by event-based sampling. For then the main issue with present association methods is that they assume either that one target results in at most one observation or that one observation comes from at most one object. According to a preferred embodiment of the present invention messages received from the sensor nodes are first associated with a particular object. In other words it is determined which object most probably caused the observation by the sensor resulting in the message. Subsequently the state of said object is (re-)estimated using that message. The estimation is based on the latest observation and the current state of the said object. The state of the object that is most probable in view of all available observations is calculated. The state of an object can also be estimated at a point in time later than the last message, but before a new message has arrived. In that case the error covariance matrix is bounded, as it is known that the state change of the object must be within the detection boundaries of the sensor node.
BRIEF DESCRIPTION OF THE DRAWINGS
-
These and other aspects are described in more detail with reference to the drawing. Therein:
- Figure 1 shows a first view of an embodiment of an object infrastructure provided with an object tracking system according to the invention,
- Figure 2 shows a second view of an embodiment of an object infrastructure provided with an object tracking system according to the invention,
- Figure 3 shows another view of an embodiment of an object tracking system according to the invention,
- Figure 4 schematically shows a part of the object infrastructure that is provided with a plurality of sensor nodes,
- Figure 5 schematically shows a signal flow in a sensor node,
- Figure 6 schematically shows a possible hardware implementation of a sensor node,
- Figure 7 shows a possible method carried out by a sensor node,
- Figure 8 shows a signal flow in a message interpreter,
- Figure 9 shows a possible hardware implementation of a message interpreter,
- Figure 10 shows neighboring infrastructure regions, with specially handled subregions marked ,
- Figure 11 shows an overview of a method carried out by the message interpreter,
- Figure 12 shows a first detail of the method of Figure 11,
- Figure 13 shows a second detail of the method of Figure 11,
- Figure 14 shows an example of an object to be detected at a reference position and orientation and at a different position and orientation,
- Figure 15 shows a definition of a set S and the equidistant sampled set Λ,
- Figure 16 shows detection of an object at multiple detection points,
- Figure 17 shows a definition of the set On of possible positions oi k for a single detection point,
- Figure 18 shows a definition of the set ON of possible positions oi k for multiple detection points,
- Figure 19 shows a derivation of ON(q ) given 2 detections and 2 different samples of q,
- Figure 20 shows (Left) determination of -Λ, (right) the object's possible position set ^On given dn and q,
- Figure 21 shows (left) the mean of all Gaussians from f(o|z1, θ) and f(o|z2, θ); (right) The selection of means of the Gaussians from f(o|z1, θ) and f(o|z2, θ), of which their mean ôni is close or in CN(θ ),
- Figure 22 shows an association result with event-based data-association,
- Figure 23 shows an association result with Nearest Neighbor data-association,
- Figure 24 shows time sampling of a signal y(t),
- Figure 25 shows event sampling of a signal y(t),
- Figure 26 shows event sampling: Send-on-Delta,
- Figure 27 shows the Gaussian function,
- Figure 28 shows a top view of the Gaussian function,
- Figure 29 shows an approximation of Λ Hke (yn ) as a sum of Gaussian functions,
- Figure 30 shows position, speed and acceleration of a simulated object,
- Figure 31 shows a position estimation error for various methods,
- Figure 32 shows a speed estimation speed for various methods,
- Figure 33 shows a factor of increase in estimation error after zke , or y ka .
DETAILED DESCRIPTION OF EMBODIMENTS
-
In the following detailed description numerous specific details are set forth in order to provide a thorough understanding of the present invention. However, it will be understood by one skilled in the art that the present invention may be practiced without these specific details. In other instances, well known methods, procedures, and components have not been described in detail so as not to obscure aspects of the present invention.
-
The invention is described more fully hereinafter with reference to the accompanying drawings, in which embodiments of the invention are shown. This invention may, however, be embodied in many different forms and should not be construed as limited to the embodiments set forth herein. Rather, these embodiments are provided so that this disclosure will be thorough and complete, and will fully convey the scope of the invention to those skilled in the art. In the drawings, the size and relative sizes of layers and regions may be exaggerated for clarity.
-
It will be understood that when an element or layer is referred to as being "on", "connected to" or "coupled to" another element or layer, it can be directly on, connected or coupled to the other element or layer or intervening elements or layers may be present. In contrast, when an element is referred to as being "directly on," "directly connected to" or "directly coupled to" another element or layer, there are no intervening elements or layers present. Like numbers refer to like elements throughout. As used herein, the term "and/or" includes any and all combinations of one or more of the associated listed items.
-
It will be understood that, although the terms first, second, third etc. may be used herein to describe various elements, components, and/or sections, these elements, components, and/or sections should not be limited by these terms. These terms are only used to distinguish one element, component or section from another element, component, and/or section. Thus, a first element, component, and/or section discussed below could be termed a second element, component, and/or section without departing from the teachings of the present invention.
-
Unless otherwise defined, all terms (including technical and scientific terms) used herein have the same meaning as commonly understood by one of ordinary skill in the art to which this invention belongs. It will be further understood that terms, such as those defined in commonly used dictionaries, should be interpreted as having a meaning that is consistent with their meaning in the context of the relevant art and will not be interpreted in an idealized or overly formal sense unless expressly so defined herein. All publications, patent applications, patents, and other references mentioned herein are incorporated by reference in their entirety. In case of conflict, the present specification, including definitions, will control. In addition, the materials, methods, and examples are illustrative only and not intended to be limiting.
-
Figure 1 and 2 show a first and a second view of an embodiment of an object infrastructure 80 provided with an object tracking system. The object infrastructure is intended to allow stationary and/or moving objects 70 thereon, e.g. a road or a parking place. The object infrastructure may be part of a public or private space, e.g. a recreational park.
-
The object tracking system comprises a plurality of sensor nodes 10 that each provide a message indicative for an occupancy status of a detection area of the object infrastructure monitored by said sensor node 10. As shown therein the sensor nodes are randomly distributed over the object infrastructure.
-
The object tracking system comprises a message interpretator MI, each comprising an object database facility, an association facility and a state updating facility. Each message interpretator is responsible for handling messages D from a respective section 80A, 80B, 80C, 80D of the object infrastructure 80.
-
Figure 3 is another schematic view of the object tracking system. Figure 3 shows how sensor nodes 10 transmit (detection) messages to a message interpreter MI in their neighborhood. The message interpreters MI may also communicate to each other via a communication channel 60 to indicate that an object crosses a boundary between their respective sections and to exchange a status of such an object. As shown in Figure 3, the object tracking comprises a plurality of system modules MD1, MD2, MD3. Although three modules are shown in this example, any number of system modules is possible, dependent on the application. For example for an isolated object infra structure, e.g. an intersection of roads a single module may be applicable, while on a long road thousands of modules may be present. Each module MD 1, MD2, MD3 comprises a respective subset of the plurality of sensor nodes 10 for monitoring a respective section of the object infrastructure and a respective message interpreter MI. The object tracking system further has a communication facility 60 for enabling system modules MD1, MD2, MD3 of mutually neighboring sections to exchange state information. In the embodiment shown, messages from the sensor nodes are directly transmitted to a message interpreter. Alternatively, the sensor nodes may form a network that routes the messages to the message interpreters. In that case the transmitters may have a short transmission range.
-
Figure 4 schematically shows a part of the object infrastructure that is provided with a plurality of sensor nodes j having position cj. The sensor nodes have a detection area with radius R. An object i is present at the infrastructure having a position (vi x, vi y). In this case if the object substantially covers the detection area the sensor node indicates that the detection area is occupied as indicated in gray. Otherwise the sensor node indicates that the detection area is not occupied (white). In practice the fraction of the detection area that should be covered before an occupied status is detected may deviate from the above-mentioned 50% depending on the type of object.
-
Figure 5 schematically illustrates the signal flow for the sensor node 10, having sensor element 12, a processing unit 14 (with memory), and a radio link 16.
-
The sensor element 12 is capable of sensing the proximity of the objects to be tracked. The processing unit 14 determines if an object is present or absent on the basis of the signals from the sensor element 12. If an occupancy status of the detection area of the sensor changes, the processing unit 14 initiates a transmission of a message D indicating the new occupancy status. In an alternative embodiment the message may include a time stamp indicative of the time t at which the new occupancy status occurred. Alternatively the sensor nodes may transmit occupancy status information on a periodical basis for example. However, an event-based transmission enables a lower power use. The message D sent should reach at least one message interpreter MI. A concrete implementation of the sensor node 10 is used for road object tracking: in this case the sensor element 12 is a magnetoresistive component, which measures the disturbance on the earth magnetic field induced by the objects. Alternatively, a magnetic rod or loop antenna may be used to detect the occupancy by an object..
-
Figure 6 shows a possible implementation of the hardware involved for the sensor node 10 of Figure 5. The sensor element 12 is coupled via an A/D converter 13 to a microcontroller 14 that has access to a memory 15, and that further controls a radio transmitter 16 coupled to an antenna 17.
-
Figure 7 schematically shows a method performed by a sensor node to generate a message indicative for occupancy status of a detection area of the sensor node.
-
Starting (Step S1: initialization) from an off-state of the sensor node, input from the A/D converter is received (Step S2). In a next step S3, offset is removed from the sensed value.
-
In step S4 it is determined whether the occupancy state of the detection area as reported by the last message transmitted by the sensor node was ON (object was alpresent in the detection range) or OFF (no object present in the detection range. This occupancy state is internally stored in the sensor node.
-
In the first case, program flow continues with step S5. In the second case processing flow continues with step S9. In step S5 it is determined whether a signal value v obtained from the A/D converter, and indicative for an occupied status of the detection area is below a first predetermined value TL. If this is not the case program flow continues with step S2. If however the value is lower than said first predetermined value then program flow continues with step S6. In step S6 it is verified whether the signal value v remains below the first predetermined value TL for a first predetermined time period. During step S6 the retrieval of input from the A/D convertor is continued. If the signal value v returns to a value higher then said predetermined value TL before the end of said predetermined time-period then processing flow continues with step S2. Otherwise the value for the occupancy state is internally saved as unoccupied in step S7, and a message signaling this is transmitted in step S8.
-
In step S9 it is determined whether the signal value v obtained from the A/D converter, and indicative for an occupied status of the detection area is above a second predetermined value TH. The second predetermined value TH is higher than the first predetermined value TL. If this is not the case program flow continues with step S2. If however the value is higher than said second predetermined value TH then program flow continues with step S10. In step S 10 it is verified whether the signal value v remains above the second predetermined value TH for a second predetermined time period, which may be equal to the first predetermined time period. During step S10 the retrieval of input from the A/D convertor is continued. If the signal value v returns to a value lower then said predetermined value TH before the end of said predetermined time-period then processing flow continues with step S2. Otherwise the value for the occupancy state is internally saved as occupied in step S11, and a message signaling this is transmitted in step S 12.
-
Figure 8 illustrates the signal flow in a message interpreter MI. As shown in more detail in Figure 8, a radio receiver 20 receives the binary "object present" signals D (optionally with timestamp) from the sensor nodes 10 via the radio link and runs a model based state estimator algorithm to calculate the motion states of the objects individually (i.e. each real world object is represented in the message interpreter). The sensor density may be chosen dependent on the required accuracy of the estimation. If a very accurate object tracking is desired multiple sensors per object area may be present.
-
The message interpreter MI has an object database facility 32, 34 that comprises state information of objects present at the object infrastructure.
-
The message interpreter MI further has a sensor map 45describing the spatial location of the sensor nodes 10. Alternatively, the sensor nodes may transmit their location, or their position could even be derived by a localization method for wireless sensor networks.
-
The message interpreter MI further has an association facility 40 for associating the messages D provided by the sensor nodes 10 with the state information present in the object data base facility 32, 34. The association facility 40 may associate the messages received with state information for example with one of the methods Gating, Nearest Neighbor (NN), (Joint) Probabilistic Data Association ((J)DPA), Multiple Hypothesis Tracker (MHT) and the MCMCDA.
-
The message interpreter further has a state updating facility 50 for updating the state information on the basis of the messages D associated therewith by the association facility 40. Once the messages D are associated with a particular object the state of that object in a local object data base is updated by the state updating facility 50.
-
The association facility 40 and the state updating facility 50 together form a database updating facility DBU.
-
In the embodiment shown a global map builder 65 may exchange this updated information with global map builders of neighboring message interpreters via network interface 60 (wired or wireless) and to receive close to border detections. Other uses are also possible (e.g. to calculate system level features like object density and average velocity, but these are independent from the motion state estimation). , to exchange the motion state of crossing objects.
-
A message interpreter MI, shown in Figure 9, consists of a radio receiver 20, coupled to antenna 22, a processing unit 24 (with memory 28) and a network interface 65, as well as a real-time clock 26. In other embodiments a real-time clock may be part of the sensor node, and the sensor node may embed a time-stamp indicative for time at which an event was detected in the message. However, generally a message interpreter will have a more reliable clock, as it can be more reliable synchronized with a reference clock. The network interface 65 couples the message interpreter MI via the communication channel 60 to other message interpreters.
-
In the embodiment shown the microcontroller 24 of Figure 9 processes the received messages D. The memory 28 stores the local and global object map and the sensor map as well as the software for carrying out the data association and state estimation tasks. In an alternative embodiment separate memories may be present for storing each of these maps and for storing the software. Likewise dedicated hardware may be present to perform one or more of these tasks.
-
There is no communication or any other interaction between the objects tracked. The result of the processing (i.e. the estimation of the motion states of all sensed objects) is present in the memory of the message interpreters in a distributed way.
Message interpreters may run additional (cooperative) algorithms to deduct higher level motion characteristics and/or estimate additional object characteristics (e.g. geometry).
-
For applications in relative small area, e.g. a parking place, the object tracking system may comprise only a single message interpreter MI. In that case the global map builder is superfluous, and local object map is identical to the global object map.
-
In the embodiment shown in Figure 3, each message interpreter MI for a respective module comprises hardware as described with reference to Figure 8 and 9.
-
Operation of the message interpreter is further illustrated with respect to Figures 10-13
-
Figure 10 schematically shows a part of an object infrastructure having sections Rj-1, Rj, Rj+1. By way of example it is presumed that an object moves in a direction indicated by arrow X from Rj-1, via Rj, to Rj+1.
-
Figure 11 shows an overview of a method for detecting the object performed by the message interpreter for section Rj, using the messages obtained from the sensor nodes.
-
In step S20 the method waits for a message D from a sensor node. At the moment that a message D is received, program flow continues with step S21, where the time t associated with the message is registered. The registered time t associated with the message may be a time-stamp embedded in the message or a time read from an internal clock of the message interpreter.
-
In step S22, it is verified whether the detection is made by a sensor node in a location of section Rj that neighbors one of the neighboring sections Rj-1 or Rj+1. If that is the case, then in step S23 the event is communicated via the communication network interface to the message interpreter for that neighboring section. In step S24 it is determined which object O in the object data base facility is responsible for the detected event. An embodiment of a method used to carry out step S24 is described in more detail in Figure 12. After the responsible object O is identified in Step 25, i.e. an association is made with existing object state information, it is determined in Step 26 whether it is present in the section Rj. If that is the case, control flow continues with Step S27. Otherwise control flow returns to step S20, where the state of obj ect O is estimated. A procedure for estimating the state is described in more detail with reference to Figure 13. In step S28 it is determined whether the state information implies that the object O has a position in a neighboring section Rj-1 or Rj+1. In that case the updated state information is transmitted in step S29 to the message interpreter for the neighboring section and control flow returns to step S20. Otherwise the control flow returns immediately to Step S20.
-
A method to associate a message D at time t, with an object O is now described in more detail with reference to Figure 12.
-
In a first step S40, an object index i is initialized (e.g. i=1). In a next step S41, the current state known for the object with that index i is retrieved from the object database facility. In the next step S42 a probability is determined that the object O caused the detection reported by the message D at time t. The object index i is incremented in step S43 and if it is determined in step S44 that i is less than the number of objects, the steps S41 to S43 are repeated. Otherwise in step S45 it is determined which object caused the detection reported by the message D at time t with the highest probability. In step S46 the index of that object is returned as the result if the method.
-
A method to estimate (update the present estimation of) the state of an object is now described in more detail with reference to Figure 13.
-
In step S60 the messages D1,...,Dn associated with object O are selected.
-
In step S61 a probability density function is constructed on the basis of the associated messages D1,...,Dn.
-
In step S62 the current state S0 and time to for object O is retrieved from the object database.
-
In step S63 it is determined whether the time for which the state S of the object O has to be determined is greater than the time to associated with the current state S0.
-
If that is the case, the state S (determined by the estimation method) is the state update of S0 to t, performed in step S65. If that is not the case, then the message D relates to a detection preceding the detection that resulted in the earlier estimation for state S0. In that case the state S0 is updated using the detection D by the state estimation method in step S64.
-
In the claims the word "comprising" does not exclude other elements or steps, and the indefinite article "a" or "an" does not exclude a plurality. A single component or other unit may fulfill the functions of several items recited in the claims. The mere fact that certain measures are recited in mutually different claims does not indicate that a combination of these measures cannot be used to advantage. Any reference signs in the claims should not be construed as limiting the scope. Further, unless expressly stated to the contrary, "or" refers to an inclusive or and not to an exclusive or. For example, a condition A or B is satisfied by any one of the following: A is true (or present) and B is false (or not present), A is false (or not present) and B is true (or present), and both A and B are true (or present).
-
More details relevant for the present invention are described in the following
Annexes:
- A1: Estimation and association for multiple target tracking based on spatially, distributed detections
- A2: On Event Based State Estimation
A1: Estimation and association for multiple target tracking based on spatially, distributed detections
-
Summary. In this paper we consider the multiple object tracking problem with event-based observations. For that we predefine a number detection points which are spatially distributed along the road. Whenever the edge of an object crosses one of the detection points, the position of that detection point together with the time of the event are received by our tracking algorithm. We assume that objects can cover multiple detection points and propose a method to estimate the object's position and orientation from these detections using the shape of the object. Beside that another method is designed which associates newly received detections with a known object. The objects are tracked with an event-based state-estimator that uses the estimated position and orientation, although its design is out of the scope of this paper. Finally our tracking algorithm is critically assessed in a simulation of a parking lot.
1 Introduction
-
In multiple target tracking [1-3] one aims to track all the objects/targets, which are moving in a certain area. Three basic problems arise from tracking objects. The first one is how to measure the object's position. The second one is to associate a certain measurement with its correct object and the third one is a state-estimator to keep track of all the objects. This paper considers the first 2 issues when objects are not measured but detected.
-
Consider a system in which objects are detected when they cross a predefined 'detection' point. These detectors are triggered by the event that the object's edge crosses its position. However, they cannot distinguish between the objects. This paper describes a method in which a new detection is associated with the object that most probable generated it. Also, a method is described which estimates the position and orientation of the object given the observations in position and time due to the detections. Other examples in which sensor-data is generated due to an event can be found in [4, 5].
-
This paper is organized as follows. Section 2 defines background knowledge such as the notation of (object) variables and functions that are used throughout this paper. After that the problem is formulated in section 3 together with existing methods. Section 4 describes the approach which is taken in the design. A more detailed description of the estimation and associated is presented in Section 5 and 6 respectively. Finally both methods are tested in a small application example presented in Section 6 and conclusions are drawn in section 7. But let's start with the background information.
2 Background
-
In order to be clear about notations and variables this section describes those that can be found throughout this paper.
2.1 Variables
-
defines the set of real numbers whereas the set
defines the non-negative real numbers.
defines the set spanned by the vectors
ex and
ey , the point
p :=
x·
ex +
y·
ey is shortly denoted as
p = (
x,
y)
T . The set
Z defines the integer values and
defines the set of non-negative integer numbers. The variable 0 is used either as null, the null-vector or the null-matrix. Its size will become clear from the context.
-
Vector
x(
t) ∈
is defined as a vector depending on time
t and is sampled using some sampling method. The time
t at sampling instant
k ∈
is defined as
tk ∈
. The variables τ
k ∈
,
xk ∈
and
x 0:k ∈
are defined as:
-
The matrix
A(
t2 -
t 1) ∈
depends on the difference between two time instants
t 2 >
t 1 and is shortly denotes as
A t2-t1
2.2 Functions
-
The transpose, inverse and determinant of a matrix
A ∈
are denoted as
AT ,
A -1 and |
A| respectively.
-
Let us define the probability of the random vector
x ∈
as the scalar
Pr(
x) ∈ {0,1} and the conditional probability of
x given the vector
u ∈
as the scalar
Pr(
x|
u) ∈ {0,1}. The probability density function (PDF), as defined in [6] section B2, of the vector
x ∈
is denoted as
p(
x) and the conditional PDF of
x given
u ∈
is denoted as
p(
x|
u). The expectation and covariance of
x are denoted as
E[
x] and
cov(
x) respectively. The conditional expectation of
x given a vector
u is denoted as
E[
x|
u|. The definitions of
E[x],
E[
x|
u] and
cov(
x) can be found in [6] sections B4 and B7.
-
The Gaussian function, shortly noted as Gaussian, depending on vectors
x ∈
and
u ∈
and on matrix
P ∈
is defined as:
-
If p(x) = G(x,u,P), then by definition it holds that E[x] = u and cov(x) = P.
-
Assume we have the set
⊂
and the vectors
x ∈
and
y ∈
. Then the function ∥
x -
y∥ ∈
is defined as the distance between vectors
x and
y. The function |(
x -
)| ∈
is defined as the shortest distance from vector
x to set
:
2.3 Object variables
-
Assume there exist an object which is moving in the 3D world space. This object is observed with, for example, a camera or sensors in the road. Meaning that the object is projected to a 2D space, i.e,
If we assume that the shape of the projected object is constant and known, then we can draw a smallest, rectangular box around the object.
-
For the box we define a position-vector
o = (
x,
y)
T ∈
, equal to the center of the box, and an orientation-vector θ ∈
. In the case of
o = 0 and θ = 0 the corners of this box, as shown in
Figure 14, are defined in the set
:
-
Notice that for an object having a certain
o and θ the new corner-positions of the object's box are calculated with
. For that a rotation matrix
T ∈
is used as defined in (5). An example of the object's box for a certain
o and θ is graphically depicted in
Figure 14.
-
Beside the positions
o and θ each object also has a certain shape or geometry which covers a certain set of positions in
, i.e. the grey area of
Figure 14. This closed set is denoted with
S ⊂
and is defined as the union of the open set of the object's body
SB ⊂
and the closed set of the object's edge S
E ⊂
, i.e.
S :=
SB ∪
SE . The set
S is approximated by a set of sampled position-vectors Λ = [λ
1,λ
2, ···, λ
K ], with λ
i ∈
. To define the vectors λ
i we equidistant sample the rectangular box defined by
using a grid with a distance
r. Each λ
i is a grid point within the set
S as graphically depicted in
Figure 15.
-
The aim is to estimate position, speed and rotation of the object in the case that its acceleration and rotational speed are unknown. Therefore the object's state-vector
s(
t) ∈
and process-noise
w(
t) ∈
are defined as:
-
Next the problem is formulated using this background knowledge.
3 Problem formulation
-
A total of
E objects are observed within the set
. The vectors
oi = (
xi ,
yi )
T and θ
i are the
ith object's position- and rotation-vector respectively.
Ti represents the
ith object's rotation-matrix dependent on θ
i . The dynamical process of object
i with state-vector
si , process-noise
wi and measurement-vector
mi is defined with the following state-space model:
with
The definition of the elements of state-vector
si (
t), also shown in
Figure 16, are:
-
The objects are observed in
by a camera or a network of sensors. For that
M 'detection' points are marked within
and collected in the set
D ⊂
. The position of a detection point is denoted as
d ∈
D. The
kth tection of the system generates the observation vector
if the edge of the
ith object covers one of the detection points
dk ∈
D at time
tk :
-
However, the system does not know which object was detected for it can be any object. As a result the system will not generate
but a general observation vector
zk ∈ {
,
}, which is yet to be associated with an object. Therefore, due to the
kth detection, the observation vector
zk is generated whenever one of the
E object covers a detection point
dk ∈
D at time
tk :
-
From equations (9) and (10) we conclude that
of (9) is the result after the received observation vector
zk (10) is associated with object
i. Notice that both definitions of
zk and
assume that the object's edge is detected exactly at a detection point
d. In reality the detection will be affected by noise. The object therefore has some probability to be detected at a position υ ∈
which is close to
d. This is modeled by defining that the object's position at the instant of the detection, i.e. υ, is a random vector with mean
d and covariance ε ∈
:
-
Figure 16 shows an example of object i which is detected by multiple detection points. The covariance ε of each detection point is also indicated.
-
The sampling method of the observation vectors
z 0:k s a form of event sampling [4, 5,7]. For a new observation vector is sampled whenever an event, i.e. object detection, takes place. With these event samples all
N objects are to be tracked. To accomplish that three methods are needed. The first one is the association of the new observation-vector
zk to an object
i and therefore denote it with
Suppose that all associated observation-vectors
are collected in the set
Then the second method is to estimate
from the observation-set
This is used in the third method, which is a state-estimator.
-
Present association methods are: Gating and Nearest Neighbor (NN) [2], (Joint) Probabilistic Data Association ((J)DPA) [2,8], Multiple Hypothesis Tracker (MHT) [9] and the MCMCDA [10]. Although these can be transformed for associating the event samples
z 0:k , this paper will show that the estimation of
results in a probability that
zk is in fact
i.e.
Therefore the problem which is covered in this paper is the estimation of
from the set
which also results in the probability
For that we assume that the shape of the object is known and that it is samples as shown in Section 2.3. The state-estimation is not covered in this paper, although it is used in the application example. Before going into the mathematical details of the estimation we will first describe the approach that is taken.
4 Approach measurement estimation
-
In the problem formulation we stated that
is defined as the set with all observation-vectors from
z 0:k that were associated with object
i. We will first redefine this set before continuing with the approach for estimating
-
The set
is defined as the set of all observation-vectors
zn which were associated with object
i,
from which their detection point is still covered by the object. We will first show how this is done. At time step k we have the observation-set
and the observation
zk was associated to object
i, i.e.
Now if the object's edge is detected at
dk for the first time, then
is added to the set
However, if the object's edge is detected at
dk for the second time, then
is not added to the set
and the vector
for which holds that
dn =
dk . is removed from
This because in the second case, it means that object
i drove off the detection point positioned at
dn = dk . Therefore
is defined as:
-
With this definition of
the approach for estimating
i.e.
is given. For clarity we assume that the object's shape is rectangular and that all its detection points are denoted with
dn , with
n ∈
N ⊂ [0,
k].
- 1. The first step is to position the object on each detection point dn and mirror its set S into the set On , as shown in Figure 17 for a single detection. This way we transform the points that are covered by the object, into possible vectors of the object's position given that it is detected at the detection point dn .
- 2. The second step, graphically depicted in Figure 18, is to turn all sets On simultaneously around their detection point dn . This way, each possible orientation of the object results in a corresponding possible object's position For must be inside all the sets On , ∀n ∈ N, and therefore thus inside the intersection of all sets On , ∀n ∈ N, which is denoted as ON .
-
Therefore if we apply these two steps for a number of orientations
then at each orientation we have a set
ON which has to contain the object's position
From all these orientations we can calculate
as shown in the next section.
5 Measurement estimation
-
Estimation of the measurement-vector
given the observation set
results in calculating
Because both
and
always belong to the same object and at sample instant k throughout this section we will remove the sub- and superscripts
i and
k in the rest of this section. Therefore we have;
and
The set
Z consists of the observation vectors
zn , for all
n ∈
N ⊂ [0,
k], that were associated to the same object.
-
Although the measurement vector is defined as
m = (
o, θ)
T , with
o ∈
and θ ∈
, the detection point at time-step
n are defined as
dn ∈
. Meaning that the objects orientation is not directly. However, because every observation vector
zn ∈
Z detects the object for one and the same θ, the PDF
p(
m|
Z) is approximated by sampling in θ, i.e.:
with
-
The main aspect of equation (13a) is to determine
p(
o|
z, θ). To do that we define the set
On (θ) ∈
to be equal to all possible object positions
o, given that the object is detected at position
dn ∈
zn (∈
Z) and that the object's rotation is equal to θ. The determination of
On (θ) ∈
is presented in the n the next section. Therefore, if one object is detected at multiple detection points
dn , ∀
n ∈
N, then the set of all possible object positions
o given a certain θ equals
On (θ):
-
Equation (14) is graphically explained in Figure 19 for two different values of θ and N = {1,2}.
-
Both
p(
o|
Z, θ) and α
l are related to the set
ON (θ) due to the fact that it
ON (
thet a) defines the set of possible object positions
o for a given θ. To calculate
p(
o|
Z, θ) and α
l we define the functions
f(
o|
Z, θ) and
g(
o|
Z, θ):
-
Therefore the PDF
p(
o|
Z, θ) and probability α
l are:
-
With (16) both p(m|Z) is calculated according to (13). The rest of this section is divided into two parts. The first part derives the probability function based on a single detection, i.e. f(o|zn , θ). While the second part derives the probability function based on a multiple detections, i.e. g(o|Z, θ).
5.1 Single event detection
-
In order to derive
f(
o|
zn , θ) we will use the set Λ, defined in 2.3, which contains the sampled positions λ
i that are covered by the object if
o = 0 and θ = 0. Notice that if the object covers the origin, i.e. (
x,
y)
T = 0, then the possible values of the object position
o are given by the set -Λ. This is graphically depicted in
Figure 20 (left). From that we can conclude that if the object covers the detection point
dn , given a certain orientation θ and rotation-matrix
T, the sampled set Λ can be transformed into a sampled set of
On , denoted with
Ôn :
-
Figure 20 (right) graphically depicts the determination of Ôn from the set Λ for a given θ and detection point dn .
-
The function
f(
o|
zn , θ), as defined in (15), is approximated by placing a Gaussian function at each sampled position
ôi ∈
Ôn with a certain covariance dependent on the grid-size
r:
with,
-
The approximation of (18) assumes that the object is detected exactly at
dn . In
Section 3 we stated that the detection can be a bit of a detection point. The PDF that the object is detected at position υ ∈
given the detection point
dn is defined in (11). Inserting this uncertainty into (18) results in the final f(
o|
zn , θ):
-
Equation (19) is solved with the following Proposition and the fact that
G(
x,
a +
b,
C) =
G(
x-
b,
a,
C):
Proposition 1.
Let there exist two Gaussian functions of the random vectors x ∈
and m ∈
and the matrix Γ ∈
;
G(
x,
u, U)
and G(
m,Γx
,M).
Then they have the following property:
-
Proof. The proof can be found in
Section 9.
-
Applying
Proposition 1 to (19) results in:
-
From f(o|zn , θ) based on a single detection, the next step to multiple detections, i.e. g(o|Z, θ), is taken.
5.2 Multiple event detections
-
The aim of this section is to calculate the function
g(
o|
Z, θ) by substituting equation (21) in the definition of
g(
o|
Z, θ) as shown in (15):
-
If N contains m elements, then calculating equation (22) would result in Km products of m Gaussian functions and sum them afterwards. This would take too much processing power if m is large. That is why equation (22) is calculated differently.
-
Instead of using all detection points
dn we will use a subset of them. The derivation of this subset is graphically depicted in
Figure 21 for
N = {1,2}. For that consider the rectangular set
∈
of Section 2.3 defined by its corners [
c 1,
c 2,
c 3,
c 4]. For each detection point
dn we define the set
(θ) ⊂
with corner-points [
c n1(θ),
c n2(θ),
c n3(θ),
c n4(θ)] defined as:
-
Let us define the rectangular set
(θ) ⊂
as the intersection of the sets
(θ), ∀
n ∈
N, i.e.:
-
Meaning that each detection point
dn defines a rectangular set denoted with
(θ) dependent on rotation θ. The intersection of all these rectangular sets is defined with the set
(θ).
-
In the beginning of this section we defined two different sets shown in
Figure 17 and 18. The first set,
On (θ),shown in
Figure 17 defines all possible objet positions
o based on a single detection at
dn . The second set, i.e.
ON (θ),shown in
Figure 18, defines all possible object positions
o based on all detections at
dn, ∀
n ∈
N. Notice that as a result
On (θ) ⊂
(θ) and
ON (θ) ⊂
CN (θ). Meaning that only within the set
(θ) all the functions
f(
o|
zn , θ) have an overlapping area in which they are 1. Outside
(θ) there is always at least one
f(
o|
zn , θ) which is 0 and therefore makes
g(
o|
Z, θ) outside C
N (θ) equal to 0. Therefore
g(
o|
Z, θ) of (22) can be approximated by taking only those Gaussians of the functions
f(
o|
zn, θ) into account of which their mean, i.e.
is close or in the set
(θ). We define that close to
(θ) means a distance of at most γ+ε, which defined
R in (21). The function
g(
o|
Z, θ) of (22) is therefore approximated as:
with
We can even decrease the number of Gaussians of (25) even further. This because if for a certain detection point
dn it holds
(θ) ⊂
On (θ), it means that when we remove the detection point
dn it will not affect the set
(θ). Therefore equation (25) is reduced to:
with
-
The calculation of (26) is done by applying the following two propositions. The first one, i.e. Proposition 2, shows how to rewrite a product of a summation of Gaussians into a summation of a product of Gaussians. The second one, i.e. Proposition 3, proofs that a product of Gaussians results in a single Gaussian.
Proposition 2. The product of a summation of Gaussians can be written into a summation of a product of Gaussian:
-
The proof is given by writing out the left hand side of (27a) and restructuring it.
Proposition 3. The product of Gaussians is again a Gaussian:
-
The proof is given in
Section 10.
-
Now applying
Propositions 2 and 3 on (26) results in a solution of
g(
o|
Z, θ) as a summation of Gaussians of the form:
Equation (29) is approximated as a single Gaussian function:
-
With the result of (30) we can approximate
g(
o|
Z, θ). In order to calculate the PDF
p(
m|
Z), equation (30) is substituted into equation (16) together with
g(
o|
zn , θ) of (21) to calculate
p(
o|
Z, θ) and α
l . Substituted these results into (13) gives:
-
As was mentioned in the problem formulation, the PDF p(m|Z) also gives us the probability that a new observation vector is generated by an certain object i. This is discussed in the next section.
6 Detection association
-
The total probability that a new observation vector
zk is generated by object i is equal to the total probability of the measurement-vector
given the observation set
For this probability we can use
which is equal to equation (31). The definition of a PDF is that its total probability, i.e. its integral from -∞ to ∞, is equal to 1. To make sure that
of equation (31) has a total probability of 1, it is divided by its true probability
In order to be able to compare these different measurement-vector per object, we normalize each probability with the surface covered by the object. As a result,
is equal to:
-
The variables γ
i and
Ki are equal to γ and
K respectively, which define the approximation of the function
as shown in (18). With the probability of (32) one can design a method which associates an observation-vector due to a new detection, to its most probable object i. Although the estimation method requires a certain amount of processing power, one can reduce this by reducing the number of samples in the set Λ. Meaning that association and estimation can be done with different sizes of Λ. Moreover, if the objects have a rectangular shape, then with some tricks one can reduce the amount of processing power to a level at which both association as well as estimation can run real-time.
-
Now that both the measurement estimation as well as the detection association are designed, both are tested in a multiple object tracking application.
7 Application example
-
As an application example we take a parking lot of 50 by 50 meters with a network of wireless sensors distributed randomly along the road's surface. Each sensor can detect a crossing vehicle. A total of 2500 sensors was used resulting in a density of one sensor per square meter. The vehicles are all assumed rectangular shaped objects with a length of 5 meters and a width of 2 meters. A total of 4 vehicles manoeuvre within the parking lot and are tracked using a data-associator followed with an event state-estimator.
-
The simulation case is made such that it contains two interesting situation. One in which two vehicles cross each other in parallel and one where two vehicles cross perpendicular. For comparison the objects are tracked using two different association methods. The first one is a combination of Gating and detection association of 6. The second one is a combination of Gating and Nearest Neighbor.
-
The result of the detection associator (DA) for both crossings is shown in Figure 22 while the result of the Nearest Neighbor (NN) associator is shown in Figure 23. In both results the real object is plotted in a thick, solid line while its estimated one is plotted in a thin, solid line. The associated detections of each object are given with a symbol which is different for each object; '□' if associated with vehicle 1, '○' if associated with vehicle 2, '∇' if associated with vehicle 3 and '*' if associated with vehicle 4. Figure 22 shows with the DA all detections were correctly associated to the one object, while If NN is used as an association method,we see that a lot of incorrect associated detections. Therefore we can concluded that using the detection association of 6 results in less estimation-error compared to NN.
-
A second simulation is done to compare the percentage of incorrect associated detections. Again for the both DA as well as NN only now 4 different amount of detection points were used: 3000, 2500, 2000 and 1500. This table shows that the detection association has a better performance compared to Nearest Neighbor.
Table 1. Percentage of incorrect association | amount of detection points | DA | NN |
| 3000 | 0 % | 4.5 % |
| 2500 | 0 % | 5.6 % |
| 2000 | 0 % | 7.8 % |
| 1500 | 0 % | 2.2 % |
8 Conclusions
-
This paper presents a method for estimating the position- and rotation-vector of objects from spatially, distributed detections of that object. Each detection is generated at the event that the edge of an object crosses a detection point. From the estimation method a detection associator is also designed. This association method calculates the probability that a new detection was generated by an object i.
-
An example of a parking lot shows that the detection association method has no incorrect associated detections in the case that two vehicles cross each other both in parallel as well as orthogonal. If the association method of Nearest Neighbor was used, a large amount of incorrect associated detections were noticed, resulting in a higher state-estimation error.
-
The data-assimilation can be further improved with two adjustments. The first one is replacing the set S with SE only at the time-instants that the observation vector is received. The second improvement is to take the detection points that have not detected anything also in account.
References
-
- 1. A. Poore and S. Gadaleta, "Some assignment problems arising from multiple target tracking," Mathematical and Computer Modelling, vol. 43, pp. 1074-1091, 2006.
- 2. Y Bar-Shalom and R. Li, Multitarget-Multisensor Tracking: Principles and Techniques. YBS, 1995.
- 3. S. Blackman and R. Popoli, Design and Analysis of Modern Tracking Systems. Artech House, Norwood, MA, 1999.
- 4. V. Nguyen and Y Suh, "Improving estimation performance in Networked Control Systems applying the Send-on-delta transmission method," Sensors, vol. 7, pp. 2128-2138, 2007.
- 5. K. Åström and B. Bernhardsson, "Comparison of Riemann and Lebesque sampling for first order stochastic systems," in 41st IEEE Conference on Decision and Control, Las Vegans, Nevada, USA, 2002.
- 6. N. Johnson, S. Kotz, and A. Kemp, Univariate discrete distributions. JOHN WILEY and SONS, Inc, 1992.
- 7. M. Miskowicz, "Send-on-dalta concept: an event-based data-reporting strategy" Sensors, vol. 6, pp. 49-63, 2006.
- 8. R. Karlsson and F. Gustafsson, "Monte Carlo data association for multiple target tracking," in IEE International Seminar on Target Tracking: Algorithms and Applications, 2001.
- 9. B. Ristic, S. arulampalum, and N. Gordon, Beyond the Kalman filter: Particle filter for tracking applications, 2002.
- 10. O. Songhwai, S. Sastry, and L. Schenato, "A Hierarchical Multiple-Target Tracking Algorithm for Sensor Networks," in Proc. of the 2005 IEEE International Conference on Robotics and Automation, Barcelona, Spain, 2005.
- 11. K. Mardia, J. Kent, and J. Bibby, Mutlivariate analysis. Academic press, Inc. London, 1979.
- 12. D. Kelly, Introduction to probability. Macmillan Publishing Company,1994.
- 13. H. Durant-Whyte, B. Rao, and H. Hu, "Towards a fully decentralized architecture for multisensor data fusion," in 1990 IEEE Int. Conf. on Robotics and Automation, Cincinnati, Ohio, USA, 1990, pp. 1331-1336.
9 Proof of Proposition 1
-
Proof. Defined are two Gaussian functions with the vectors
x ∈
,
u ∈
,
m ∈
and matrices
U ∈
,
M ∈
, Γ ∈
:
G(x,
u,
U) and
G(
m,Γ
x,M). Suppose we define the following PDFs and relation of
m with some
c ∈
:
Then from probability theory [6]
p(
m) is equal to:
-
Applying theorem 3.2.1 of [11] on (33b) we have that
p(Γ
x) =
G(Γ
x,Γ
u,Γ
UΓ
T ). Now if we have the random vectors
a ∈
and
b ∈
with
p(
a) =
G(
a,
u 1,
U 1) and
p(
b) =
G(
b,
u2 ,
U 2) then they have the property
p(
a +
b) =
G(
a +
b,
u 1 +
u 2,
U 1 + U 2) as proven in [12]. Applying this on (33a) results in:
10 Proof of Proposition 3
-
Proof. A product of Gaussians can be written as:
-
From
Proposition 1 and the Kalman filter in Information form [13], a product of 2 Gaussians equals:
with
-
Applying (37) on (36b), together with the fact that
G(
x,y,Z) =
G(
y,x,Z) we have:
-
Equation (38) is equal to (28) for:
A2: On Event Based State Estimation
-
Summary. To reduce the amount of data transfer in networked control systems and wireless sensor networks, measurements are usually taken only when an event occurs, rather that at each synchronous sampling instant. However, this complicates estimation and control problems considerably. The goal of this paper is to develop a state estimation algorithm that can successfully cope with event based measurements. Firstly, we propose a general methodology for defining event based sampling. Secondly, we develop a state estimator with a hybrid update, i.e, when an event occurs the estimated state is updated using measurements; otherwise the update is based on the knowledge that the monitored variable is within a bounded set used to define the event. A sum of Gaussians approach is employed to obtain a computationally tractable algorithm.
1 Introduction
-
Different methods for state estimation have been introduced during the last decades. Each method is specialized in the type of process, the type of noise or the type of system architecture. In this paper we focus on the design of a state estimator that can efficiently cope with event based sampling. By even sampling we mean that measurements are generated only when an a priori defined event occurs in the data monitored by sensors. Such an effective estimator is very much needed in both networked control systems and wireless sensor networks (WSNs) [1]. Especially in WSNs, where the limiting resource is energy, data transfer and processing power must be minimized. The existing estimators that could be used in this framework are discussed in Section 4. For related research on event based control, the interested reader is referred to the recent works [2], [3].
-
The contribution of this paper is twofold. Firstly, we introduce a general mathematical description of event based sampling. We assume that the estimator does not know when new measurements are available, which usually results in unbounded eigenvalues of its error-covariance matrix. To obtain an estimator with a bounded error-covariance matrix, we develop an estimation algorithm with hybrid update, which is the second main contribution. The developed event based estimator is updated both when an event occurs, with received measurements, as well as at sampling instants synchronous in time. Then the update is based on the knowledge that the monitored variable is within a bounded set used to define the event. In order to meet the requirements of a low processing power, the proposed state estimator is based on the Gaussian sum filter [4, 5], which is known for its computational tractability.
2 Background notions and notation
-
R defines the set of real numbers whereas the set
defines the non-negative real numbers. The set Z defines the integer numbers and
defines the set of non-negative integer numbers. The
notation 0 is used to denote either the null-vector or the null-matrix. Its size will become clear from the context.
-
A vector
x(
t) ∈
is defined to depend on time
t ∈
and is sampled using some sampling method. Two different sampling methods are discussed. The first one is time sampling in which samples are generated whenever time
t equals some predefined value. This is either synchronous in time or asynchronous. In the synchronous case the time between two samples is constant and defined as
ts ∈
. If the time
t at sampling instant
ka ∈ is defined as
tka , with
t 0a := 0, we define:
-
The second sampling method is event sampling, in which samples are taken when an event occurred. If
t at event instant
ke ∈ Z
+ is defined as
tke , with
t 0e := 0, we define:
-
A transition-matrix
A t2-t1 ∈
is defined to relate the vector
u(
t 1) ∈
to a vector
x(
t 2) ∈
as follows:
-
The transpose, inverse and determinant of a matrix
A ∈
are denoted as
AT ,
A -1 and |
A| respectively. The
ith and maximum eigenvalue of a square matrix A are denoted as λ
i (
A) and λ
max (
A) respectively. Given that
A ∈
and
B ∈
are positive definite, denoted with
A ≻ 0 and
B ≻ 0, then
A ≻
B denotes
A - B ≻ 0.
A ≻ 0 denotes A is positive semi-definite.
-
The probability density function (PDF), as defined in [6] section B2, of the vector
x ∈
is denoted with
p(
x) and the conditional PDF of
x given
u ∈
is denoted as
p(
x|
u). The expectation and covariance of
x are denoted as
E[
x] and
cov(
x) respectively. The conditional expectation of
x given
u is denoted as
E[
xl
u]. The definitions of
E[
x],
E[
x|
u] and
cov(
x) can be found in [6] sections B4 and B7.
-
The Gaussian function (shortly noted as Gaussian) of vectors
x ∈
and
u ∈
and matrix
P ∈
is defined as
G(
x,u,P) :
×
×
→
, i.e.:
-
If p(x) = G(x,u,P), then by definition it holds that E[x] = u and cov(x) = P.
-
The element-wise Dirac-function of vector
x ∈
, denoted as δ(
x) :
→ {0,1}, satisfies:
-
For a vector
x ∈
and a bounded Borel set [7]
Y ⊂
, the set PDF is defined as
AY (
x) :
→ {0,
v} with
v ∈
defined as the Lebesque measure [8] of the set
Y, i.e.:
3 Event sampling
-
Many different methods for sampling a vector
y(
t) ∈
can be found in literature. The one mostly used is time sampling in which the
sampling instant is defined at time
tka =
t ka-1 + τ
ka-1 for some τ
ka-1 ∈
. Recall that if
y(
t) is sampled at
ta it is denoted as
yka . This method is formalized by defining the observation vector
z ka-1 =
at sampling instant
k a-1. Let us define the set
Hka (
z ka-1) ⊂
containing all the values that
t can take between
t ka-1 and
t ka-1 + τ
ka-1, i.e.:
-
Then time sampling defines that the next sampling instant, i.e.
ka , takes place whenever present time
t exceeds the set
Hka (
z ka-1)· Therefore
Zka is defined as:
-
In the case of synchronous time sampling τ
ka =
ts, ∀
ka ∈
, which is graphically depicted in
Figure 24. Notice that with time sampling, the present time
t specifies when samples of
y(
t) are taken, but time
t itself is independent of
y(
t). As a result
y(
t) in between the two samples can have any value within
. Recently, asynchronous sampling methods have emerged, such as, for example "Send-on-Delta" [9,10] and "Integral sampling" [11]. Opposed to time sampling, these sampling methods are not controlled by time
t, but by
y(
t) itself.
-
Next, we present a general definition of event based sampling, which recovers the above mentioned asynchronous methods, for a particular choice of ingredients. Let us define the observation vector at sampling instant
ke -1 as
With that we define the following bounded Borel set in
time-measurement-space, i.e.
Hke (Z
ke-1 ,t) ⊂
, which depends on both
Z ke-1 and
t. In line with time sampling the next event instant, i.e.
ke , takes place whenever
y(
t) leaves the set
Hke (
Z ke-1,
t) as shown in
Figure 25 for
q = 2. Therefore
zke is defined as:
The exact description of the set
Hke (
Z ke-1, t) depends on the actual sampling method. As an example
Hke (
z ke-1,
t) is derived for the method "Send-on-Delta", with
y(
t) ∈
. In this case the event instant
ke occurs whenever |
y(
t) -
y ke-1| exceeds a predefined level Δ, see
Figure 26, which results in
Hke (
z ke-1,
t) = {
y ∈
|
- Δ <
y -
y ke-1 < Δ}.
-
In event sampling, a well designed Hke (z ke-1,t) should contain the set of all possible values that y(t) can take in between the event instants ke - 1 and Ke . Meaning that if t ke-1 ≤ t < tke , then y(t) ∈ Hke (z ke-1,t). A sufficient condition is that y ke-1 ∈ Hke (z ke-1,t), which for "Send-on-Delta" results in y(t) ∈ [y ke-1-Δ1 y e-1 + Δ] for all t ke-1 ≤ t < tke .
4 Problem formulation: State estimation based on event sampling
-
Assume a perturbed, dynamical system with state-vector
x(
t) ∈
, process-noise
w(
t) ∈
, measurement-vector
y(
t) ∈
and measurement-noise
v(
t) ∈
. This process is described by a state-space model with
A τ ∈
,
B τ ∈
and
C ∈
. An event sampling method is used to sample
y(
t). The model of this process becomes:
with
-
The state vector
x(
t) of this system is to be estimated from the observation vectors
z 0e:ke . Notice that the estimated states are usually required at all synchronous time samples
ka , with
ts =
tka - t ka-1, e.g., as input to a controller that runs synchronously in time. As such our goal is to construct an event-based state-estimator (EBSE) that provides an estimate of
x(
t) not only at the event instants
tke but also at the sampling instants
t ka. Therefore, we define a new set of sampling instants
tn as the combination of sampling instants due to event sampling, i.e.
ke , and time sampling, i.e.
ka :
and
-
The estimator calculates the PDF of the state-vector
xn given all the observations until
tn . This results in a hybrid state-estimator, for at time
tn an event can either occur or not, which further implies that measurement data is received or not, respectively. In both cases the estimated state must be updated (not predicted) with all information until
tn . Therefore, depending on
tn a different PDF must be calculated, i.e.:
The important parameters for the performance of any state-estimator are the expectation and error-covariance matrix of its calculated PDF. Therefore, from (9) we define:
The PDFs of (9) can be described as the Gaussian
G(xn,x n|n, P n|n ). The square root of the eigenvalues of P
n|
n, i.e.
define the shape of this Gaussian function. Together with
x n|n they indicate the bound which surrounds 63% of the possible values for
xn . This is graphically depicted in
Figure 27 for the 1D case and
Figure 29 for a 2D case, in a top view. The smaller the eigenvalues λ
i(
P n|n ) are, the smaller the estimation-error is.
-
As such, the problem of interest in this paper is to construct a state-estimator suitable for the general event sampling method introduced in Section 3 and which is computationally tractable. Furthermore, it is desirable to guarantee that P n|n has bounded eigenvalues for all n.
-
Existing state estimators can be divided into two categories. The first one contains estimators based on time sampling: the (a)synchronous Kalman filter [12, 13] (linear process, Gaussian PDF), the Particle niter [14] and the Gaussian sum filter [4,5] (nonlinear process, non-Gaussian PDF). These estimators cannot be directly employed in event based sampling as if no new observation vector zke is received, then tn - tke → ∞ and λi(P n|ke-1) → ∞. The second category contains estimators based on event sampling. In fact, to the best of our knowledge, only the method proposed in [15] fits this category. However, this EBSE is only applicable in the case of "Send-on-Delta" event sampling and it requires that any PDF is approximated as a single Gaussian function. Moreover, the asymptotic property of P n|n is not investigated in [15].
-
In the next section we propose a novel event-based state-estimator, suitable for any event sampling method, together with a preliminary result on asymptotic analysis.
5 An event-based state estimator
-
The EBSE estimates
xn given the received observation vectors until time
tn . Notice that due to the definition of event sampling we can extract information of all the measurement vectors
y 0:n . For with
ti ∈ {
t 0:n } and
tje ∈ [
t 0e:ke ] it follows that:
-
Therefore, from the observation vectors
z 0e:ke and (11) the PDFs of the hybrid state-estimation of (9), with the bounded, Borel set
Yi ⊂
, results in:
-
For brevity (12a) is denoted as
p(
xn |
y 0:n ∈
Y 0:n ) and with Bayes-rule [16] yields:
-
To have an EBSE with low processing demand, multivariate probability theory [17] is used to make (13) recursive:
-
The calculation of p(x n|y0:n ∈ Y 0:n ) is done in three steps: 1. Assimilate p(yn ∈ Yn |x n) for both tn = tke and tn = tka . 2. Calculate p(xn |y 0:n ∈ Y 0:n ) as a summation of N Gaussians. 3. Approximate p(x n |y 0:n ∈ Y 0:n ) as a single Gaussian function. The reason for this last step is to design an algorithm in which p(x n |y 0:n ∈ Y 0:n ) is described by a finite set of Gaussians and therefore attain computational tractability. Notice that (13) gives a unified description of the hybrid state-eslimator, which makes an asymptotic analysis of the EBSE possible, as it will be shown later in this section.
5.1 Step 1: measurement assimilation
-
This section gives a unified formula of the PDF
p(
yn ∈ Y
n |
xn ) valid for both
tn =
tke and
tn =
tka . From multivariate probability theory [17] and (7b) we have:
-
The PDF
p(
yn ∈
Yn ) is modeled as a uniform distribution for all
yn ∈
Yn . Therefore, depending on the type of instant, i.e. event or not, we have:
-
Substitution of (16) into (15) gives that
p(
yn ∈
Yn |
x n) =
G(
yke ,
C xn, V) if
tn =
tke . However, if
tn =
tka then
p(
yn ∈
Yn |
xn ) equals Λ
Hke (
yn ), which is not necessarily Gaussian. Moreover, it depends on the set
Hke and therefore on the actual event sampling method that is employed. In order to have a unified expression of
p(
yn ∈
Yn |
xn ) for both types of
tn , independent of the event sampling method, Λ
Hke (
yn ) can be approximated as a summation of
N Gaussians, i.e.
This is graphically depicted in
Figure 29 for
yn ∈
. The interested reader is referred to [4] for more details.
-
Substituting (17) into (16) yields the following
p(
yn E
Yn |
xn ) if
tn =
tka :
Proposition 1. [12, 14]
Let there exist two Gaussians of random vectors x ∈
and m ∈
, with Γ ∈
:
G(
m,Γ
x,M)
and G(
x,u,U).
Then they satisfy:
Applying Proposition 1 ((19) to be precise) and
G(
x,y,Z) =
G(
y,
x,
Z) on (18) yields:
In conclusion we can state that the unified expression of the PDF
p(
yn ∈
Yn |
xn ), at both
tn =
tke and
tn =
tka, for any event sampling method results in:
If
tn =
tke the variables of (22) are:
N = 1,
and
the variables depend on Λ
Hke (
yn ) and its approximation. As an example these variables are calculated for the method "Send-on-Delta" with
y ∈
.
Example 1. In "Send-on-Delta", for certain
N, the approximation of Λ
Hke (
yn ), as presented in (17), is obtained with
i ∈ {1,2,...,
N} and:
With the result of (22),
p(
xn |
y 0:n ∈
Y 0:n ) can also be expressed as a sum of N Gaussians.
5.2 Step 2: state estimation
-
First the PDF
p(
xn |
y 0:n-1 ∈
Y 0:n-1) of (14b) is calculated. From the EBSE we have
p(
x n-1|
y 0:n-1 ∈
Y 0:n-1):=
G(
x n-1,
x n-1|n-1,
P n-1,n-1) and from (7a) with τ
n:=
tn -
t n-1 we have
Therefore using (19) in (14b) yields:
Next
P(
x nl
y 0:n ∈
Y 0:n ), defined in (13), is calculated after multiplying (22) and (24):
Equation (25) is explicitly solved by applying Proposition 1:
The expression of
p(
xn |
y 0:n ∈
Y 0:n ) as a sum of
N Gaussians is the result of the following substitutions: (26) into (13), (26) into (14c) to obtain
p(
yn ∈
Yn |
y 0:n-1 ∈
Y 0:n-1) and the latter into (13) again. This yields
The third step is to approximate (27) as a single Gaussian to retrieve a computationally tractable algorithm. For if both
p(
x n-1|
y 0:n-1 ∈
Y 0:n-1) and
p(
yn ∈
Yn |
x n) are approximated using
N Gaussians, the estimate of
xn in (27) is described with
Mn Gaussians. The value of
Mn equals
M n-1 N, meaning that
Mn increases after each sample instant and with it also the processing demand of the EBSE increases.
5.3 Step 3: state approximation
-
p(
xn |
y 0:n ∈
Y 0:n ) of (27) is approximated as a single Gaussian with an equal expectation and covariance matrix, i.e.:
The expectation an covariance of (27), equal to
x n|n and P
n|n of (28), can be derived from the corresponding definitions. Notice that because the designed EBSE is based on the equations of the Kalman filter, the condition of computational tractability is met.
5.4 Asymptotic analysis of the error-covariance matrix
-
In this section we investigate the asymptotic analysis of the error-covariance matrix of the developed EBSE. By this we mean that we analyze lim n→∞P n|n which for convenience is denoted as P∞. Note that for the classical Kalman filter (KF) [12] such an analysis is already available. However, for any other type of estimator asymptotic analysis remains a very challenging problem, which is why in most cases it is not even considered.
-
Let us first recall the result on the asymptotic analysis of the Kalman filter. If
x(
t) of (7) is estimated, directly from
y(
t)
, with the KF at synchronous sampling times
tn :=
n·ts, then
P n|n is updated as follows:
-
In [18,19] it is proven that if the eigenvalues of
Ats are within the unit circle and (
Ats ,
C) is observable, then
P ∞ =
PK . The matrix
PK equals the solution of:
For the EBSE however, we cannot prove that
P ∞ equals a constant matrix, Instead we will prove that all the eigenvalues of
P ∞ are bounded, i.e. that λ
max (
P ∞) < ∞, As described in
Section 4 this is a valid indication of an estimator's performance.
-
The main result of this section is obtained under the standing assumption that Λ
Hke is approximated using a single Gaussian. Note that the result then also applies to the estimator presented in [15], as a particular case. We assume that the eigenvalues of the
A τn -matrix are within the unit-circle and (
A τn ,C) is an observable pair. The following technical Lemmas will be of use.
Lemma 1. Given the process model (7)
and covariance matrices P ≻ 0
and Q ≻ 0,
then for any 0 < τ
1 ≤ τ
2 we have that
and
See the Appendix for the proof.
Lemma 2. Let any square matrices V 1 ≺ V 2 and W 1 ≺ W 2 with V
1 ≻ 0
and W 1 ≻ 0
be given. Suppose that the matrices U 1 and U 2 are defined as and for any C of suitable size. Then it holds that U 1 ≺ U 2.
Proof. From [20] we have that and
Hence, it follows that
which yields
Thus,
U 1 ≺ U 2, which concludes the proof.
Next, recall that
Hke (
yn ) is assumed to be a bounded set. Therefore, it is reasonable to further assume that Λ
Hke can be approximated using the formula (17), for
N = 1, and that there exists a constant matrix
V such that
for all
n.
Theorem 1. Suppose that the EBSE, as presented in Section 5, approximates Λ
Hke accarding to (17)
with N = 1
and the above assumptions hold. Then λ
max(
P ∞)
< λ
max (
P̃k )
where P̃K is
equal to the solution of
See the Appendix for the proof.
6 Illustrative example
-
In this section we illustrate the effectiveness of the developed EBSE in terms of state-estimation error, sampling efficiency and computational tractability. The case study is a ID object-tracking system. The states
x(
t) of the object are position and speed while the measurement vector
y(
t) is position. The process-noise
w(
t) represents the object's acceleration. Then given a maximum acceleration of 0.5[
m/
s 2] its corresponding
Q, according to [21], equals 0.02. Therefore the model as presented in (7) yields
C = (10) and
D = 0, which is in fact a discrete-time double integrator. The acceleration in time is shown in
Figure 30 together with the object's position and speed. The sampling time is
ts = 0.1 and the measurement-noise covariance is
V = 0.1 · 10
-3.
-
Three different estimators are tested. The first two estimators are the EBSE and the asynchronous Kalman filter (AKF) of [13]. For simplicity, in both estimators we used the "Send-on-Delta" method with Δ = 0.1 [m]. For the EBSE we approximated ΛHke (yn ) using (23) with N = 5. The AKF estimates the states only at the event instants tke . The states at tka are calculated by applying the prediction-step of (14b). The third estimator is based on the quantized Kalman filter (QKF) introduced in [21] that uses synchronous time sampling of yka . The QKF can deal with quantized data, which also results in less data transfer, and therefore can be considered as an alternative to EBSE. In the QKF y ka is the quantized version of yka with quantization level 0.1, which corresponds to the "Send-on-Delta" method. Hence, a comparison can be made.
-
In Figure 31 and Figure 32 the state estimation-error of the three estimators is plotted. They show that the QKF estimates the position of the object with the least error. However, its error in speed is worse compared to the EBSE. Further, the plot of the AKF clearly shows that prediction of the state-estimates gives a significant growth in estimation-error when the time between the event sampling-instants increases (t > 4).
-
Beside estimation error, sampling efficiency η is also important due to the increased interest in WSNs. For these systems communication is expensive and one aims to have the least data transfer. We define
which is a measure of the change in the estimation-error after the measurement update with either
zke or
y ka was done. Notice that if η < 1 the estimation error decreased after an update, if η > 1 the error increased and if η = 1 the error remained the same. For the EB SE
i =
ke with
i - 1 equal to
ke - 1 1 or
ka - 1. For the AKF
i =
ke with
i - 1 =
ke - 1. For the QKF
i = ka and
i - 1 =
ka - 1.
Figure 33 shows that for the EBSE η < 1 at all instants n. The AKF has one instant,
t = 3.4, at which η > 1. In case of the QKF the error sometimes decreases but it can also increase considerably after an update. Also notice that η of the QKF converges to 1. Meaning that for
t > 5.5 the estimation error does not change after an update and new samples are mostly used to bound λ
i (
P ka|ka ). The EBSE has the same property, although for this method the last sample was received at
t = 4.9.
-
The last aspect on which the three estimators are compared is the total amount of processing time which was needed to estimate all state-vectors. For the EBSE, both xke and xka were estimated and it took 0.094 seconds. The AKF estimated xke and predicted xka in a total time of 0.016 seconds and the QKF estimated xka and its total processing time equaled 0.022 seconds. This means that although the EBSE results in the most processing time, it is computationally comparable to the AKF and QKF, while it provides an estimation-error similar to the QKF, but with significantly less data transmission. As such, it is most suited for usage in networks in general and WSNs in particular.
7 Conclusions
-
In this paper a general event-based state-estimator was presented. The distinguishing feature of the proposed EBSE is that estimation of the states is performed at two different type of time instants, i.e. at event instants tke , when measurement data is used for update, and at synchronous time sampling tka , when no measurement is received, but an update is performed based on the knowledge that the monitored variable lies within a set used to define the event. As a result, it could be proven that, under certain assumptions, for the error-covariance matrix of the EBSE it holds that λ max (P ∞) < ∞, even in the situation when no new observation zke is received anymore. Its effectiveness for usage in WSNs has been demonstrated on an application example.
References
-
- 1. I. F. Akyildiz, W. Su, Y Sankarasubramaniam, and E. Cayirci, "Wireless Sensor Networks: a survey," Elsevier, Computer Networks, vol. 38, pp. 393-422, 2002.
- 2. E. Johannesson, T. Henningsson, and A. Cervin, "Sporadic control of first-order linear stochastic systems," in Hybrid Systems: Computation and Control, ser Lecture Notes in Computer Science, vol. 4416. Pisa, Italy: Springer Verlag, 2007, pp. 301-314.
- 3. W P. M. H. Heemels, J. H. Sandee, and P. P. J. van den Bosch, "Analysis of event-driven controllers for linear systems," International Journal of Control, vol. 81, no. 4, 2008.
- 4. H. W Sorenson and D. L. Alspach, "Recursive Bayesian estimation using Gaussian sums," Automatica, vol. 7, pp. 465-479, 1971.
- 5. J. H. Kotecha and P. M. Djurié, "Gaussian sum particle filtering," IEEE Transaction Signal Processing, vol. 51, no. 10, pp. 2602-2612, 2003.
- 6. N. L. Johnson, S. Kotz, and A. W. Kemp, Univariate discrete distributions. John Wiley and Sons, 1992.
- 7. L. Aggoun and R. Elliot, Measure Theory and Filtering. Cambridge University Press, 2004.
- 8. H. L. Lebesque, "Integrale, longueur, aire," Ph.D. dissertation, University of Nancy, 1902.
- 9. K. J. Åström and B. M. Bernhardsson, "Comparison of Riemann and Lebesque sampling for first order stochastic systems in 41st IEEE Conf, on Dec, and Contr., Las Vegas, USA, 2002.
- 10. M. Miskowicz, "Send-on-delta concept: an event-based data-reporting strategy," Sensors, vol. 6, pp. 49-63, 2006.
- 11. , "Asymptotic Effectiveness of the Event-Based Sampling according to the Integral Criterion," Sensors, vol. 7, pp. 16-37, 2007.
- 12. R. E. Kalman, "A new approach to linear filtering and prediction problems," Transaction of the ASME Journal of Basic Engineering, vol. 82, no. D, pp. 35-42,1960.
- 13. M. Mallick, S. Coraluppi, and C. Carthel, "Advances in Asynchronous and Decentralized Estimation," in In Proceeding of the 2001 Aerospace Conference, Big Sky, MT, USA, 2001.
- 14. B. Ristic, S. Arulampalum, and N. Gordon, Beyond the Kalman filter: Particle filter for tracking applications. Boston, Massachusetts: Artech House, 2004.
- 15. V. H. Nguyen and Y. S. Suh, "Improving estimation performance in Networked Control Systems applying the Send-on-delta transmission method," Sensors, vol. 7, pp. 2128-2138, 2007.
- 16. K. V Mardia, J. T. Kent, and J. M. Bibby, Mutlivariate analysis. Academic press, London, 1979.
- 17. D. C. Montgomery and G. C. Runger, Applied Statistics and Probability for Engineers. John Wiley and Sons, 2007.
- 18. M. L. J. Hautus, "Controllability and observability conditions of linear autonomous systems," in Indagationes Mathemathicae, vol. 32, 1972, pp. 448-455.
- 19. A. V. Balakrishnan, Kalman Filtering Theory. Optimization Software, New York, 1987.
- 20. D. S. Bernstein, Matrix Mathematics. Princeton University Press, 2005.
- 21. R. E. Curry, Estimation and control with quantized measurements. Boston, Massachusetts: MIT Press, 1970.
- 22. G. F. Franklin, J. D. Powel, and A. Emami-Naeini, Feedback control of dynamic systems. Addison-Wesley, 1995.
A Proof of Lemma 1
-
Suppose that
A ∈
and
B ∈
are defined as the state-space matrices for the time-continuous counterpart of (7). Then it is known [22] that for any sampling period τ > 0,
Aτ and
B τ of (7a) are obtained from their corresponding continuous-time matrices A and
B as follows:
Using (31) one obtains:
As for any τ > 0 the series
e Aτ converges [22], then
also converges. Then, since 0 < τ
1 ≤ τ
2 and
P ≻ 0, for any fixed
i,
j, we have
for any matrix A and thus, it follows that
The same reasoning can be used to prove that
B Proof of Theorem 1
-
Under the hypothesis, for the proposed EBSE,
P n|n of (28), with τ
n :=
tn -
t n-1 and
becomes:
The upper bound on λ
max(
P ∞) is proven by induction, considering the asymptotic behavior of a KF that runs in parallel with the EBSE, as follows. The EBSE calculates
as (32) and the KF calculates
as (29) in which
V is replaced with
R :=
V +
V . Notice that for these estimators we have that τ
n ≤
ts and
Rn ≺ R, for all
n. Let the EBSE and the KF start with the same initial covariance matrix
P 0.
-
The first step of induction is to prove that
From the definition of
in (32) and
in (29) we have that
and
-
Suppose we define
W 1 :=
R 1 and
W 2 :=
R. Then
W 1 ≺ W 2 and from
Lemma 1 it follows that
V 1 ≺ V 2. Therefore applying
Lemma 2, with
and
yields
-
The second and last step of induction is to show that if
then
Let
and let
W 1 :=
Rn, W 2 :=
R. Notice that this yields
W 1 ≺ W 2. The second condition of
Lemma 2, i.e.
V 1 ≺ V 2 also holds by applying
Lemma 1, i.e.
Hence, applying
Lemma 2, with
and
yields
-
This proves that
which yields (see e.g., [20])
As
was calculated with the KF it follows from (30) that
with
P̃K as the salution of
which completes the proof.


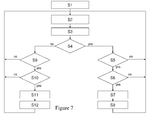


 defines the non-negative real numbers.
 defines the set spanned by the vectors ex and ey , the point p := x·ex +y·ey is shortly denoted as p = (x,y) T . The set
 Z defines the integer values and
 defines the set of non-negative integer numbers. The variable 0 is used either as null, the null-vector or the null-matrix. Its size will become clear from the context.
 is defined as tk ∈
 . The variables τ k ∈
 , xk ∈
 and x 0:k ∈
 are defined as:


 as the scalar Pr(x|u) ∈ {0,1}. The probability density function (PDF), as defined in [6] section B2, of the vector x ∈
 is denoted as p(x) and the conditional PDF of x given u ∈
 is denoted as p(x|u). The expectation and covariance of x are denoted as E[x] and cov(x) respectively. The conditional expectation of x given a vector u is denoted as E[x|u|. The definitions of E[x], E[x|u] and cov(x) can be found in [6] sections B4 and B7.
 and on matrix P ∈
 is defined as:

 and the vectors x ∈
 and y ∈
 . Then the function ∥x - y∥ ∈
 is defined as the distance between vectors x and y. The function |(x -
 )| ∈
)| ∈ is defined as the shortest distance from vector x to set
 :
:


 . In the case of o = 0 and θ = 0 the corners of this box, as shown in


 is used as defined in (5). An example of the object's box for a certain o and θ is graphically depicted in


 and the closed set of the object's edge S E ⊂
 , i.e. S := SB ∪ SE . The set S is approximated by a set of sampled position-vectors Λ = [λ1,λ2, ···, λ K ], with λ i ∈
 . To define the vectors λi we equidistant sample the rectangular box defined by
 using a grid with a distance r. Each λ i is a grid point within the set S as graphically depicted in
 are defined as:


 and collected in the set D ⊂
 . The position of a detection point is denoted as d ∈ D. The kth tection of the system generates the observation vector


 ,
, }, which is yet to be associated with an object. Therefore, due to the kth detection, the observation vector zk is generated whenever one of the E object covers a detection point dk ∈ D at time tk :


 which is close to d. This is modeled by defining that the object's position at the instant of the detection, i.e. υ, is a random vector with mean d and covariance ε ∈
 :
:


 , the detection point at time-step n are defined as dn ∈
 . Meaning that the objects orientation is not directly. However, because every observation vector zn ∈ Z detects the object for one and the same θ, the PDF p(m|Z) is approximated by sampling in θ, i.e.:


 is presented in the n the next section. Therefore, if one object is detected at multiple detection points dn , ∀n ∈ N, then the set of all possible object positions o given a certain θ equals On (θ):


 and the matrix Γ ∈
 ; G(x, u, U) and G(m,Γx,M). Then they have the following property:


 of Section 2.3 defined by its corners [c 1,c 2,c 3,c 4]. For each detection point dn we define the set
 (θ) ⊂
(θ) ⊂ with corner-points [c n1(θ),c n2(θ),c n3(θ),c n4(θ)] defined as:

 as the intersection of the sets
 (θ), ∀ n ∈ N, i.e.:

 (θ).
(θ).
 (θ) all the functions f(o|zn , θ) have an overlapping area in which they are 1. Outside
 (θ) there is always at least one f(o|zn , θ) which is 0 and therefore makes g(o|Z, θ) outside C N (θ) equal to 0. Therefore g(o|Z, θ) of (22) can be approximated by taking only those Gaussians of the functions f(o|zn, θ) into account of which their mean, i.e.
 (θ). We define that close to
 (θ) means a distance of at most γ+ε, which defined R in (21). The function g(o|Z, θ) of (22) is therefore approximated as:


 (θ). Therefore equation (25) is reduced to:


 , m ∈
, m ∈ and matrices U ∈
 , M ∈
, M ∈ , Γ ∈
, Γ ∈ : G(x,u,U) and G(m,Γ x,M). Suppose we define the following PDFs and relation of m with some c ∈
 :
:


 with p(a) = G(a,u 1,U 1) and p(b) = G(b,u2 ,U 2) then they have the property p(a + b) = G(a + b,u 1 + u 2, U 1 + U 2) as proven in [12]. Applying this on (33a) results in:


 defines the set of non-negative integer numbers. The
 and is sampled using some sampling method. Two different sampling methods are discussed. The first one is time sampling in which samples are generated whenever time t equals some predefined value. This is either synchronous in time or asynchronous. In the synchronous case the time between two samples is constant and defined as ts ∈
 . If the time t at sampling instant ka ∈ is defined as tka , with t 0a := 0, we define:


 to a vector x(t 2) ∈
 as follows:

 and B ∈
 are positive definite, denoted with A ≻ 0 and B ≻ 0, then A ≻ B denotes A - B ≻ 0. A ≻ 0 denotes A is positive semi-definite.
 is denoted as p(x|u). The expectation and covariance of x are denoted as E[x] and cov(x) respectively. The conditional expectation of x given u is denoted as E[xlu]. The definitions of E[x], E[x|u] and cov(x) can be found in [6] sections B4 and B7.
 and matrix P ∈
 is defined as G(x,u,P) :
 ×
× ×
× →
→ , i.e.:

 → {0,1}, satisfies:

 , the set PDF is defined as AY (x) :
 → {0, v} with v ∈
 defined as the Lebesque measure [8] of the set Y, i.e.:


 . Recall that if y(t) is sampled at ta it is denoted as yka . This method is formalized by defining the observation vector z ka-1 =
 containing all the values that t can take between t ka-1 and t ka-1 + τ ka-1, i.e.:


 , which depends on both Z ke-1 and t. In line with time sampling the next event instant, i.e. ke , takes place whenever y(t) leaves the set Hke (Z ke-1,t) as shown in


 , measurement-vector y(t) ∈
 and measurement-noise v(t) ∈
 . This process is described by a state-space model with A τ ∈
 , B τ ∈
 and C ∈
 . An event sampling method is used to sample y(t). The model of this process becomes:


 , with Γ ∈
 : G(m,Γx,M) and G(x,u,U). Then they satisfy:


 .
.


 See the Appendix for the proof.


 are defined as the state-space matrices for the time-continuous counterpart of (7). Then it is known [22] that for any sampling period τ > 0, Aτ and B τ of (7a) are obtained from their corresponding continuous-time matrices A and B as follows:


 for any matrix A and thus, it follows that
 The same reasoning can be used to prove that


 As
As


