US20030191398A1 - Systems and methods for spectroscopy of biological tissue - Google Patents
Systems and methods for spectroscopy of biological tissue Download PDFInfo
- Publication number
- US20030191398A1 US20030191398A1 US10/178,062 US17806202A US2003191398A1 US 20030191398 A1 US20030191398 A1 US 20030191398A1 US 17806202 A US17806202 A US 17806202A US 2003191398 A1 US2003191398 A1 US 2003191398A1
- Authority
- US
- United States
- Prior art keywords
- collection
- probe
- delivery
- fiber
- tissue
- Prior art date
- Legal status (The legal status is an assumption and is not a legal conclusion. Google has not performed a legal analysis and makes no representation as to the accuracy of the status listed.)
- Granted
Links
- 238000000034 method Methods 0.000 title abstract description 30
- 238000004611 spectroscopical analysis Methods 0.000 title abstract description 7
- 239000000835 fiber Substances 0.000 claims abstract description 155
- 210000001519 tissue Anatomy 0.000 claims abstract description 133
- 239000000523 sample Substances 0.000 claims abstract description 128
- 238000001069 Raman spectroscopy Methods 0.000 claims abstract description 121
- 239000013307 optical fiber Substances 0.000 claims abstract description 44
- 230000003287 optical effect Effects 0.000 claims abstract description 41
- 230000005855 radiation Effects 0.000 claims abstract description 9
- 230000003595 spectral effect Effects 0.000 claims description 28
- 210000005003 heart tissue Anatomy 0.000 claims 1
- 238000003745 diagnosis Methods 0.000 abstract description 15
- 208000029078 coronary artery disease Diseases 0.000 abstract description 6
- 208000014674 injury Diseases 0.000 abstract description 2
- 210000004872 soft tissue Anatomy 0.000 abstract description 2
- 230000008733 trauma Effects 0.000 abstract description 2
- 201000011531 vascular cancer Diseases 0.000 abstract description 2
- 208000019553 vascular disease Diseases 0.000 abstract description 2
- 238000001228 spectrum Methods 0.000 description 103
- 230000000877 morphologic effect Effects 0.000 description 96
- 238000001237 Raman spectrum Methods 0.000 description 72
- 210000004351 coronary vessel Anatomy 0.000 description 60
- 210000001367 artery Anatomy 0.000 description 59
- HVYWMOMLDIMFJA-DPAQBDIFSA-N cholesterol Chemical compound C1C=C2C[C@@H](O)CC[C@]2(C)[C@@H]2[C@@H]1[C@@H]1CC[C@H]([C@H](C)CCCC(C)C)[C@@]1(C)CC2 HVYWMOMLDIMFJA-DPAQBDIFSA-N 0.000 description 58
- 208000037260 Atherosclerotic Plaque Diseases 0.000 description 49
- 210000000497 foam cell Anatomy 0.000 description 46
- 102000008186 Collagen Human genes 0.000 description 42
- 108010035532 Collagen Proteins 0.000 description 42
- 229920001436 collagen Polymers 0.000 description 42
- 230000005284 excitation Effects 0.000 description 40
- 235000012000 cholesterol Nutrition 0.000 description 29
- 239000013078 crystal Substances 0.000 description 28
- 239000000203 mixture Substances 0.000 description 27
- 239000000126 substance Substances 0.000 description 25
- 238000009826 distribution Methods 0.000 description 24
- 230000001338 necrotic effect Effects 0.000 description 24
- 230000003143 atherosclerotic effect Effects 0.000 description 23
- 210000004369 blood Anatomy 0.000 description 20
- 239000008280 blood Substances 0.000 description 20
- OENHQHLEOONYIE-UKMVMLAPSA-N all-trans beta-carotene Natural products CC=1CCCC(C)(C)C=1/C=C/C(/C)=C/C=C/C(/C)=C/C=C/C=C(C)C=CC=C(C)C=CC1=C(C)CCCC1(C)C OENHQHLEOONYIE-UKMVMLAPSA-N 0.000 description 19
- 239000011648 beta-carotene Substances 0.000 description 19
- TUPZEYHYWIEDIH-WAIFQNFQSA-N beta-carotene Natural products CC(=C/C=C/C=C(C)/C=C/C=C(C)/C=C/C1=C(C)CCCC1(C)C)C=CC=C(/C)C=CC2=CCCCC2(C)C TUPZEYHYWIEDIH-WAIFQNFQSA-N 0.000 description 19
- 235000013734 beta-carotene Nutrition 0.000 description 19
- 229960002747 betacarotene Drugs 0.000 description 19
- OENHQHLEOONYIE-JLTXGRSLSA-N β-Carotene Chemical compound CC=1CCCC(C)(C)C=1\C=C\C(\C)=C\C=C\C(\C)=C\C=C\C=C(/C)\C=C\C=C(/C)\C=C\C1=C(C)CCCC1(C)C OENHQHLEOONYIE-JLTXGRSLSA-N 0.000 description 19
- 238000004458 analytical method Methods 0.000 description 18
- 210000000329 smooth muscle myocyte Anatomy 0.000 description 18
- 238000001727 in vivo Methods 0.000 description 17
- 239000000047 product Substances 0.000 description 17
- 230000003902 lesion Effects 0.000 description 15
- OYPRJOBELJOOCE-UHFFFAOYSA-N Calcium Chemical compound [Ca] OYPRJOBELJOOCE-UHFFFAOYSA-N 0.000 description 13
- 210000001789 adipocyte Anatomy 0.000 description 13
- 239000011575 calcium Substances 0.000 description 13
- 229910052791 calcium Inorganic materials 0.000 description 13
- 230000033558 biomineral tissue development Effects 0.000 description 12
- 206010061818 Disease progression Diseases 0.000 description 11
- 230000005750 disease progression Effects 0.000 description 11
- VTYYLEPIZMXCLO-UHFFFAOYSA-L Calcium carbonate Chemical compound [Ca+2].[O-]C([O-])=O VTYYLEPIZMXCLO-UHFFFAOYSA-L 0.000 description 10
- 238000000576 coating method Methods 0.000 description 10
- 239000012530 fluid Substances 0.000 description 10
- 238000000338 in vitro Methods 0.000 description 10
- 201000001320 Atherosclerosis Diseases 0.000 description 9
- 102000016942 Elastin Human genes 0.000 description 9
- 108010014258 Elastin Proteins 0.000 description 9
- 102000003505 Myosin Human genes 0.000 description 9
- 108060008487 Myosin Proteins 0.000 description 9
- 150000001840 cholesterol esters Chemical class 0.000 description 9
- 229920002549 elastin Polymers 0.000 description 9
- 238000010586 diagram Methods 0.000 description 8
- 230000000694 effects Effects 0.000 description 8
- 238000011065 in-situ storage Methods 0.000 description 8
- 230000002829 reductive effect Effects 0.000 description 8
- 229910052594 sapphire Inorganic materials 0.000 description 8
- 239000010980 sapphire Substances 0.000 description 8
- 230000008901 benefit Effects 0.000 description 7
- 238000004422 calculation algorithm Methods 0.000 description 7
- 239000011248 coating agent Substances 0.000 description 7
- 210000002808 connective tissue Anatomy 0.000 description 7
- 238000012774 diagnostic algorithm Methods 0.000 description 7
- 201000010099 disease Diseases 0.000 description 7
- 208000037265 diseases, disorders, signs and symptoms Diseases 0.000 description 7
- 239000007787 solid Substances 0.000 description 7
- VYPSYNLAJGMNEJ-UHFFFAOYSA-N Silicium dioxide Chemical group O=[Si]=O VYPSYNLAJGMNEJ-UHFFFAOYSA-N 0.000 description 6
- 238000002583 angiography Methods 0.000 description 6
- 210000000481 breast Anatomy 0.000 description 6
- 230000001413 cellular effect Effects 0.000 description 6
- 230000003247 decreasing effect Effects 0.000 description 6
- 238000005070 sampling Methods 0.000 description 6
- 238000010200 validation analysis Methods 0.000 description 6
- 102000007469 Actins Human genes 0.000 description 5
- 108010085238 Actins Proteins 0.000 description 5
- 102000005937 Tropomyosin Human genes 0.000 description 5
- 108010030743 Tropomyosin Proteins 0.000 description 5
- 210000003484 anatomy Anatomy 0.000 description 5
- 230000002308 calcification Effects 0.000 description 5
- 229910000019 calcium carbonate Inorganic materials 0.000 description 5
- 230000000875 corresponding effect Effects 0.000 description 5
- 238000005516 engineering process Methods 0.000 description 5
- 238000003384 imaging method Methods 0.000 description 5
- 238000002608 intravascular ultrasound Methods 0.000 description 5
- 150000002632 lipids Chemical class 0.000 description 5
- 239000000463 material Substances 0.000 description 5
- XYJRXVWERLGGKC-UHFFFAOYSA-D pentacalcium;hydroxide;triphosphate Chemical compound [OH-].[Ca+2].[Ca+2].[Ca+2].[Ca+2].[Ca+2].[O-]P([O-])([O-])=O.[O-]P([O-])([O-])=O.[O-]P([O-])([O-])=O XYJRXVWERLGGKC-UHFFFAOYSA-D 0.000 description 5
- 150000003904 phospholipids Chemical class 0.000 description 5
- 238000012545 processing Methods 0.000 description 5
- XKRFYHLGVUSROY-UHFFFAOYSA-N Argon Chemical compound [Ar] XKRFYHLGVUSROY-UHFFFAOYSA-N 0.000 description 4
- IJGRMHOSHXDMSA-UHFFFAOYSA-N Atomic nitrogen Chemical compound N#N IJGRMHOSHXDMSA-UHFFFAOYSA-N 0.000 description 4
- WZUVPPKBWHMQCE-UHFFFAOYSA-N Haematoxylin Chemical compound C12=CC(O)=C(O)C=C2CC2(O)C1C1=CC=C(O)C(O)=C1OC2 WZUVPPKBWHMQCE-UHFFFAOYSA-N 0.000 description 4
- 208000031481 Pathologic Constriction Diseases 0.000 description 4
- FAPWRFPIFSIZLT-UHFFFAOYSA-M Sodium chloride Chemical compound [Na+].[Cl-] FAPWRFPIFSIZLT-UHFFFAOYSA-M 0.000 description 4
- 208000007536 Thrombosis Diseases 0.000 description 4
- 210000000709 aorta Anatomy 0.000 description 4
- 239000011324 bead Substances 0.000 description 4
- 238000005452 bending Methods 0.000 description 4
- 229910052799 carbon Inorganic materials 0.000 description 4
- 230000001427 coherent effect Effects 0.000 description 4
- 150000001875 compounds Chemical class 0.000 description 4
- 238000013461 design Methods 0.000 description 4
- 239000011521 glass Substances 0.000 description 4
- 238000005259 measurement Methods 0.000 description 4
- 230000001575 pathological effect Effects 0.000 description 4
- 102000004169 proteins and genes Human genes 0.000 description 4
- 108090000623 proteins and genes Proteins 0.000 description 4
- 238000004088 simulation Methods 0.000 description 4
- 230000036262 stenosis Effects 0.000 description 4
- 208000037804 stenosis Diseases 0.000 description 4
- 150000003626 triacylglycerols Chemical class 0.000 description 4
- 238000011179 visual inspection Methods 0.000 description 4
- XLYOFNOQVPJJNP-UHFFFAOYSA-N water Substances O XLYOFNOQVPJJNP-UHFFFAOYSA-N 0.000 description 4
- 229910001868 water Inorganic materials 0.000 description 4
- 206010006187 Breast cancer Diseases 0.000 description 3
- COLNVLDHVKWLRT-QMMMGPOBSA-N L-phenylalanine Chemical compound OC(=O)[C@@H](N)CC1=CC=CC=C1 COLNVLDHVKWLRT-QMMMGPOBSA-N 0.000 description 3
- 238000003657 Likelihood-ratio test Methods 0.000 description 3
- 238000001530 Raman microscopy Methods 0.000 description 3
- 239000004115 Sodium Silicate Substances 0.000 description 3
- HEMHJVSKTPXQMS-UHFFFAOYSA-M Sodium hydroxide Chemical compound [OH-].[Na+] HEMHJVSKTPXQMS-UHFFFAOYSA-M 0.000 description 3
- YXFVVABEGXRONW-UHFFFAOYSA-N Toluene Chemical compound CC1=CC=CC=C1 YXFVVABEGXRONW-UHFFFAOYSA-N 0.000 description 3
- BAECOWNUKCLBPZ-HIUWNOOHSA-N Triolein Natural products O([C@H](OCC(=O)CCCCCCC/C=C\CCCCCCCC)COC(=O)CCCCCCC/C=C\CCCCCCCC)C(=O)CCCCCCC/C=C\CCCCCCCC BAECOWNUKCLBPZ-HIUWNOOHSA-N 0.000 description 3
- PHYFQTYBJUILEZ-UHFFFAOYSA-N Trioleoylglycerol Natural products CCCCCCCCC=CCCCCCCCC(=O)OCC(OC(=O)CCCCCCCC=CCCCCCCCC)COC(=O)CCCCCCCC=CCCCCCCCC PHYFQTYBJUILEZ-UHFFFAOYSA-N 0.000 description 3
- 238000010521 absorption reaction Methods 0.000 description 3
- 150000001408 amides Chemical class 0.000 description 3
- 229910001632 barium fluoride Inorganic materials 0.000 description 3
- 230000005540 biological transmission Effects 0.000 description 3
- 235000021466 carotenoid Nutrition 0.000 description 3
- 150000001747 carotenoids Chemical class 0.000 description 3
- 210000004027 cell Anatomy 0.000 description 3
- 238000001344 confocal Raman microscopy Methods 0.000 description 3
- VEVRNHHLCPGNDU-MUGJNUQGSA-O desmosine Chemical compound OC(=O)[C@@H](N)CCCC[N+]1=CC(CC[C@H](N)C(O)=O)=C(CCC[C@H](N)C(O)=O)C(CC[C@H](N)C(O)=O)=C1 VEVRNHHLCPGNDU-MUGJNUQGSA-O 0.000 description 3
- 238000001514 detection method Methods 0.000 description 3
- 230000002526 effect on cardiovascular system Effects 0.000 description 3
- 238000011010 flushing procedure Methods 0.000 description 3
- -1 for example Substances 0.000 description 3
- RGXCTRIQQODGIZ-UHFFFAOYSA-O isodesmosine Chemical compound OC(=O)C(N)CCCC[N+]1=CC(CCC(N)C(O)=O)=CC(CCC(N)C(O)=O)=C1CCCC(N)C(O)=O RGXCTRIQQODGIZ-UHFFFAOYSA-O 0.000 description 3
- 238000007477 logistic regression Methods 0.000 description 3
- 229910001635 magnesium fluoride Inorganic materials 0.000 description 3
- 238000002595 magnetic resonance imaging Methods 0.000 description 3
- 238000001634 microspectroscopy Methods 0.000 description 3
- 238000012986 modification Methods 0.000 description 3
- 230000004048 modification Effects 0.000 description 3
- 230000007935 neutral effect Effects 0.000 description 3
- 230000007170 pathology Effects 0.000 description 3
- COLNVLDHVKWLRT-UHFFFAOYSA-N phenylalanine Natural products OC(=O)C(N)CC1=CC=CC=C1 COLNVLDHVKWLRT-UHFFFAOYSA-N 0.000 description 3
- WTJKGGKOPKCXLL-RRHRGVEJSA-N phosphatidylcholine Chemical compound CCCCCCCCCCCCCCCC(=O)OC[C@H](COP([O-])(=O)OCC[N+](C)(C)C)OC(=O)CCCCCCCC=CCCCCCCCC WTJKGGKOPKCXLL-RRHRGVEJSA-N 0.000 description 3
- 239000011780 sodium chloride Substances 0.000 description 3
- 229910052911 sodium silicate Inorganic materials 0.000 description 3
- NTHWMYGWWRZVTN-UHFFFAOYSA-N sodium silicate Chemical compound [Na+].[Na+].[O-][Si]([O-])=O NTHWMYGWWRZVTN-UHFFFAOYSA-N 0.000 description 3
- PHYFQTYBJUILEZ-IUPFWZBJSA-N triolein Chemical compound CCCCCCCC\C=C/CCCCCCCC(=O)OCC(OC(=O)CCCCCCC\C=C/CCCCCCCC)COC(=O)CCCCCCC\C=C/CCCCCCCC PHYFQTYBJUILEZ-IUPFWZBJSA-N 0.000 description 3
- 229940117972 triolein Drugs 0.000 description 3
- 210000004231 tunica media Anatomy 0.000 description 3
- GTRMJEVFVTWDIU-KPNWGBFJSA-N (3s,8s,9s,10r,13r,14s,17r)-10,13-dimethyl-17-[(2r)-6-methylheptan-2-yl]-2,3,4,7,8,9,11,12,14,15,16,17-dodecahydro-1h-cyclopenta[a]phenanthren-3-ol;hydrate Chemical compound O.C1C=C2C[C@@H](O)CC[C@]2(C)[C@@H]2[C@@H]1[C@@H]1CC[C@H]([C@H](C)CCCC(C)C)[C@@]1(C)CC2 GTRMJEVFVTWDIU-KPNWGBFJSA-N 0.000 description 2
- 206010003211 Arteriosclerosis coronary artery Diseases 0.000 description 2
- 208000026310 Breast neoplasm Diseases 0.000 description 2
- 239000005149 Cholesterol Linoleate Substances 0.000 description 2
- LLQPHQFNMLZJMP-UHFFFAOYSA-N Fentrazamide Chemical compound N1=NN(C=2C(=CC=CC=2)Cl)C(=O)N1C(=O)N(CC)C1CCCCC1 LLQPHQFNMLZJMP-UHFFFAOYSA-N 0.000 description 2
- WSFSSNUMVMOOMR-UHFFFAOYSA-N Formaldehyde Chemical compound O=C WSFSSNUMVMOOMR-UHFFFAOYSA-N 0.000 description 2
- 229910000530 Gallium indium arsenide Inorganic materials 0.000 description 2
- 206010017993 Gastrointestinal neoplasms Diseases 0.000 description 2
- 229920002683 Glycosaminoglycan Polymers 0.000 description 2
- 208000032843 Hemorrhage Diseases 0.000 description 2
- NAACPBBQTFFYQB-UHFFFAOYSA-N Linolsaeure-cholesterylester Natural products C12CCC3(C)C(C(C)CCCC(C)C)CCC3C2CC=C2C1(C)CCC(OC(=O)CCCCCCCC=CCC=CCCCCC)C2 NAACPBBQTFFYQB-UHFFFAOYSA-N 0.000 description 2
- 229910003873 O—P—O Inorganic materials 0.000 description 2
- 229910019142 PO4 Inorganic materials 0.000 description 2
- KDLHZDBZIXYQEI-UHFFFAOYSA-N Palladium Chemical compound [Pd] KDLHZDBZIXYQEI-UHFFFAOYSA-N 0.000 description 2
- 239000004793 Polystyrene Substances 0.000 description 2
- XUIMIQQOPSSXEZ-UHFFFAOYSA-N Silicon Chemical compound [Si] XUIMIQQOPSSXEZ-UHFFFAOYSA-N 0.000 description 2
- 229920003350 Spectratech® Polymers 0.000 description 2
- 101710172711 Structural protein Proteins 0.000 description 2
- 230000001154 acute effect Effects 0.000 description 2
- 229910052782 aluminium Inorganic materials 0.000 description 2
- XAGFODPZIPBFFR-UHFFFAOYSA-N aluminium Chemical compound [Al] XAGFODPZIPBFFR-UHFFFAOYSA-N 0.000 description 2
- 238000002399 angioplasty Methods 0.000 description 2
- 229910052786 argon Inorganic materials 0.000 description 2
- 238000012742 biochemical analysis Methods 0.000 description 2
- 238000001574 biopsy Methods 0.000 description 2
- 230000000903 blocking effect Effects 0.000 description 2
- 230000017531 blood circulation Effects 0.000 description 2
- 239000007975 buffered saline Substances 0.000 description 2
- 239000004568 cement Substances 0.000 description 2
- NAACPBBQTFFYQB-LJAITQKLSA-N cholesteryl linoleate Chemical compound C([C@@H]12)C[C@]3(C)[C@@H]([C@H](C)CCCC(C)C)CC[C@H]3[C@@H]1CC=C1[C@]2(C)CC[C@H](OC(=O)CCCCCCC\C=C/C\C=C/CCCCC)C1 NAACPBBQTFFYQB-LJAITQKLSA-N 0.000 description 2
- 238000010276 construction Methods 0.000 description 2
- 208000026758 coronary atherosclerosis Diseases 0.000 description 2
- 230000008878 coupling Effects 0.000 description 2
- 238000010168 coupling process Methods 0.000 description 2
- 238000005859 coupling reaction Methods 0.000 description 2
- 238000013480 data collection Methods 0.000 description 2
- 238000013500 data storage Methods 0.000 description 2
- 238000011161 development Methods 0.000 description 2
- 230000018109 developmental process Effects 0.000 description 2
- 238000002059 diagnostic imaging Methods 0.000 description 2
- LOKCTEFSRHRXRJ-UHFFFAOYSA-I dipotassium trisodium dihydrogen phosphate hydrogen phosphate dichloride Chemical compound P(=O)(O)(O)[O-].[K+].P(=O)(O)([O-])[O-].[Na+].[Na+].[Cl-].[K+].[Cl-].[Na+] LOKCTEFSRHRXRJ-UHFFFAOYSA-I 0.000 description 2
- 238000002224 dissection Methods 0.000 description 2
- 239000002019 doping agent Substances 0.000 description 2
- 239000003814 drug Substances 0.000 description 2
- YQGOJNYOYNNSMM-UHFFFAOYSA-N eosin Chemical compound [Na+].OC(=O)C1=CC=CC=C1C1=C2C=C(Br)C(=O)C(Br)=C2OC2=C(Br)C(O)=C(Br)C=C21 YQGOJNYOYNNSMM-UHFFFAOYSA-N 0.000 description 2
- 238000011156 evaluation Methods 0.000 description 2
- 230000001747 exhibiting effect Effects 0.000 description 2
- 238000002474 experimental method Methods 0.000 description 2
- 238000001914 filtration Methods 0.000 description 2
- 239000005350 fused silica glass Substances 0.000 description 2
- 238000007654 immersion Methods 0.000 description 2
- 238000010348 incorporation Methods 0.000 description 2
- 238000002955 isolation Methods 0.000 description 2
- 239000007788 liquid Substances 0.000 description 2
- 238000012544 monitoring process Methods 0.000 description 2
- 238000013425 morphometry Methods 0.000 description 2
- 229910052757 nitrogen Inorganic materials 0.000 description 2
- 238000005457 optimization Methods 0.000 description 2
- 239000002953 phosphate buffered saline Substances 0.000 description 2
- 229920002223 polystyrene Polymers 0.000 description 2
- 238000002360 preparation method Methods 0.000 description 2
- 238000000513 principal component analysis Methods 0.000 description 2
- 229910052710 silicon Inorganic materials 0.000 description 2
- 239000010703 silicon Substances 0.000 description 2
- 235000012239 silicon dioxide Nutrition 0.000 description 2
- 230000001954 sterilising effect Effects 0.000 description 2
- 238000004659 sterilization and disinfection Methods 0.000 description 2
- 150000003431 steroids Chemical class 0.000 description 2
- 238000003860 storage Methods 0.000 description 2
- 230000008719 thickening Effects 0.000 description 2
- 239000010409 thin film Substances 0.000 description 2
- 238000002054 transplantation Methods 0.000 description 2
- KIUKXJAPPMFGSW-DNGZLQJQSA-N (2S,3S,4S,5R,6R)-6-[(2S,3R,4R,5S,6R)-3-Acetamido-2-[(2S,3S,4R,5R,6R)-6-[(2R,3R,4R,5S,6R)-3-acetamido-2,5-dihydroxy-6-(hydroxymethyl)oxan-4-yl]oxy-2-carboxy-4,5-dihydroxyoxan-3-yl]oxy-5-hydroxy-6-(hydroxymethyl)oxan-4-yl]oxy-3,4,5-trihydroxyoxane-2-carboxylic acid Chemical compound CC(=O)N[C@H]1[C@H](O)O[C@H](CO)[C@@H](O)[C@@H]1O[C@H]1[C@H](O)[C@@H](O)[C@H](O[C@H]2[C@@H]([C@@H](O[C@H]3[C@@H]([C@@H](O)[C@H](O)[C@H](O3)C(O)=O)O)[C@H](O)[C@@H](CO)O2)NC(C)=O)[C@@H](C(O)=O)O1 KIUKXJAPPMFGSW-DNGZLQJQSA-N 0.000 description 1
- SQDAZGGFXASXDW-UHFFFAOYSA-N 5-bromo-2-(trifluoromethoxy)pyridine Chemical compound FC(F)(F)OC1=CC=C(Br)C=N1 SQDAZGGFXASXDW-UHFFFAOYSA-N 0.000 description 1
- OYHQOLUKZRVURQ-HZJYTTRNSA-M 9-cis,12-cis-Octadecadienoate Chemical compound CCCCC\C=C/C\C=C/CCCCCCCC([O-])=O OYHQOLUKZRVURQ-HZJYTTRNSA-M 0.000 description 1
- 206010003210 Arteriosclerosis Diseases 0.000 description 1
- OKTJSMMVPCPJKN-UHFFFAOYSA-N Carbon Chemical compound [C] OKTJSMMVPCPJKN-UHFFFAOYSA-N 0.000 description 1
- 229920001287 Chondroitin sulfate Polymers 0.000 description 1
- 102000001187 Collagen Type III Human genes 0.000 description 1
- 108010069502 Collagen Type III Proteins 0.000 description 1
- 206010056370 Congestive cardiomyopathy Diseases 0.000 description 1
- 229920000045 Dermatan sulfate Polymers 0.000 description 1
- 201000010046 Dilated cardiomyopathy Diseases 0.000 description 1
- 206010058314 Dysplasia Diseases 0.000 description 1
- 239000004593 Epoxy Substances 0.000 description 1
- IAYPIBMASNFSPL-UHFFFAOYSA-N Ethylene oxide Chemical compound C1CO1 IAYPIBMASNFSPL-UHFFFAOYSA-N 0.000 description 1
- 206010019280 Heart failures Diseases 0.000 description 1
- 229920002971 Heparan sulfate Polymers 0.000 description 1
- 241000282412 Homo Species 0.000 description 1
- PMMYEEVYMWASQN-DMTCNVIQSA-N Hydroxyproline Chemical compound O[C@H]1CN[C@H](C(O)=O)C1 PMMYEEVYMWASQN-DMTCNVIQSA-N 0.000 description 1
- 238000012307 MRI technique Methods 0.000 description 1
- 238000007476 Maximum Likelihood Methods 0.000 description 1
- 238000000342 Monte Carlo simulation Methods 0.000 description 1
- 239000004111 Potassium silicate Substances 0.000 description 1
- ONIBWKKTOPOVIA-UHFFFAOYSA-N Proline Natural products OC(=O)C1CCCN1 ONIBWKKTOPOVIA-UHFFFAOYSA-N 0.000 description 1
- 241000219289 Silene Species 0.000 description 1
- BQCADISMDOOEFD-UHFFFAOYSA-N Silver Chemical compound [Ag] BQCADISMDOOEFD-UHFFFAOYSA-N 0.000 description 1
- 206010057469 Vascular stenosis Diseases 0.000 description 1
- 238000009825 accumulation Methods 0.000 description 1
- 230000001464 adherent effect Effects 0.000 description 1
- 239000000853 adhesive Substances 0.000 description 1
- 230000001070 adhesive effect Effects 0.000 description 1
- 210000000577 adipose tissue Anatomy 0.000 description 1
- 229910052910 alkali metal silicate Inorganic materials 0.000 description 1
- 239000012491 analyte Substances 0.000 description 1
- 238000010171 animal model Methods 0.000 description 1
- 230000036523 atherogenesis Effects 0.000 description 1
- 238000005284 basis set Methods 0.000 description 1
- 238000004159 blood analysis Methods 0.000 description 1
- 210000000988 bone and bone Anatomy 0.000 description 1
- 239000000872 buffer Substances 0.000 description 1
- QXDMQSPYEZFLGF-UHFFFAOYSA-L calcium oxalate Chemical compound [Ca+2].[O-]C(=O)C([O-])=O QXDMQSPYEZFLGF-UHFFFAOYSA-L 0.000 description 1
- 159000000007 calcium salts Chemical class 0.000 description 1
- 238000004364 calculation method Methods 0.000 description 1
- 150000001721 carbon Chemical class 0.000 description 1
- JJWKPURADFRFRB-UHFFFAOYSA-N carbonyl sulfide Chemical compound O=C=S JJWKPURADFRFRB-UHFFFAOYSA-N 0.000 description 1
- 230000000747 cardiac effect Effects 0.000 description 1
- 210000000845 cartilage Anatomy 0.000 description 1
- 238000004113 cell culture Methods 0.000 description 1
- 230000008859 change Effects 0.000 description 1
- 239000007795 chemical reaction product Substances 0.000 description 1
- 239000003153 chemical reaction reagent Substances 0.000 description 1
- 239000003795 chemical substances by application Substances 0.000 description 1
- 229960001231 choline Drugs 0.000 description 1
- OEYIOHPDSNJKLS-UHFFFAOYSA-N choline Chemical compound C[N+](C)(C)CCO OEYIOHPDSNJKLS-UHFFFAOYSA-N 0.000 description 1
- 229940059329 chondroitin sulfate Drugs 0.000 description 1
- 238000005253 cladding Methods 0.000 description 1
- 230000001010 compromised effect Effects 0.000 description 1
- 239000000470 constituent Substances 0.000 description 1
- 238000001816 cooling Methods 0.000 description 1
- 210000004087 cornea Anatomy 0.000 description 1
- 238000002586 coronary angiography Methods 0.000 description 1
- 238000012937 correction Methods 0.000 description 1
- 230000002596 correlated effect Effects 0.000 description 1
- 238000004132 cross linking Methods 0.000 description 1
- 210000000805 cytoplasm Anatomy 0.000 description 1
- 238000007405 data analysis Methods 0.000 description 1
- 230000008021 deposition Effects 0.000 description 1
- AVJBPWGFOQAPRH-FWMKGIEWSA-L dermatan sulfate Chemical compound CC(=O)N[C@H]1[C@H](O)O[C@H](CO)[C@H](OS([O-])(=O)=O)[C@@H]1O[C@H]1[C@H](O)[C@@H](O)[C@H](O)[C@H](C([O-])=O)O1 AVJBPWGFOQAPRH-FWMKGIEWSA-L 0.000 description 1
- 229940051593 dermatan sulfate Drugs 0.000 description 1
- 238000012631 diagnostic technique Methods 0.000 description 1
- 238000006073 displacement reaction Methods 0.000 description 1
- PMMYEEVYMWASQN-UHFFFAOYSA-N dl-hydroxyproline Natural products OC1C[NH2+]C(C([O-])=O)C1 PMMYEEVYMWASQN-UHFFFAOYSA-N 0.000 description 1
- 229940079593 drug Drugs 0.000 description 1
- 230000009977 dual effect Effects 0.000 description 1
- 239000000975 dye Substances 0.000 description 1
- 238000013399 early diagnosis Methods 0.000 description 1
- 238000013171 endarterectomy Methods 0.000 description 1
- 230000007515 enzymatic degradation Effects 0.000 description 1
- 210000000981 epithelium Anatomy 0.000 description 1
- 150000002148 esters Chemical class 0.000 description 1
- 238000000605 extraction Methods 0.000 description 1
- 239000003925 fat Substances 0.000 description 1
- 239000007789 gas Substances 0.000 description 1
- PCHJSUWPFVWCPO-UHFFFAOYSA-N gold Chemical compound [Au] PCHJSUWPFVWCPO-UHFFFAOYSA-N 0.000 description 1
- 229910052737 gold Inorganic materials 0.000 description 1
- 239000010931 gold Substances 0.000 description 1
- 230000036541 health Effects 0.000 description 1
- 238000000265 homogenisation Methods 0.000 description 1
- 229920002674 hyaluronan Polymers 0.000 description 1
- 229960003160 hyaluronic acid Drugs 0.000 description 1
- 229960002591 hydroxyproline Drugs 0.000 description 1
- 238000005286 illumination Methods 0.000 description 1
- 230000006872 improvement Effects 0.000 description 1
- 239000012535 impurity Substances 0.000 description 1
- 238000012606 in vitro cell culture Methods 0.000 description 1
- 210000004969 inflammatory cell Anatomy 0.000 description 1
- 238000003780 insertion Methods 0.000 description 1
- 230000037431 insertion Effects 0.000 description 1
- 230000003993 interaction Effects 0.000 description 1
- 230000002452 interceptive effect Effects 0.000 description 1
- 230000003834 intracellular effect Effects 0.000 description 1
- 230000000670 limiting effect Effects 0.000 description 1
- 229940049918 linoleate Drugs 0.000 description 1
- 230000037356 lipid metabolism Effects 0.000 description 1
- PAZHGORSDKKUPI-UHFFFAOYSA-N lithium metasilicate Chemical compound [Li+].[Li+].[O-][Si]([O-])=O PAZHGORSDKKUPI-UHFFFAOYSA-N 0.000 description 1
- 229910052912 lithium silicate Inorganic materials 0.000 description 1
- 230000003211 malignant effect Effects 0.000 description 1
- 230000000873 masking effect Effects 0.000 description 1
- 230000013011 mating Effects 0.000 description 1
- 229910052751 metal Inorganic materials 0.000 description 1
- 239000002184 metal Substances 0.000 description 1
- 238000000386 microscopy Methods 0.000 description 1
- 230000000116 mitigating effect Effects 0.000 description 1
- 238000002156 mixing Methods 0.000 description 1
- 210000001616 monocyte Anatomy 0.000 description 1
- 150000004682 monohydrates Chemical class 0.000 description 1
- 230000004660 morphological change Effects 0.000 description 1
- 238000000491 multivariate analysis Methods 0.000 description 1
- 210000003205 muscle Anatomy 0.000 description 1
- 230000003387 muscular Effects 0.000 description 1
- 208000031225 myocardial ischemia Diseases 0.000 description 1
- 238000002095 near-infrared Raman spectroscopy Methods 0.000 description 1
- 210000000944 nerve tissue Anatomy 0.000 description 1
- 210000000056 organ Anatomy 0.000 description 1
- 229910052763 palladium Inorganic materials 0.000 description 1
- 210000000277 pancreatic duct Anatomy 0.000 description 1
- 230000035515 penetration Effects 0.000 description 1
- 230000002093 peripheral effect Effects 0.000 description 1
- 238000002135 phase contrast microscopy Methods 0.000 description 1
- 230000007505 plaque formation Effects 0.000 description 1
- 229910052913 potassium silicate Inorganic materials 0.000 description 1
- NNHHDJVEYQHLHG-UHFFFAOYSA-N potassium silicate Chemical compound [K+].[K+].[O-][Si]([O-])=O NNHHDJVEYQHLHG-UHFFFAOYSA-N 0.000 description 1
- 235000019353 potassium silicate Nutrition 0.000 description 1
- 230000008569 process Effects 0.000 description 1
- 230000000135 prohibitive effect Effects 0.000 description 1
- 239000010453 quartz Substances 0.000 description 1
- 238000010223 real-time analysis Methods 0.000 description 1
- 238000011160 research Methods 0.000 description 1
- 238000000926 separation method Methods 0.000 description 1
- 239000000377 silicon dioxide Substances 0.000 description 1
- 229910052709 silver Inorganic materials 0.000 description 1
- 239000004332 silver Substances 0.000 description 1
- KKCBUQHMOMHUOY-UHFFFAOYSA-N sodium oxide Chemical compound [O-2].[Na+].[Na+] KKCBUQHMOMHUOY-UHFFFAOYSA-N 0.000 description 1
- 229910001948 sodium oxide Inorganic materials 0.000 description 1
- 241000894007 species Species 0.000 description 1
- 238000010183 spectrum analysis Methods 0.000 description 1
- 238000002560 therapeutic procedure Methods 0.000 description 1
- 230000000451 tissue damage Effects 0.000 description 1
- 231100000827 tissue damage Toxicity 0.000 description 1
- FGMPLJWBKKVCDB-UHFFFAOYSA-N trans-L-hydroxy-proline Natural products ON1CCCC1C(O)=O FGMPLJWBKKVCDB-UHFFFAOYSA-N 0.000 description 1
- 238000012546 transfer Methods 0.000 description 1
- UFTFJSFQGQCHQW-UHFFFAOYSA-N triformin Chemical compound O=COCC(OC=O)COC=O UFTFJSFQGQCHQW-UHFFFAOYSA-N 0.000 description 1
- WFKWXMTUELFFGS-UHFFFAOYSA-N tungsten Chemical compound [W] WFKWXMTUELFFGS-UHFFFAOYSA-N 0.000 description 1
- 229910052721 tungsten Inorganic materials 0.000 description 1
- 239000010937 tungsten Substances 0.000 description 1
Images


Classifications
-
- A—HUMAN NECESSITIES
- A61—MEDICAL OR VETERINARY SCIENCE; HYGIENE
- A61B—DIAGNOSIS; SURGERY; IDENTIFICATION
- A61B5/00—Measuring for diagnostic purposes; Identification of persons
- A61B5/02—Detecting, measuring or recording pulse, heart rate, blood pressure or blood flow; Combined pulse/heart-rate/blood pressure determination; Evaluating a cardiovascular condition not otherwise provided for, e.g. using combinations of techniques provided for in this group with electrocardiography or electroauscultation; Heart catheters for measuring blood pressure
- A61B5/02007—Evaluating blood vessel condition, e.g. elasticity, compliance
-
- A—HUMAN NECESSITIES
- A61—MEDICAL OR VETERINARY SCIENCE; HYGIENE
- A61B—DIAGNOSIS; SURGERY; IDENTIFICATION
- A61B5/00—Measuring for diagnostic purposes; Identification of persons
- A61B5/0059—Measuring for diagnostic purposes; Identification of persons using light, e.g. diagnosis by transillumination, diascopy, fluorescence
- A61B5/0075—Measuring for diagnostic purposes; Identification of persons using light, e.g. diagnosis by transillumination, diascopy, fluorescence by spectroscopy, i.e. measuring spectra, e.g. Raman spectroscopy, infrared absorption spectroscopy
-
- A—HUMAN NECESSITIES
- A61—MEDICAL OR VETERINARY SCIENCE; HYGIENE
- A61B—DIAGNOSIS; SURGERY; IDENTIFICATION
- A61B5/00—Measuring for diagnostic purposes; Identification of persons
- A61B5/0059—Measuring for diagnostic purposes; Identification of persons using light, e.g. diagnosis by transillumination, diascopy, fluorescence
- A61B5/0082—Measuring for diagnostic purposes; Identification of persons using light, e.g. diagnosis by transillumination, diascopy, fluorescence adapted for particular medical purposes
- A61B5/0084—Measuring for diagnostic purposes; Identification of persons using light, e.g. diagnosis by transillumination, diascopy, fluorescence adapted for particular medical purposes for introduction into the body, e.g. by catheters
- A61B5/0086—Measuring for diagnostic purposes; Identification of persons using light, e.g. diagnosis by transillumination, diascopy, fluorescence adapted for particular medical purposes for introduction into the body, e.g. by catheters using infrared radiation
-
- A—HUMAN NECESSITIES
- A61—MEDICAL OR VETERINARY SCIENCE; HYGIENE
- A61B—DIAGNOSIS; SURGERY; IDENTIFICATION
- A61B5/00—Measuring for diagnostic purposes; Identification of persons
- A61B5/0059—Measuring for diagnostic purposes; Identification of persons using light, e.g. diagnosis by transillumination, diascopy, fluorescence
- A61B5/0082—Measuring for diagnostic purposes; Identification of persons using light, e.g. diagnosis by transillumination, diascopy, fluorescence adapted for particular medical purposes
- A61B5/0091—Measuring for diagnostic purposes; Identification of persons using light, e.g. diagnosis by transillumination, diascopy, fluorescence adapted for particular medical purposes for mammography
-
- A—HUMAN NECESSITIES
- A61—MEDICAL OR VETERINARY SCIENCE; HYGIENE
- A61B—DIAGNOSIS; SURGERY; IDENTIFICATION
- A61B5/00—Measuring for diagnostic purposes; Identification of persons
- A61B5/41—Detecting, measuring or recording for evaluating the immune or lymphatic systems
- A61B5/414—Evaluating particular organs or parts of the immune or lymphatic systems
- A61B5/415—Evaluating particular organs or parts of the immune or lymphatic systems the glands, e.g. tonsils, adenoids or thymus
-
- A—HUMAN NECESSITIES
- A61—MEDICAL OR VETERINARY SCIENCE; HYGIENE
- A61B—DIAGNOSIS; SURGERY; IDENTIFICATION
- A61B5/00—Measuring for diagnostic purposes; Identification of persons
- A61B5/43—Detecting, measuring or recording for evaluating the reproductive systems
- A61B5/4306—Detecting, measuring or recording for evaluating the reproductive systems for evaluating the female reproductive systems, e.g. gynaecological evaluations
- A61B5/4312—Breast evaluation or disorder diagnosis
-
- G—PHYSICS
- G01—MEASURING; TESTING
- G01N—INVESTIGATING OR ANALYSING MATERIALS BY DETERMINING THEIR CHEMICAL OR PHYSICAL PROPERTIES
- G01N21/00—Investigating or analysing materials by the use of optical means, i.e. using sub-millimetre waves, infrared, visible or ultraviolet light
- G01N21/17—Systems in which incident light is modified in accordance with the properties of the material investigated
- G01N21/47—Scattering, i.e. diffuse reflection
- G01N21/4738—Diffuse reflection, e.g. also for testing fluids, fibrous materials
- G01N21/474—Details of optical heads therefor, e.g. using optical fibres
-
- G—PHYSICS
- G01—MEASURING; TESTING
- G01N—INVESTIGATING OR ANALYSING MATERIALS BY DETERMINING THEIR CHEMICAL OR PHYSICAL PROPERTIES
- G01N21/00—Investigating or analysing materials by the use of optical means, i.e. using sub-millimetre waves, infrared, visible or ultraviolet light
- G01N21/62—Systems in which the material investigated is excited whereby it emits light or causes a change in wavelength of the incident light
- G01N21/63—Systems in which the material investigated is excited whereby it emits light or causes a change in wavelength of the incident light optically excited
- G01N21/65—Raman scattering
-
- A—HUMAN NECESSITIES
- A61—MEDICAL OR VETERINARY SCIENCE; HYGIENE
- A61B—DIAGNOSIS; SURGERY; IDENTIFICATION
- A61B5/00—Measuring for diagnostic purposes; Identification of persons
- A61B5/0059—Measuring for diagnostic purposes; Identification of persons using light, e.g. diagnosis by transillumination, diascopy, fluorescence
- A61B5/0071—Measuring for diagnostic purposes; Identification of persons using light, e.g. diagnosis by transillumination, diascopy, fluorescence by measuring fluorescence emission
-
- A—HUMAN NECESSITIES
- A61—MEDICAL OR VETERINARY SCIENCE; HYGIENE
- A61B—DIAGNOSIS; SURGERY; IDENTIFICATION
- A61B5/00—Measuring for diagnostic purposes; Identification of persons
- A61B5/45—For evaluating or diagnosing the musculoskeletal system or teeth
- A61B5/4519—Muscles
-
- A—HUMAN NECESSITIES
- A61—MEDICAL OR VETERINARY SCIENCE; HYGIENE
- A61B—DIAGNOSIS; SURGERY; IDENTIFICATION
- A61B5/00—Measuring for diagnostic purposes; Identification of persons
- A61B5/72—Signal processing specially adapted for physiological signals or for diagnostic purposes
- A61B5/7232—Signal processing specially adapted for physiological signals or for diagnostic purposes involving compression of the physiological signal, e.g. to extend the signal recording period
-
- G—PHYSICS
- G01—MEASURING; TESTING
- G01N—INVESTIGATING OR ANALYSING MATERIALS BY DETERMINING THEIR CHEMICAL OR PHYSICAL PROPERTIES
- G01N21/00—Investigating or analysing materials by the use of optical means, i.e. using sub-millimetre waves, infrared, visible or ultraviolet light
- G01N21/17—Systems in which incident light is modified in accordance with the properties of the material investigated
- G01N21/47—Scattering, i.e. diffuse reflection
- G01N21/4738—Diffuse reflection, e.g. also for testing fluids, fibrous materials
- G01N21/474—Details of optical heads therefor, e.g. using optical fibres
- G01N2021/4742—Details of optical heads therefor, e.g. using optical fibres comprising optical fibres
- G01N2021/4745—Fused bundle, i.e. for backscatter
-
- G—PHYSICS
- G01—MEASURING; TESTING
- G01N—INVESTIGATING OR ANALYSING MATERIALS BY DETERMINING THEIR CHEMICAL OR PHYSICAL PROPERTIES
- G01N21/00—Investigating or analysing materials by the use of optical means, i.e. using sub-millimetre waves, infrared, visible or ultraviolet light
- G01N21/17—Systems in which incident light is modified in accordance with the properties of the material investigated
- G01N21/47—Scattering, i.e. diffuse reflection
- G01N21/4738—Diffuse reflection, e.g. also for testing fluids, fibrous materials
- G01N21/474—Details of optical heads therefor, e.g. using optical fibres
- G01N2021/4752—Geometry
- G01N2021/4759—Annular illumination
-
- G—PHYSICS
- G01—MEASURING; TESTING
- G01N—INVESTIGATING OR ANALYSING MATERIALS BY DETERMINING THEIR CHEMICAL OR PHYSICAL PROPERTIES
- G01N21/00—Investigating or analysing materials by the use of optical means, i.e. using sub-millimetre waves, infrared, visible or ultraviolet light
- G01N21/62—Systems in which the material investigated is excited whereby it emits light or causes a change in wavelength of the incident light
- G01N21/63—Systems in which the material investigated is excited whereby it emits light or causes a change in wavelength of the incident light optically excited
- G01N21/65—Raman scattering
- G01N2021/653—Coherent methods [CARS]
- G01N2021/656—Raman microprobe
Definitions
- Optical methods are increasingly being used for the detection of disease.
- Near-infrared Raman spectroscopy in particular, because of its chemical specificity, is proving to be a useful tool for both disease diagnosis and the study of disease progression.
- Raman spectroscopy has been applied to many diseases and biological problems and there have been many advances in-vitro.
- More recently there have been reports of in-vivo work that however have either been confined to studies of skin or other easily accessible organs, or have used optical fiber configurations that require collection times that are unreasonably long for practical clinical use.
- the majority of applications require remote sampling via optical fibers, and the size of the probe and fiber bundle is strictly limited by the application.
- prior art probes for remote Raman sensing using several different methods for filtering out the fiber spectral background, either exhibit extremely low optical throughput or are too bulky to be used intravascularly.
- a problem with the prior art designs includes having a 4 cm long stiff tip that prohibits their incorporation into transcutaneous catheters for accessing the coronary arteries.
- a considerable component of the fiber Raman spectrum still remains. Further, data collection times on the order of 30 seconds or longer are typically required for collection of signals with an acceptable signal to noise ratio (SNR).
- SNR signal to noise ratio
- the system and method of the present invention relates to using spectroscopy, for example, Raman spectroscopic methods for diagnosis of tissue conditions such as vascular disease or cancer.
- spectroscopy for example, Raman spectroscopic methods for diagnosis of tissue conditions such as vascular disease or cancer.
- the system and methods of the present invention have several applications: optical breast biopsies and breast analysis through ductoscopy, percutaneous blood analysis and monitoring, vascular stenosis, gastrointestinal cancer evaluation, scanning for dysplasia in the pancreatic duct and skin analyses.
- a system for measuring tissue includes a fiber optic probe having a proximal end, a distal end, and a diameter of 2 mm or less. This small diameter allows the system to be used for the diagnosis of coronary artery disease or other small lumens or soft tissue with minimal trauma.
- a delivery optical fiber (or fibers) is included in the probe coupled at the proximal end to a light source.
- a filter for the delivery fibers is included at the distal end.
- the system includes a collection optical fiber (or fibers) in the probe that collects Raman scattered radiation from tissue, the collection optical fiber is coupled at the proximal end to a detector.
- a second filter is disposed at the distal end of the collection fibers.
- An optical lens system is disposed at the distal end of the probe including a delivery waveguide coupled to the delivery fiber, a collection waveguide coupled to the collection fiber and a lens.
- the delivery waveguide comprises a rod and the collection waveguide comprises a cylindrical tube, the tube being concentric about the rod.
- the delivery waveguide comprises a first tube and the collection waveguide comprises a second cylindrical tube, the second tube being concentric about the first tube.
- the lens includes a ball lens optically coupled to the delivery fiber and the collection fiber.
- the probe further comprises a sleeve that optically isolates the delivery waveguide from the collection waveguide.
- the sleeve can be metallic, such as palladium, silver or gold.
- the glass rod tube and sleeve can be attached together with an adhesive.
- An outer retaining sleeve can attach the distal optics to the fiber optics.
- the probe further comprises a first plurality of collection fibers arranged concentrically about the delivery fiber at a first radius, and a second plurality of collection fibers arranged concentrically about the delivery fiber at a second radius that is larger than the first radius.
- the probe includes a controller that gates a collection time, the collection time being less than 2 seconds.
- the optical lens system has a length less than 10 mm. In a preferred embodiment, the optical lens system has a length of less than 4 mm.
- the diameter of the distal optical system is preferably in the range of 1-2 mm.
- the optical lens systems delivers and collects radiation in a radial direction, which can be defined as any off-axis direction.
- the light source has a wavelength longer than 750 nm with a preferred embodiment using an argon laser pumped Ti: sapphire laser emitting at 830 nm. In an alternate embodiment a diode laser such as a InGaAs laser emitting at 785 nm or 830 nm may be used.
- the radial Raman probe in accordance with the present invention for use in diagnosing atherosclerosis is incorporated in a catheter of the type used for angiography, for example. It includes a balloon for displacing blood and other fluids and to position the catheter in the artery. A preferred embodiment includes a channel for balloon inflation. Further, the catheter system includes the capability for flushing away the blood temporarily with a fluid, for example, saline.
- One or several optical fibers can be configured so as to direct excitation light in a radial direction, either to the side or at an angle ranging from 45°-90°. In such a preferred embodiment a balloon disposed on the side is used to contact the fibers adjacent the artery wall, and displace blood or other intervening fluids.
- the delivery fibers can be arranged to direct light in a circular pattern at an angle to the axis of the probe.
- the different collection fibers collect light simultaneously from different portions of the circumferential region illuminated.
- the probe is enclosed in an inflatable balloon which is inflated before light delivery and/or collection to displace blood and other fluids.
- the balloon is of a type used in arterial applications, such as, for example, angioplasty, and are made of thin material so as to allow excitation light to pass through to the artery wall, and return Raman light generated in the artery wall to pass through the balloon to the collection fibers.
- the present invention includes the diagnostic classification of atherosclerotic plaques in human coronary arteries by quantitative assessment of their morphologic composition using Raman spectroscopy.
- the rapid and nondestructive nature of Raman spectroscopy provides the opportunity to diagnose coronary artery plaques in-vivo, when applied in a clinical setting using optical fiber technology.
- the preferred embodiments of the present invention classify an atherosclerotic lesion, and can provide in-vivo quantitative assessment of its morphologic features, such as the presence of foam cells (FC), necrotic core (NC), and cholesterol crystals (CC), which may be used to assess plaque instability and the extent of disease progression, and thereby, the risk of life-threatening complications such as thrombosis and acute plaque hemorrhage.
- the methods of the present invention may provide insight into as yet poorly understood dynamics in the evolution of atherosclerotic lesions and the effects of lipid-lowering and other therapies.
- composition and morphology rather than anatomy (degree of stenosis), determine atherosclerotic plaque instability and predict disease progression.
- a modification of the Raman spectroscopy reference data can also be used to identify the microscopic morphologic structures comprising the plaque, and the pathological state of the artery can be accurately assessed using a diagnostic algorithm based on the relative contribution of these microscopic morphological structures to the macroscopic arterial Raman spectrum.
- Atherosclerotic classes are used for comparison with previous studies using the principal component analysis (PCA) and chemical reference data. These eight classes are reduced to three classes. On pathologic examination, the presence of FC, NC, and CC are significant predictors of plaque instability and disease progression. The embodiments of the present invention show that Raman spectroscopic analysis of these same morphologic structures can be used to diagnose atherosclerotic lesions in intact coronary arteries, without the need for microscopic examination.
- Raman spectroscopy can provide not only quantitative chemical information, but also quantitative morphologic information regarding atherosclerotic lesion composition, such as the presence of CC, not readily available in current diagnostic imaging techniques such as intravascular ultrasound (IVUS), magnetic resonance imaging (MRI), and angiography.
- IVUS intravascular ultrasound
- MRI magnetic resonance imaging
- angiography angiography
- the spectral signatures of the cellular and extracellular morphologic components of normal and atherosclerotic arterial tissue in-situ are determined using confocal Raman microspectroscopy.
- the specific morphologic structures are selected because of their role in normal arterial anatomy (e.g. elastic laminae) and/or atherosclerotic plaque formation (e.g. foam cells, necrotic core, cholesterol crystals).
- Least-squares minimization of a linear combination of the basis spectra of 12 biochemical components provide information on the biochemical composition of the various morphologic structures. These biochemical components are selected because they were known to be present in high concentration in normal arterial tissue and/or atherosclerotic plaque (e.g.
- the embodiments of the present invention interpret Raman spectra in terms of morphology.
- the Raman spectra can be associated with a morphological structure, for example, a foam cell which can be associated with specific chemical compounds.
- the number of spectra can be reduced, for example, from a large number of chemical spectra to only eight unique spectra associated with morphological structures thereby decreasing the error in the fit.
- the diagnostics that are available to identify and monitor vulnerable plaque using the optical fiber catheter system of the present invention include the use of chemical composition, information about the morphological structures, thickening of the intimal layer and the thinning of the overlying collagen layer.
- Preferred embodiments include the determination of the depth of collagen by measuring the percentage of collagen. Further, the presence of calcification is monitored and any edges are identified and located relative to the collagen as indicators of a potential rupture and blood clot. Further, the reduced fractional fit contributions of collagen fibers in non-calcified plaques is an indication of decreased plaque stability.
- FIG. 1A graphically illustrates a comparison of theory, simulations and results for Raman emission data of turbid samples of blood tissue for the radial distribution of the Raman scattered light in accordance with a preferred embodiment of the present invention.
- FIG. 1B graphically illustrates a comparison of simulations, theory and results for Raman emission data of turbid samples of blood tissue for angular distribution of the Raman scattered light in accordance with a preferred embodiment of the present invention.
- FIGS. 2 A- 2 C are graphical representations of morphological reference data of coronary arteries for a normal coronary artery, non-calcified plaque and calcified plaque, respectively in accordance with a preferred embodiment of the present invention.
- FIG. 3 is a graphical illustration of Raman morphometry of a coronary artery in accordance with a preferred embodiment of the present invention.
- FIG. 4A is a longitudinal view of an apparatus including a probe for measuring tissue in accordance with a preferred embodiment of the present invention.
- FIG. 4B is a transverse view of the probe illustrated in FIG. 4A in accordance with a preferred embodiment of the present invention.
- FIGS. 4C and 4D are a longitudinal and transverse view respectively of an alternate embodiment of a probe for measuring tissue with a paraboloidal mirror in accordance with the system of the present invention.
- FIG. 5 graphically illustrates the transmission characteristics of the excitation and collection fibers incorporating filters with respect to the Raman shift in accordance with a preferred embodiment of the present invention.
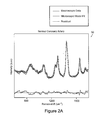
- FIG. 6 graphically illustrates the Raman spectrum of a non-calcified artherosclerotic plaque collected in 1 second with 100 mW excitation power in accordance with a preferred embodiment of the present invention.
- FIG. 7 graphically illustrates the Raman spectrum of a normal artery in accordance with an in-vitro system preferred embodiment of the present invention.
- FIG. 8 is a schematic diagram illustrating a system for measuring tissue in accordance with a preferred embodiment of the present invention.
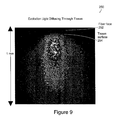
- FIG. 9 illustrates the excitation light diffusing through tissue in accordance with a preferred embodiment of the present invention.
- FIGS. 10 A- 10 C are graphical representations of the integrated radial distributions, integrated angular distributions and optimized collection efficiency for blood tissue, respectively, in accordance with a preferred embodiment of the present invention.
- FIG. 11 is a graphical representation of an excitation spot size in accordance with a preferred embodiment of the present invention.
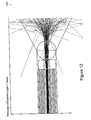
- FIG. 12 is an illustration of a ray diagram of the distribution of excitation light in tissue in accordance with a preferred embodiment of the present invention.
- FIG. 13 is an illustration of a ray diagram of the collection efficiency of a probe in accordance with a preferred embodiment of the present invention.
- FIG. 14 graphically illustrates the collection efficiency of the probe in accordance with a preferred embodiment of the present invention.
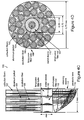
- FIG. 15 is partially sectioned view illustrating a portion of a coronary artery showing a probe in accordance with a preferred embodiment of the present invention.
- FIG. 16 illustrates a signal from a ball lens as a function of laser power in accordance with a preferred embodiment of the present invention.
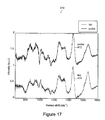
- FIG. 17 graphically illustrates a comparison of data as collected using a probe and an experimental system of a normal aorta in accordance with a preferred embodiment of the present invention.
- FIG. 18 graphically illustrates a Raman spectrum of normal breast issue examined with a probe in accordance with a preferred embodiment of the present invention.
- FIG. 19 graphically illustrates a comparison of Raman spectra of a malignant breast tumor as collected using a probe in accordance with a preferred embodiment of the present invention and as predicted by reference data of the present invention.
- FIG. 20 graphically illustrates a comparison of morphological reference data to calcified aorta data collected with a probe in accordance with a preferred embodiment of the present invention.
- FIGS. 21 A-C illustrate longitudinal views of alternate preferred embodiments of side-viewing probes for measuring tissue in accordance with a system of the present invention.
- FIG. 21D illustrates a view of a preferred embodiment of a side-viewing probe delivering light imaged onto a portion of tissue and Raman light collected from the tissue in accordance with a preferred embodiment of the present invention.
- FIG. 22 is a schematic illustration of a combined Raman macrospectroscopy and confocal microspectroscopy system in accordance with a preferred embodiment of the present invention.
- FIG. 23 graphically illustrates the Raman spectra of eight selected coronary artery morphological structures in accordance with a preferred embodiment of the present invention.
- FIGS. 24 A- 24 C graphically illustrate the results of the fit contribution of seven morphologic structures to the calibration data set and the diagnostic algorithm classification wherein FIG. 24A illustrates nonatherosclerotic tissue, FIG. 24B illustrates noncalcified atherosclerotic plaque and FIG. 24C illustrates calcified atherosclerotic plaque in accordance with a preferred embodiment of the present invention.
- FIG. 25 illustrates the spectral contribution of ⁇ -carotene in a calibration data set in relation to three diagnostic categories, wherein the carotenoid level is expressed in arbitrary units in accordance with a preferred embodiment of the present invention.
- FIGS. 26A and 26B graphically illustrate the results of the algorithm developed with an initial calibration data set and the results of the prospective validation data set, respectively, in accordance with a preferred embodiment of the present invention.
- FIG. 27 is a schematic diagram of a system including a confocal Raman microspectrometer in accordance with a preferred embodiment of the present invention.
- FIGS. 28A and 28B are a photomicrograph of internal elastic lamina in a 6- ⁇ m unstained coronary artery section viewed under phase contrast and the Raman spectrum of the internal elastic lamina, respectively, in accordance with a preferred embodiment of the present invention.
- FIGS. 29A and 29B are a photomicrograph of the tunica adventitia with collagen fibers in a 6- ⁇ m unstained coronary artery section viewed under phase contrast and the Raman spectrum of the fibers, respectively, in accordance with a preferred embodiment of the present invention.
- FIG. 30 graphically illustrates the Raman spectra of four different smooth muscle cells in the tunica media in accordance with a preferred embodiment of the present invention.
- FIG. 31 graphically illustrates the Raman spectra of four fat cells (adipocytes) in the tunica adventitia in accordance with a preferred embodiment of the present invention.
- FIGS. 32A and 32B are a photomicrograph of foam cells in an intimal athersclerotic plaque in a 6- ⁇ m unstained coronary artery section viewed under phase contrast and a Raman spectra of the foam cells and necrotic core, respectively, in accordance with a preferred embodiment of the present invention.
- FIG. 33 graphically illustrates the Raman spectra of cholesterol crystals in intimal atherosclerotic plaques in accordance with a preferred embodiment of the present invention.
- FIGS. 34A and 34B are a photomicrograph of the calcification in the necrotic core of an intimal atherosclerotic plaque in a 6- ⁇ m unstained coronary artery section viewed under phase contrast and the corresponding Raman spectra in accordance with a preferred embodiment of the present invention.
- FIG. 35 graphically illustrates a Raman basis spectra of the 12 biochemicals used for linear fitting to the morphologic spectra in accordance with a preferred embodiment of the present invention.
- FIGS. 36 A- 36 H provide a graphical comparison between observed data and reference data of spectra of the different morphological structures in the coronary artery in accordance with a preferred embodiment of the present invention.
- FIGS. 37 A- 37 H graphically illustrate the biochemical composition of each morphologic structure in accordance with a preferred embodiment of the present invention.
- FIG. 38A graphically illustrates the results for Raman emission data of turbid samples of artery tissue for the radial distribution of the Raman scattered light in accordance with a preferred embodiment of the present invention.
- FIG. 38B graphically illustrates the results for Raman emission data of turbid samples of artery tissue for angular distribution of the Raman scattered light in accordance with a preferred embodiment of the present invention.
- FIGS. 38 C- 38 E are graphical representations of integrated radial distributions, integrated angular distributions and optimized collection efficiency of artery tissue, respectively, in accordance with a preferred embodiment of the present invention.
- the present invention is directed to systems and methods for using Raman spectroscopy of tissue.
- a predicate for developing systems and methods for in-vivo applications using angiographic catheters to aid cardiologists in directing the appropriate treatment is the development of optical fiber probes for Raman spectroscopy capable of delivering low energy laser light to, and efficiently collecting the resulting Raman spectral signature from, in-vivo tissue.
- the probes in preferred embodiments are small, and use micro-optical design principles.
- the first is due to the spectral background signal generated in the delivery and collection fibers themselves, which may be orders of magnitude larger than the signal from the tissue site being examined.
- This background signal includes Raman light from the fused silica core, fluorescence from impurities and dopants used to design fibers of a particular numerical aperture (NA), as well as signal from various jacket materials.
- Laser light in the delivery fibers generates an intense fiber background due to the long path length traversed in the fibers, typically three to four meters. This fiber spectrum is scattered from the tissue surface and is collected, along with the tissue Raman spectrum, by the collection fibers, often masking the tissue Raman signal which is generated from only approximately 1 mm of sample due to the relatively short penetration of light into tissue.
- the collection fibers can be preceded by a long wavelength pass filter or notch filter which transmits the tissue Raman spectrum while blocking laser light backscattered from the tissue. Any filters used also perform the appropriate function over a range of angles corresponding to the acceptance angle (NA) of the fibers they are coupled to.
- NA acceptance angle
- the second difficulty is related to signal collection.
- This has two components, the first of which pertains to the inherently weak nature of the Raman effect. Approximately only one out of every billion excitation photons are converted into a Raman photon.
- a high-throughput optical probe apparatus collects signals with sufficient signal-to-noise ratio (SNR) to be useful in a clinically realistic timeframe. To be clinically useful and commercially viable, a preferred embodiment collects high SNR spectra in approximately 1-2 seconds.
- SNR signal-to-noise ratio
- the second component also addresses optimization of collection which is further compromised by absorption and scattering in the tissue which results in causing the light to be widely diffused over large areas and angles.
- the collection ability of an optical system is limited by its throughput, approximately given by the product of area of collection (A) and solid angle ( ⁇ ) (A ⁇ -product).
- a ⁇ product is conserved throughout the system.
- throughput is determined by the spectrograph/CCD collection detection system.
- a CCD detector is used to ensure that the effective Raman source generated in the tissue by the incident excitation light, no matter how bright, is optimally collected.
- the light is considered to be emitted over a large area and 4 ⁇ solid angle but is limited by the collection angle 27 ⁇ . Therefore the optimal trade-off between collection solid angle and area is determined in preferred embodiments of the present invention.
- the spectrograph/CCD is replaced by a higher throughput system.
- a higher throughput system consists of a series of dichroic beam-splitters, filters and photodiodes.
- the filter wavelengths are determined to optimize multivariate spectral analysis with the minimum number of wavelengths.
- the exact number of wavelengths and bandwidths of the detector element depend on the spectral features of the chemical/morphological structures to be sensed.
- FIGS. 1A and 1B graphically illustrate a comparison of theory, simulations and results for Raman emission data of turbid samples of blood tissue for radial and angular distribution, respectively, of the Raman scattered light in accordance with a preferred embodiment of the present invention.
- Biological tissue is a collection of similar cells and the intercellular substances surrounding them.
- the four basic tissues in the body include epithelium tissue; connective tissues including blood, bone, and cartilage; muscle tissue; and nerve tissue.
- Most tissues with the exception of the cornea, are turbid, as they exhibit a high degree of elastic scattering, due to microscopic structures and refractive index variations contained therein and thus light entering such tissue is greatly diffused.
- the samples are characterized as turbid samples in FIGS.
- simulations such as, for example, Monte Carlo simulations are performed to predict the spatial and radial distribution of both the excitation and the Raman scattered light.
- the radial distribution is approximately Gaussian as shown in FIG. 1A, while the angular distribution is Lambertian as shown in FIG. 1B.
- the optimal collection area and angles are determined. It should be recognized that the product A ⁇ is a constant and choosing the optimal combination of A and ⁇ is important as shown in FIGS. 10 A- 10 C.
- collection parameters of approximately 0.35 mm radius and 55° are optimal for blood tissue.
- the optimal collection parameters for artery tissue are approximately 0.4 mm radius and 20°.
- the results of the analyses are then incorporated into an optical design program such as, for example, Zemax program to determine appropriate optics for maximal signal collection.
- FIG. 38A graphically illustrates the results for Raman emission data 1360 of turbid samples of artery tissue in contrast to blood tissue described with respect to FIG. 1A for the radial distribution of the excitation and Raman scattered light in accordance with a preferred embodiment of the present invention.
- the curve 1362 illustrates the fit using a three Gaussian fit.
- FIG. 38B graphically illustrates the results for Raman emission data 1360 of turbid samples of artery tissue for angular distribution of the excitation and Raman scattered light in accordance with a preferred embodiment of the present invention.
- FIGS. 38 C- 38 E are graphical representations of integrated radial distributions, integrated angular distributions and optimized collection efficiency for artery tissue, respectively, in accordance with a preferred embodiment of the present invention.
- Optical elements are used to transfer the light collected from the tissue to the distal end of optical fibers in the probe.
- the proximal end of the fiber bundle is then re-shaped to match the shape, area, and NA of the spectrograph. These procedures are followed so as not to decrease light transmission efficiency, and provide effective coupling.
- the choice of collection fiber NA and collection fiber diameter is determined by the spectrometer NA, the desired spectral resolution, and considerations of matching optics, as well as the limitation set by filter acceptance angle.
- the trade-offs for the system include the spectrometer chosen, and the desired resolution determines a slit width.
- the collection fibers are arranged in a straight line, which is imaged onto the entrance slit by the matching optics.
- the requirement on the collection fibers includes that the product of fiber NA and diameter equal the product of spectrometer NA and slit width. If a fiber is chosen which satisfies the stronger condition that the fiber diameter equals the slit width and the fiber NA equals the spectrometer NA, the necessity of using matching optics is eliminated and the probe is directly coupled into the spectrometer. If only the product requirement can be satisfied then matching optics are needed.
- spectrometers use curved slits, and the output end of the collection fibers can be modified to match any slit shape.
- An upper limit on the number of collection fibers is defined by the height of the fiber array image that is less than the slit height or CCD chip, whichever is less. However a smaller limitation may be set by the space available in the collection tip.
- FIGS. 2 A- 2 C are graphical representations 30 , 40 , 50 of the morphological models and references of the coronary artery in accordance with a preferred embodiment of the system.
- the studies use biochemical composition in determining plaque stability and plaque progression.
- the morphological factors are discussed in “Raman microspectroscopy of human coronary atherosclerosis: Biochemical assessment of cellular and extracellular morphologic structures in-situ” by Hendrik P. Buschman et al, as published in Cardiovascular Pathology 10 (2001) 69-82 and “Diagnosis of human coronary atherosclerosis by morphology-based Raman spectroscopy” by Hendrik P. Buschman et al, as published in Cardiovascular Pathology 10 (2001) 59-68, the entire teachings of which are incorporated herein by reference.
- FIG. 3 is a graphical illustration 60 of Raman morphometry of a coronary artery in accordance with a preferred embodiment of the present invention. The relative fit coefficients are plotted against different conditions in the normal artery, artery having non-calcified plaque and calcified plaque.
- all of the parameters such as, for example, but not limited to optical filtering and high-throughput optics designed to collect from diffuse sources is accomplished without increasing the diameter of the tip, or compromising its flexibility.
- Many prior art commercial probes are designed to be used with 785 nm excitation.
- the methods of the present invention include the recognition that the fluorescence background generated in tissue with 785 nm excitation is at least four times greater than that generated with 830 nm excitation. Operating at 785 nm necessitates longer data acquisition times that is prohibitive for in-vivo applications. The longer the wavelength of operation, the better in terms of fluorescence background.
- the use of 830 nm is governed by the fundamental long wavelength limit (1100 nm) of the silicon based charge coupled device (CCD) detectors which is governed by the silicon band gap.
- CCD charge coupled device
- a preferred embodiment of the present invention includes an optical fiber Raman probe which removes the optical fiber background, limits the length of the rigid distal tip to less than a few mm and the diameter to about two mm, for example, to facilitate use in coronary artery catheterization, employs 830 nm excitation and, maximizes signal collection from diffuse sources in order to allow data collection times of a few seconds or less.
- a preferred embodiment includes a rod and tube configuration in which the rod and tube of optical filter modules are coated separately which is easier than coating a single disc having two separate coatings: one in the center to filter the excitation light, and one at the edges to filter the collected light.
- These embodiments are preferable to coating individual fibers because the filter can adhere better due to the increased surface area.
- a two-tone disc is preferable to coating a single disc because it is difficult to deposit concentric coatings on a small diameter with a smooth circular interface without gaps or overlapping regions. Further, it is difficult to place three meter fiber lengths in deposition coating chambers.
- Each filter can include a stack of dielectric thin films. Such thin film filters can be fabricated by Research Electro-Optics Inc., Boulder, Colo.
- FIGS. 4 A- 4 B show a longitudinal and transverse view, respectively, of a preferred embodiment apparatus including a Raman probe.
- the apparatus 70 includes a two piece multiple, for example, dual wavelength micro-optical dielectric filter module for minimizing and preferably eliminating fiber Raman background in the delivery and collection fibers.
- This module consists of a rod 82 carrying the excitation dielectric filter coating on one plane face, fitted into the tube 78 carrying the collection dielectric coating on one plane face of the tube.
- Rods and tubes are used in the embodiment that are made of either sapphire or fused silica which are separately coated with their respective filters prior to assembly.
- the rod is wrapped or coated with a thin sheet of metal 80 to provide optical isolation between the components.
- the module is then placed at the distal end of the probe between the fiber bundles and a lens system for collimating the light beams having a lens 86 such as, for example, a ball lens.
- a lens 86 such as, for example, a ball lens.
- the lens collects light from high angles and a large area effectively overlapping excitation and collection regions.
- the ball lens can be fabricated and supplied by Edmund Industrial Optics, New Jersey.
- sapphire lenses that are coated with anti-reflection coatings and having an appropriate index for angular acceptance, for example, 1.77 is fabricated by MK Photonics, Albuquerque, N. Mex.
- the filter size can be adjusted to create smaller diameter probes for various applications.
- the filters are deposited on sapphire or quartz rods and tubes for proper registration with fibers.
- FIGS. 4C and 4D show a longitudinal and transverse view, respectively, of an alternate preferred embodiment having a paraboloidal mirror disposed in the lens system.
- the collection angle can be in the range of 0 to approximately 55° with a collection diameter of approximately 1 mm.
- the paraboloidal mirror collects light from a wider angle and a larger area.
- the choice of fiber diameter and numerical aperture (NA), is dictated by the following considerations, for example, that the fiber Raman signal (produces unwanted background) is proportional to the square of the NA, and independent of the fiber diameter, that low NA is better, and that diameter has no effect.
- the excitation fiber using a lower NA fiber is useful, however there are issues to contend with. At the input end it makes coupling the energy into the fiber more difficult. In a preferred embodiment, when exciting with a laser with a low beam divergence, reasonable care in mounting the fiber and the matching optics avoids this problem. At the output end the beam is more confined. This makes the filter construction simpler and more efficient, but illuminating a larger area in order to minimize the potential of tissue damage due to confining the power of the incident beam to a smaller area (spot) can also be important.
- a larger diameter fiber, or a distributed array of smaller fibers is used. Preferred embodiments balance the fact that low NA fibers typically exhibit an increased spectral background caused by dopants used in the core and cladding of the fiber to reduce the NA, and hence, use a modest core size and NA for the excitation fiber.
- the Raman energy collected is proportional to the square of the NA. Therefore, from a signal-to-background analysis there is an advantage in using high NA collection fibers the size of which is limited by the spectrograph NA.
- the best choice of fiber NA and fiber diameter is determined by the spectrometer NA, the desired spectral resolution, and considerations of matching optics, as well as the limitation set by filter acceptance angle.
- one or a few number of delivery fibers are used as the energy of the laser source can be efficiently coupled into the delivery fiber/fibers. However, a greater number of collection fibers is important to increase the area of collection as shown in FIG. 4B.
- the area for collection is maximized since it is important to optimize collection of Raman light. Taking all these considerations into account, it is best to use as much of the available cross-sectional area of the optical fiber probe for collection fibers, keeping the number and diameter of the delivery fiber(s) to a minimum.
- Preferred embodiments include the following trade-offs.
- the desired resolution determines a slit width.
- the requirement on the collection fibers is that the product of fiber NA and diameter equal the product of spectrometer NA and slit width. If it is possible to choose a fiber which satisfies the stronger condition that the fiber diameter equals the slit width and the fiber NA equals the spectrometer NA, the necessity of using matching optics is eliminated and the probe can be directly coupled into the spectrometer. If only the product requirement can be satisfied then matching optics are needed. At the output end the collection fibers are arranged in a straight line, which is imaged onto the entrance slit by the matching optics.
- the output end of the collection fibers can be modified to match any slit shape.
- An upper limit on the number of collection fibers is that the height of the fiber array image be less than the slit height or CCD chip, whichever is less. However a smaller limitation may be set by the space available in the collection tip.
- the fiber section of the probe includes a single central excitation fiber with an NA of 0.22 and a core diameter of 200 ⁇ m.
- the buffer of the fiber is matched to the diameter of the excitation filter rod, to facilitate proper fiber/filter registration, and has an aluminum jacket to provide optical isolation from the collection fibers.
- the 200 ⁇ m core diameter collection fibers are arranged in two different geometries in two alternate embodiments.
- the first embodiment consists of two concentric rings of 10 and 17 fibers for the inner and outer ring, respectively.
- the second embodiment has a single ring of 15 collection fibers. Although the second design has a slightly reduced collection efficiency, it is more flexible and still able to collect a high SNR spectra in short exposure times.
- the collection fibers all have an NA of 0.26 so that they are f/#-matched to the spectrograph for optimal throughput as illustrated in FIGS. 4 A- 4 D.
- the diameter of the probe in a preferred embodiment is less than 2 mm for access to coronary arteries.
- a preferred embodiment provides flexibility with respect to the particular choice of optics for high-throughput collection so that a variety of optical elements can be used to collect the desired A ⁇ -product.
- a ball lens provides highly efficient collection for front viewing optical fiber probes that closely match calculated collection over a radius of 0.35 mm for blood tissue (0.4 mm for artery tissue) while still collecting over large angles as shown in FIGS. 1 A- 1 B and 4 A- 4 B. Collection efficiencies greater than 30% are achieved if a small space is maintained between the sample and lens, greater than 10% when in contact with tissue, the likely and more reproducible in-vivo geometry.
- FIG. 6 which shows the Raman spectrum of a non-calcified atherosclerotic plaque collected in 1 second with 100 mW excitation power.
- FIG. 7 shows the spectrum of a normal artery taken with another preferred embodiment system in 10 seconds with the same excitation power.
- FIG. 8 is a schematic diagram illustrating a system for measuring tissue in accordance with a preferred embodiment of the present invention.
- a light source 206 emitting at a wavelength longer than 750 nm, such as an argon pumped Ti: sapphire laser system or a diode laser is used.
- the diode laser may be an InGaAs laser emitting at 785 nm or 830 nm, such as, for example, fabricated by Process Instruments, Salt Lake City, Utah.
- the laser output is band pass-filtered and is coupled into the delivery optical fibers which are included in the probe 204 .
- the probe 204 is inserted into an artery 202 to diagnose and possibly treat the buildup of, for example, plaque in the artery.
- the system may include a guidewire, and a guide catheter for threading through the large arteries.
- the guide wire in an artery that is partially blocked by fatty material 416 , the guide wire is first extended into the artery followed by the catheter which includes the balloon 420 .
- a probe assembly is housed in the tip of the catheter and has a collection window 418 . Once the balloon has entered the artery 414 , the probe assembly provides a surgeon with a cross-sectional view of the artery. The balloon temporarily blocks blood flow providing a clear field of view, stabilizes the probe and minimizes effects of cardiac motion.
- Fluoroscopic markers may be used in preferred embodiments.
- the light is incident on the tissue and Raman-scattered light from the tissue is collected by the collection optical fibers.
- the collected light is notch-filtered and projected onto an entrance slot of a spectrophotometer.
- the notch filter removes Rayleigh—scattered laser light.
- a grating disperses light onto a CCD detector 228 .
- the CCD interface and data storage and processing is provided in a computer such as a personal computer.
- a program such as Winspec Software provided by Princeton Instruments can be used to connect the CCD interface to the personal computer which performs the data processing and storage function.
- the Labview program by National Instruments, Austin, Tex., is used to connect the CCD interface to the personal computer.
- Raman signals are read from the CCD, collected by the computer and stored on a computer readable media for later analysis or may be used for real time analysis in a clinical setting.
- FIGS. 10 A- 10 C are graphical representations of the integrated radial distributions, integrated angular distributions and optimized collection efficiency, respectively, for blood tissue in accordance with a preferred embodiment of the present invention.
- FIG. 10C illustrates the collection efficiency by varying A and ⁇ illustrated in FIGS. 10A and 10B, respectively, but keeping the product A ⁇ constant and equal to that of the spectrograph. By the throughput theorem, the étendue is conserved where étendue is the product of area and solid angle.
- the radial and angular distributions are integrated and their product determines the optimization curve 300 .
- the collection optics are designed to perform at the maximum of the efficiency curve 300 . Similar graphical illustrations for artery tissue are provided in FIGS. 38 C- 38 E.
- FIG. 11 is a graphical representation 320 of an excitation spot diameter in accordance with a preferred embodiment of the present invention.
- FIG. 12 is an illustration of a ray diagram 340 of the distribution of excitation light in tissue in accordance with a preferred embodiment of the present invention.
- FIG. 13 is an illustration of a ray diagram 360 of the collection efficiency of a probe in accordance with a preferred embodiment of the present invention.
- FIG. 14 graphically illustrates the collection efficiency of the probe in accordance with a preferred embodiment of the present invention. The efficiency from a measured distribution for tissue and air is illustrated. All components of the probe are constructed of medical grade materials that can withstand standard cold gas, ethylene oxide sterilization. Alternate sterilization methods as provided by Steris Corporation of Ohio can be used such as, for example, a low temperature sterile processing system.
- the filter module in the probe tip is assembled and attached to the fiber bundle using high purity sodium silicate as an index matching cement. The advantages of sodium silicate as an index matching cement in Raman spectroscopy are unique and its utility goes beyond the present application.
- the advantages include producing no interfering Raman spectrum, having an index of refraction close to that of fused silica, thereby greatly reducing the reflection losses from mating surfaces, having a low optical absorption in the near IR, so it introduces no appreciable absorption losses, having cementing properties that facilitate the assembly of the small optical components involved, and it is an article accepted in commerce with uses in many industrial applications.
- Sodium silicate is a ternary compound, created by mixing various combinations of water, silicon dioxide and sodium hydroxide, in the alternative sodium oxide. The optical and mechanical properties of the end product can be adjusted by varying these ratios.
- the other alkali silicates have similar properties, for example, lithium silicate, potassium silicate and can also be used in certain applications.
- the lens is secured with a crimped retaining sleeve and sealed with medical grade epoxy to prevent fluid from leaking into the probe tip in accordance with a preferred embodiment of the present invention.
- the modular nature of the preferred embodiment probe is very versatile and can accommodate many optical embodiments. Additional embodiments for side-viewing probes as well as other front viewing embodiments for alternate applications are included in the systems of the present invention. For example the use of an angled and mirrored ball lens, a prism, or a micro-optical paraboloidal mirror allows efficient side-viewing probes.
- a tapered tip allows incorporation into needle probes for optical breast biopsies and a slightly smaller diameter in an alternate preferred embodiment allows breast analysis through ductoscopy.
- Other potential uses are for skin analysis, transcutaneous blood analyte monitoring, and gastrointestinal cancer evaluation.
- FIG. 16 illustrates a signal 450 from a ball lens and function of laser power in accordance with a preferred embodiment of the present invention.
- the front-viewing Raman probe uses a sapphire ball lens to focus the excitation light and to collect the Raman signal from the tissue.
- the Raman spectrum from the sapphire lens can be used as an internal standard to calibrate collected signals relative to the excitation laser power, thereby obtaining intensity information. This intensity information is not typically exploited in biological Raman spectroscopy, but can provide enhanced diagnostic power.
- the graphical plot is generated using data taken with a preferred embodiment Raman probe and a clinical Raman system and represents the magnitude of the signal from the sapphire lens as a function of excitation power while the probe is held in the air. It is indicative of a natural internal standard for measuring power delivered to tissue using a preferred embodiment of the present invention.
- FIG. 17 graphically illustrates a comparison of data from a normal artery collected using a preferred embodiment probe 472 and an experimental system 474 .
- SNR signal-to-noise ratio
- FIG. 18 graphically illustrates a Raman spectrum 490 of normal breast tissue examined with a probe in accordance with the present invention. Tissues other than an artery have been examined to demonstrate that the probes have multiple uses for disease diagnosis. The probes can be used in ductoscopy procedures for early diagnosis of breast cancer.
- FIG. 19 graphically illustrates a comparison of Raman spectra of a breast tumor which is diagnosed as being malignant in accordance with a preferred embodiment of the present invention and as predicted by reference data of the present invention.
- the data 502 as collected using a preferred embodiment probe is compared to data 504 generated by reference data.
- the reference data coefficients are tabulated in Table 1.
- FIG. 20 graphically illustrates a comparison of morphological reference data to calcified aorta data collected using a probe in accordance with a preferred embodiment of the present invention.
- FIG. 20 illustrates the Raman spectrum 522 of a calcified aorta obtained with the Raman probe and a clinical Raman system in 1 second with 100 mW excitation power. A fit with morphological reference data is shown as spectrum 524 .
- the residual spectrum 526 is plotted below on the same scale. The lack of features in the residual indicate a high level of agreement between the observed data and referenced data, proving that the reference data in accordance with preferred embodiments of the present invention developed with the experimental in-vitro system can be applied to data taken with the preferred embodiment Raman probes.
- the Raman spectra obtained from diseased artery does not diffuse as much in comparison to spectra obtained from normal artery, thus providing a spectra with a better level of signal-to-noise ratio (SNR). It should be noted that the SNR is affected by both Raman cross-sections of the tissue and the distribution of light.
- the non-axial Raman probe in accordance with the present invention for use in diagnosing atherosclerosis is incorporated in a catheter of the type used for angiography, for example. It includes a balloon for displacing blood and other fluids and to position the catheter in the artery. A preferred embodiment includes a channel for balloon inflation. Further, the catheter system includes the capability for flushing away the blood temporarily with a fluid, for example, saline.
- One or several optical fibers can be configured so as to direct excitation light in a non-axial direction, either to the side or at an angle ranging from 45°-90°. In such a preferred embodiment a balloon disposed on the side is used to contact the fibers adjacent the artery wall, and displace blood or other intervening fluids.
- the delivery fibers can be arranged to direct light in a circular pattern at an angle to the axis of the probe.
- the different collection fibers collect light simultaneously from different portions of the circumferential region illuminated.
- the probe is enclosed in an inflatable balloon which is inflated before light delivery and/or collection to displace blood and other fluids.
- the balloon is of a type used in arterial applications, such as, for example, angioplasty, and are made of thin material so as to allow excitation light to pass through to the artery wall, and return Raman light generated in the artery wall to pass through the balloon to the collection fibers.
- FIG. 21A illustrates a longitudinal view 550 of an alternate preferred embodiment of the side-viewing probe for measuring tissue in accordance with a system of the present invention.
- the embodiment includes a modified axicon 556 in which the surfaces of the angled sides are made elliptical.
- FIGS. 21B and 21C are preferred alternate embodiments including at least two different radii of curvature on the angled surface to provide circumferential imaging.
- Circumferential imaging can be obtained in an embodiment by providing beams ranging from approximately 45°-90° angle and rotating the probe to get a circumferential image.
- delivery fibers can provide light to the tissue and image, such as, for example, six images are collected in collection fibers to get a circumferential image.
- the volume between the filters 554 and the angled portion of the axicon 556 comprises solid glass, preferably sapphire wherein the redirection of light occurs via total internal reflection.
- the angled surfaces 562 of the axicon 556 are mirrored which allow for reflections.
- the laser light is directed radially or non-axially onto the tissue 564 .
- the surface 565 is elliptical and fabricated using sapphire.
- the volume between the filters 554 and the axicon 556 may either be filled or empty.
- This embodiment as illustrated in FIG. 21C provides an open central channel 558 , 566 that can be used for flushing fluid, for example, saline into the artery or to inflate a balloon to temporarily block blood flow while data for a spectrum is being acquired.
- the probe includes placing several excitation fibers around the circumference of the central channel.
- the foci of the axicon can be adjusted.
- the rod-in-tube geometry of filters described in previous embodiments are modified to a tube-in-tube geometry, i.e., a central tube for the excitation filters with a hole in the middle for the central channel and an outer tube for the collection filters.
- FIG. 21D illustrates a view of a preferred embodiment of a side-viewing probe, or non-axial viewing probe, and catheter 610 delivering light onto a portion of tissue 612 and Raman light collected from the tissue and reimaged on a point at a second surface in accordance with a preferred embodiment of the present invention.
- the side-viewing probe includes an inflatable balloon 614 or flexible wire installed adjacent the side-looking element across from its viewing aperture. Upon balloon inflation or wire inflexion, the aperture is pressed into contact with the artery wall 616 displacing blood and/or establishing a well-defined collection geometry.
- IVUS intravascular ultrasound
- MRI magnetic resonance imaging
- angiography provide predominantly anatomic information about the extent of luminal stenosis, but yield only limited information about lesion composition.
- Coronary angiography still the “gold standard” for diagnosing coronary artery disease, shows the degree of luminal stenosis, but provides no chemical or morphologic information about the plaque.
- unstable atherosclerotic plaques are often “silent” on angiography.
- IVUS the most accurate and quantitative technique currently in clinical use, uses the reflection of acoustical waves delivered by an intravascular catheter to probe tissue density and provide imaging information.
- the preferred embodiment of the present invention includes a method for a morphology-based diagnosis of atherosclerosis in the coronary arteries using Raman spectroscopy that can potentially be performed in-vivo using optical fiber technology.
- Raman spectra from the elastic laminae (EL), collagen fibers (CF), smooth muscle cells (SMC), adventitial adipocytes (AA) or fat cells, foam cells (FC), necrotic core (NC), cholesterol crystals (CC), ⁇ -carotene containing crystals ( ⁇ -C), and calcium mineralizations (CM) are used as basis spectra in a linear least squares-minimization (LSM) model to calculate the contribution of these morphologic structures to the coronary artery tissue spectra.
- LSM linear least squares-minimization
- the preferred embodiment includes a diagnostic sequence of instructions that uses the fit-contributions of the various morphologic structures to classify 97 coronary artery samples in an initial calibration data set as either nonatherosclerotic, calcified plaque, or noncalcified atheromatous plaque.
- the sequence of instructions correctly classifies 64 (94%) of 68 coronary artery samples prospectively.
- Raman spectroscopy provides information about the morphologic composition of intact human coronary artery without the need for excision and microscopic examination.
- a preferred embodiment uses Raman spectroscopy to analyze the morphologic composition of atherosclerotic coronary artery lesions and assess plaque instability and disease progression in-vivo.
- the present invention includes acquiring quantitative morphologic information regarding lesion composition from coronary arteries by Raman spectroscopy using a modification of mathematical reference data. This morphologic information can be used for diagnostic purposes.
- the chemical and morphologic information obtained by Raman spectroscopy can be the basis of a diagnostic assessment of human coronary artery disease.
- both quantitative chemical and morphologic information regarding atherosclerotic lesion composition can be obtained from the same Raman spectrum.
- a preferred embodiment of the present invention analyzes coronary artery tissue by modeling of Raman tissue spectra using the spectra of morphologic structures rather than biochemical components as a basis set.
- Basis spectra for the reference data are obtained from morphologic structures commonly observed in the normal artery wall and in atherosclerotic plaque, including collagen fibers (CF), the internal and external elastic laminae (EL), smooth muscle cells (SMC), adventitial adipocytes (AA) or fat cells, foam cells (FC), necrotic core (NC), cholesterol crystals (CC), ⁇ -carotene containing crystals ( ⁇ -C), and calcium mineralizations (CM). These basis spectra can then be used to linearly fit the spectra of an initial calibration set of coronary artery specimens.
- collagen fibers CF
- EL internal and external elastic laminae
- SMC smooth muscle cells
- AA adventitial adipocytes
- AA adventitial adipocytes
- AA adventitial adipocytes
- FC foam cells
- NC necrotic core
- CC cholesterol crystals
- ⁇ -C ⁇ -carotene containing crystals
- CM calcium mineralizations
- an algorithm is included in a preferred embodiment that classifies the arteries as atherosclerotic or nonatherosclerotic as in a biochemical model.
- the diagnostic performance of the preferred embodiment can be tested by applying morphology-based reference data, to a second, prospective, validation set of coronary arteries.
- transverse tissue sections (6-8 ⁇ m) were cut from the coronary artery samples. Four sections of each sample were mounted on glass microscope slides and stained for light microscopic examination, whereas serial unstained transverse sections were mounted on BaF 2 or MgF 2 flats (International Scientific Products, Tarrytown, N.Y. and Spectra-Tech, Stamford, Conn.), kept moist with phosphate buffered saline (pH 7.4), and transferred to the microscopic stage for spectroscopic experiments. No coverslip was used. Under white light illumination, the major morphologic structures were selected and recorded on videotape under ⁇ 10 and ⁇ 63 magnification.
- NIR near-infrared
- sapphire laser system 572, 574 Ar + -pumped Ti: sapphire laser system 572, 574 (Coherent Innova 90/Spectra Physics 3900S, Coherent, Santa Clara, Calif.).
- the laser output is band pass-filtered (Kaiser Optical Systems HLBF, Ann Arbor, Mich.) and, by insertion of a prism 578, either projected onto the tissue sample in the macroscopic setup, or projected into a confocal microscope 600 and focused onto the tissue section with a ⁇ 63 infinitely corrected water immersion objective (Zeiss Achroplan, NA 0.9).
- Raman-scattered light from the tissue is collected with a lens, Notch-filtered 588 , and focused onto the entrance slit of a Chromex 250IS/SM spectrophotometer (Chromex, Albuquerque, N. Mex.).
- the Raman light scattered from the tissue is collected with the same objective that is used to focus light onto the sample, passed through a pinhole (giving the system its confocal characteristic), Notch-filtered, and projected onto the entrance slit of the spectrophotometer.
- a grating disperses light onto a deep-depletion CCD detector 582 (Princeton Instruments, Princeton, N.J.) cooled to ⁇ 110° C.
- the CCD interface ST130, Princeton Instruments
- data storage and processing is rendered on a personal computer 584 .
- the laser power is 350 mW, and the signal collection time is in the range 10-100 s.
- the laser power is 80-120 mW, and the signal collection time is 60-360 s, and the Raman spectra is collected in the range between 400 and 2000 cm ⁇ 1 (resolution 8 cm ⁇ 1 ).
- Each spectrum is frequency-calibrated and corrected for chromatic variations in spectrometer system detection.
- a fourth-order polynomial is fit to each spectrum and subtracted from the spectrum to correct for remaining tissue fluorescence.
- the macroscopic tissue spectra can be modeled in the 680-1800 cm ⁇ 1 Raman shift range as a linear combination of the morphologic structure basis spectra by LSM. This Raman shift range is chosen, because this range contains the most spectral information.
- the morphologic structure Raman spectra can be normalized with respect to their maximum peak intensity. All spectra in the two data sets can be modeled accurately with the final set of eight morphologic basis spectra.
- the Raman spectral reference data calculated the fractional fit-contribution of seven of the morphologic structures.
- the eighth structure, ⁇ -carotene, is an intense Raman scatterer that often contributes to coronary artery Raman spectra, but is present only in low concentrations. For this reason, its spectrum is included in the spectral reference, but no fractional fit-contribution is calculated.
- CM In calcified atherosclerotic plaques, CM often occupy large volumes of the tissue examined by Raman spectroscopy. To obtain information about the remaining noncalcified regions, and to compare the morphologic structure fractional fit-contributions among the different disease classes, the spectra of calcified plaques are renormalized, neglecting the contribution of calcium mineralization, and the morphologic structure fractional fit-contributions of the noncalcified regions (denoted by X NCR ) is calculated.
- the relative fit-contribution of each morphologic structure to the spectra in the calibration data set is used to develop the algorithm or sequence of instructions to classify the tissue into one of the three diagnostic classes.
- This method is chosen over discriminant analysis, because logistic regression does not make any assumptions about the normalcy of the fit-coefficients.
- B P T (PP T ) ⁇ 1 , is the calibration vector for the morphologic basis spectrum of interest, and N is the noise in the sample.
- FIGS. 2 A- 2 C described hereinbefore show macroscopic Raman spectra collected from coronary artery samples representing each of the three diagnostic classes (normal coronary artery (FIG. 2A), noncalcified atherosclerotic plaque (FIG. 2B), and calcified atherosclerotic plaque (FIG. 2C)), together with LSM reference data.
- the solid lines are the macroscopic spectra and the dotted lines are indicative of the reference data. Residual (data minus the fit) are shown on the same scale. For all spectra, the calculated fit agrees well with the measured spectrum, which suggests that the morphologic basis spectra are a reasonably complete representation of the Raman spectra of the macroscopic tissue samples.
- the morphologic Raman reference data showed, as expected, that nonatherosclerotic tissue consisted mainly of AA, CF, EL, and SMC (FIG. 24A).
- nonatherosclerotic artery the intima is thin and therefore, the contribution of the adventitial layer (which contains a relatively large amount of adipose tissue) to the spectroscopically examined tissue volume is large, because the NIR laser light penetrates through the entire vessel wall.
- the morphologic Raman reference data revealed a dramatic change of the morphologic composition with progression of disease.
- CM and FC/NC NCR +CC NCR of each artery sample can be plotted in a decision diagram as illustrated in FIG. 26A, using the corresponding R 1 and R 2 values.
- the classes are (1) nonatherosclerotic tissue, (II) noncalcified plaque, and (III) calcified plaque.
- FIG. 1 In another preferred embodiment, thirty-five coronary artery samples were taken from 16 explanted transplant recipient hearts, and thin sections were prepared. Using a high-resolution confocal Raman microspectrometer system with an 830-nm laser light, high signal-to-noise Raman spectra were obtained from the following morphologic structures: internal and external elastic lamina, collagen fibers, fat, foam cells, smooth muscle cells, necrotic core, ⁇ -carotene, cholesterol crystals, and calcium mineralizations.
- Raman spectra can be modeled by using a linear combination of basis Raman spectra from the major biochemicals present in arterial tissue, including collagen, elastin, actin, myosin, tropomyosin, cholesterol monohydrate, cholesterol linoleate, phosphatidyl choline, triolein, calcium hydroxyapatite, calcium carbonate, and ⁇ -carotene.
- the results show that the various morphologic structures have characteristic Raman spectra, which vary little from structure to structure and from artery to artery.
- the biochemical model describes the spectrum of each morphologic structure well, indicating that the most essential biochemical components are included in the reference data.
- the biochemical composition of each structure indicated by the fit contributions of the biochemical basis spectra of the morphologic structure spectrum, are very consistent.
- the Raman spectra of various morphologic structures in normal and atherosclerotic coronary artery may be used as basis spectra in a linear combination model to analyze the morphologic composition of atherosclerotic coronary artery lesions.
- Raman spectroscopy has great potential for biochemical analysis of tissue on both the macroscopic and microscopic scale.
- One of the great advantages of this method is its ability to provide information about the concentration, structure, and interaction of biochemical molecules in their microenvironments within intact cells and tissues (i.e. in-situ), nondestructively, without homogenization, extraction, or the use of dyes, labels, or other contrast-enhancing agents.
- Raman spectroscopy can be performed in-vivo using optical fiber technology as described hereinbefore.
- a preferred embodiment of the present invention includes the morphology-based diagnosis of atherosclerotic lesions in arterial tissue using Raman spectroscopy.
- Raman spectroscopy To that end, in-situ Raman spectra of individual cellular and extracellular components of normal and atherosclerotic human coronary artery tissue were obtained in-vitro using confocal Raman microspectroscopy described hereinbefore. The biochemical composition of these microscopic morphologic structures were then determined by modeling their Raman spectra using a linear combination of basis Raman spectra of biochemicals in a similar way as used previously for intact tissue.
- Frozen coronary artery samples were mounted on a cryostat chuck with Histoprep (Fisher Diagnostics, Orangeburg, N.Y.). Thin transverse tissue sections (6-8 ⁇ m) for light microscopy and Raman microspectroscopy were cut using a cryostat/microtome (International Equipment, Needham Heights, Mass.). Four sections of each sample were mounted on glass microscope slides and stained with hematoxylin and eosin.
- the morphologic structures examined were in normal arteries: collagen fibers in the various layers of the arterial wall, internal and external elastic laminae, medial smooth muscle cells, and adventitial fat cells, and in intimal atherosclerotic lesions: collagen fibers in the fibrous cap, foam cells, necrotic core, cholesterol crystals, ⁇ -carotene-containing crystals, and calcium mineralizations.
- FIG. 27 A schematic representation of the system in accordance with the preferred embodiment of the present invention is shown in FIG. 27. All Raman spectroscopic measurements are carried out using a confocal configuration in order to suppress signal Raman light from features that are in peripheral surfaces other than the region of interest of the selected morphologic structure.
- the observation and analysis used a microscope (Zeiss Axioskop 50, Zeiss, Thornwood N.Y.), fitted with a phase contrast system and a stage controller (Prior Scientific Instruments, Cambridge, Mass.). Initial examination of the sample was performed with phase contrast microscopy at 10 ⁇ magnification (Zeiss Achroplan objective).
- phase contrast tissue examination and morphologic structure selection for microspectroscopy were recorded using a CCD color video camera 758 (Sony, Cambridge, Mass.) attached to the microscope 750 and stored on video tape (VCR) 764 from which frames were digitized (PCVision-plus, Imaging Technologies, Bedford, Mass.).
- Near-infrared (830 nm) laser light was generated by an Ar + laser 742 -pumped Ti: sapphire laser system 744 (Coherent Innova 90/Spectra Physics 3900S, Coherent, Santa Clara, Calif.).
- the laser output was band pass filtered 746 (F1) (Kaiser Optical Systems HLBF, Ann Arbor, Mich.) and focused onto the sample using an adjustable mirror (m1) 748 , and a dichroic beamsplitter (m2) 754 , with a laser power on the sample 756 of 50-100 mW.
- the spectrograph 766 includes a grating dispersed light onto a back illuminated deep-depletion CCD detector 768 (Princeton Instruments, Princeton, N.J.) cooled to ⁇ 100° C.
- the CCD interface (ST130 Princeton Instruments) was connected to a personal computer 774 using Winspec software (Princeton Instruments, version 1.4.3), which performed data processing and storage.
- At least three Raman spectra (sampling time between 10 and 100 s) over a range of 100-2000 cm ⁇ 1 (8 cm ⁇ 1 resolution) were obtained from each site selected.
- the method to estimate the light collection or sampling volume of the confocal Raman microspectrometer uses a small (1-2 ⁇ m 3 ) collection volume to insure adequate resolution to collect Raman spectra from small or thin microscopic structures, such as individual collagen fibers.
- polystyrene beads of 1.0 ⁇ m diameter (Polysciences, Warrington, Pa.) were moved through the focused laser beam, and the Raman signal was collected as a function of the bead position relative to the center of the laser focus.
- the step resolution of the microscope stage in the horizontal plane was 1 ⁇ m. Vertical displacement proceeded in 1.1 ⁇ m steps. The position is optimized to obtain the maximal Raman signal of the bead.
- Lateral resolution is determined by alternately measuring the Raman signal of the central position and one of eight positions in the X or Y direction from the center of the bead using 1- or 2- ⁇ m steps.
- the intensity of the strong 1004 cm ⁇ 1 polystyrene Raman band is measured as a function of the distance to the laser focus in both the planar directions and the axial direction.
- the result for each direction is then fitted with a Gaussian function, and the diameter of the focused beam is determined from the full width at half-maximum intensity (FWHM). For both lateral directions, the diameter is about 1 ⁇ m while the axial direction is 2 ⁇ m.
- the sampling volume is calculated to be about 2 ⁇ m 3 .
- r is the Raman spectrum.
- the 700-1800 cm ⁇ 1 Raman shift range is chosen because this range contains most spectral information.
- Reagent grade commercial chemicals (Sigma, St. Louis, Mo.), are used to obtain the Raman spectra, for use as basis spectra, of the 12 biochemical components, including proteins (collagen type III, elastin, actin, myosin, and tropomyosin), unesterified cholesterol (cholesterol monohydrate), cholesterol esters (cholesterol linoleate), phospholipids (phosphatidyl choline), triglycerides (triolein), carotenoids ( ⁇ -carotene), and calcium salts (calcium hydroxyapatite and calcium carbonate).
- proteins collagen type III, elastin, actin, myosin, and tropomyosin
- unesterified cholesterol cholesterol monohydrate
- cholesterol esters cholesterol esters
- phospholipids phosphatidyl choline
- triolein triolein
- carotenoids ⁇ -carotene
- calcium salts calcium salts
- the reference data components cannot be scaled on chemical weight, since the actual concentration of the biochemicals in the various morphologic structures in unknown. Therefore, the intensity of the spectral feature at 1440-1455 cm ⁇ 1 (representing the bonding of CH 2 bonds in protein and lipid) is set to unity.
- the Raman spectra of ⁇ -carotene, calcium carbonate, and calcium hydroxyapatite, which lack spectral features in this region, are set to unity with respect to spectral features at 1159, 1080, and 961 cm ⁇ 1 , respectively.
- This reference thus provides information about the relative fit contribution of these chemical components to the Raman spectra of the various morphologic structures. The fit contribution of each biochemical component is expressed as a fraction of the maximum (i.e. 1).
- FIG. 28A is a photomicrograph of an unstained coronary artery section showing the internal elastic lamina viewed under phase contrast. This structure is examined at a total of 54 sites in 21 coronary artery samples. In nine of these samples, were collected spectra from the external elastic lamina. In FIG. 28B, the Raman spectra of six different internal elastic laminae are shown. The bands at 1664 and 1264 cm ⁇ 1 are attributable to the amide I and III vibrations, respectively, of structural proteins such as elastin and collagen. The intense band at 1449 cm ⁇ 1 can be assigned to the CH 2 and CH 3 bending mode of proteins, while the 1004 cm ⁇ 1 band is due to phenylalanine.
- the bands at 1336 and 1104 cm ⁇ 1 are attributable to desmosine/isodesmosine, and are specific for elastin.
- the bands at 933 and 855 cm ⁇ 1 can be assigned to the C—C stretching mode of proline and are present in collagen.
- FIG. 29A is a phase contrast photomicrograph showing collagen fibers (length approximately 10 ⁇ m , diameter approximately 2 ⁇ m) in the connective tissue of the tunica adventitia. In total, 17 collagen fibers in 10 samples were studied.
- FIG. 29B shows the Raman spectra from collagen fibers from three different artery samples. Again, on visual inspection, these spectra collected from the adventitia (a, b) show little variation from fiber to fiber within or among coronary artery samples, and are identical to those taken from collagen fibers in the fibrous cap (c) of intimal atherosclerotic lesions.
- FIG. 30 shows four Raman spectra recorded from smooth muscle cells in the tunica media in normal and atherosclerotic coronary artery samples in accordance with a preferred embodiment of the present invention.
- 32 spectra were recorded from 10 coronary artery samples.
- On visual inspection no significant differences were observed between spectra taken from individual smooth muscle cells.
- the main spectral features in the smooth muscle cell spectra are similar to those observed in the elastic laminae and collagen fiber spectra, and are dominated by protein bands at 1660 and 1268 cm ⁇ 1 (amide I and III vibrations, respectively), 853, 940, 1034, 1336 and 1451 cm ⁇ 1 (C—C or C—H bending), and 1004 cm ⁇ 1 (phenylalanine).
- the main differences between the protein-dominated smooth muscle cell, elastic laminae, and collagen fiber spectra are in intensity variations in the phenylalanine (1004 cm ⁇ 1 ), desmosine/isodesmosine (1336 and 1104 cm ⁇ 1 ) and amide III (1268 cm ⁇ 1 )bands.
- FIG. 31 shows examples of Raman spectra collected from fat cells (adipocytes) in the tunica adventitia in accordance with a preferred embodiment of the present invention.
- adipocytes fat cells
- the spectra collected from the fat cells are very similar, and are dominated by an ester band (1747 cm ⁇ 1 ), an unsaturated carbon/carbon band (C ⁇ C; 1654 cm ⁇ 1 ), and CH 2 /CH 3 bands (1440 and 1301 cm ⁇ 1 ), which, in combination, indicate triglycerides.
- FIG. 32A is a phase contrast photomicrograph of foam cells in the intima of an atheromatous plaque. The individual lipid droplets in these cells can easily be identified. In total, 30 foam cells in eight coronary artery samples were studied.
- FIG. 32B the Raman spectra from three foam cells are shown (a-c). Although similar on visual inspection, these spectra show more variation among foam cells than the spectra of collagen fibers, the internal and external elastic laminae, and smooth muscle cells. More specifically, the foam cell spectra are distinctly different from the protein-dominated spectra of the elastic laminae, collagen fibers, and smooth muscle cells, particularly with regard to the numerous bands below 1100 cm ⁇ 1 .
- the bands at 702, 878, 923, and 957 cm ⁇ 1 can be assigned to the steroid nucleus of both unesterified (free) cholesterol and cholesterol esters.
- the intense bands at 1671, 1439, 1299, and 1270 cm ⁇ 1 are due to C ⁇ C stretch and CH 2 /CH 3 bending modes.
- the presence of bands at 1735 and 1026 cm ⁇ 1 (specific for cholesterol esters) and 1058 and 1328 cm ⁇ 1 (specific for free cholesterol) indicates that these foam cells contain both esterified and unesterified cholesterol.
- the reduced CF NCR in non-calcified plaques is indicative of decreased plaque stability.
- the bands at 719 cm ⁇ 1 (symmetric choline stretch), 762 cm ⁇ 1 (symmetric O—P—O stretch), and 878 cm ⁇ 1 (asymmetric O—P—O stretch) indicate the presence of phospholipids, and those at 1523 and 1160 cm ⁇ 1 the presence of ⁇ -carotenoids.
- the foam cell spectra lack the triglyceride bands at 1747, 1654, 1440, and 1301 cm ⁇ 1 seen in adventitial fat cells.
- FIG. 32B also shows two examples of Raman spectra collected from necrotic core (d and e). Similar to the foam cell spectra, there is some variation from structure to structure within the necrotic core. However, the average spectra from foam cells and necrotic core are quite similar, indicating that the chemical contents of both morphologic structures are quite similar.
- FIG. 33 shows examples of Raman spectra taken from cholesterol crystals of different size in the necrotic core of atheromatous plaques.
- cholesterol crystals in seven coronary artery samples were studied.
- the main spectral features of the cholesterol crystal spectra are at 1668 cm ⁇ 1 (C ⁇ C stretch), 1443, 1328, and 1274 cm ⁇ 1 (CH 2 , CH 3 bending), and 1176 and 1085 cm ⁇ 1 (C—C stretch).
- the spectral features below 1000 cm ⁇ 1 are attributed to steroids, indicating the presence of unesterified cholesterol. Slightly more variation was seen between the spectra from individual crystals, mainly due to band intensity variations, indicative of differences in the ratio of free to esterified cholesterol in the crystals themselves or in the tissue components surrounding the crystals.
- FIGS. 33 shows the Raman spectra of two such crystals from two different coronary artery samples. In total, seven of these crystals from three samples were studied. The main spectral features are bands at 1523 and 1160 cm ⁇ 1 which are due to C—C and C ⁇ C stretches and indicative of ⁇ -carotene. Given the presence of bands at 1449 and 956 cm ⁇ 1 , these yellow crystals also appear to contain some structural proteins and cholesterol esters.
- FIG. 34A is a photomicrograph of an atherosclerotic plaque containing a calcification.
- 15 calcium mineralizations in six coronary artery samples were studied.
- Raman spectra representing different stages of calcification in two atherosclerotic plaques are shown in FIG. 34B.
- the main features of these spectra are 1071 and 959 cm ⁇ 1 bands attributed to CO 3 2 ⁇ (symmetric)/PO 4 3 ⁇ (asymmetric) and PO 4 3 ⁇ (symmetric) stretches, indicative of calcium carbonate and calcium hydroxyapatite, respectively.
- Large calcium mineralizations (FIGS. 34B, a and b ) show spectral features different from those of minute punctate calcium mineralizations in the necrotic core (FIGS. 34B, c ).
- the main difference is the presence of additional features in the spectra of the punctate calcium mineralizations attributable to lipids and/or phospholipids (1433 cm ⁇ 1 ), most likely due to the surrounding necrotic core
- FIGS. 36 A-H shows a Raman spectrum of one of the morphologic structures, and the result of the least-squares minimization fit of the biochemical model. Residuals (data minus the fit) are shown on the same scale. Because the Raman spectra from foam cells and necrotic core were very similar, only the fit results of the foam cells are shown.
- each morphologic structure examined the contribution of each biochemical component was determined.
- FIGS. 37 A-H confirm that each morphologic structure has a characteristic biochemical composition.
- each morphologic structure is composed largely of one or two major biochemical components, combined with one or more less abundant biochemical components.
- the internal and external elastic laminae are mainly composed of elastin with a smaller collagen component, whereas collagen fibers in both normal arteries and the fibrous cap of atherosclerotic lesions (FIG. 37B) are mainly composed of collagen with a small elastin component.
- Smooth muscle cells FIG. 37C were modeled almost entirely by actin and a small tropomyosin component. Myosin did not contribute at all.
- FIG. 37D triglycerides
- phospholipids phosphatidyl choline
- FIG. 37E foam cells and necrotic core
- Foam cells appear similar in the current data and cannot be distinguished from necrotic core on the basis of their biochemical composition. However in a following assessment they can be distinguished. For example, the spectral feature at approximately 1750 cm ⁇ 1 can be used to distinguish the foam cells from the necrotic core.
- Cholesterol crystals (FIG. 37F) contain free cholesterol and cholesterol ester at a ratio of about 3:1.
- the yellow crystals (FIG. 37G) consist almost entirely of ⁇ -carotene, with a small contribution of cholesterol. This may indicate that these crystals are in fact cholesterol crystals that contain high concentrations of ⁇ -carotene.
- Calcium mineralizations (FIG. 37H) are mainly composed of calcium hydroxypatite with small contributions of collagen, triglycerides, and calcium carbonate.
- foam cells and other inflammatory cells may also play a role in plaque instability. Therefore, morphologic factors, such as the presence of crystalline-free cholesterol or foam cells, may be as important as biochemical composition in determining atherosclerotic plaque stability and progression.
- the biochemical model of FIG. 35 describes the spectrum of each morphologic structure well, which means that the most essential biochemical components are included in the reference.
- the biochemical composition of each structure indicated by the fit contributions of the biochemical basis spectra to the morphologic structure spectrum, is very consistent (FIGS. 36 A-H).
- the largest biochemical variations were found in foam cells, necrotic core, cholesterol crystals, and calcium mineralizations.
- the biochemical variations in both calcium mineralizations, cholesterol crystals, and ⁇ -carotene-containing crystals may be due to differences in their stage of progression (as reflected by size).
- the biochemical model did provide valuable information on the biochemical composition of the microscopic cellular and extracellular morphologic structures, it has its limitations.
- One of the major limitations of this model and/or reference was illustrated by the fits of the smooth muscle cell spectra.
- smooth muscle cells which comprise the majority of the tunica media of muscular arteries such as the coronary artery, contain approximately three times more actin than myosin, but approximately equal amounts of myosin and tropomyosin.
- the fit contributions in the biochemical model indicated that smooth muscle cells contained almost exclusively actin, with a small amount of tropomyosin and virtually no myosin.
- Another preferred embodiment shows that these relative morphologic comparisons can be used as the basis for an algorithm that allows diagnosis of atherosclerosis in coronary arteries. This is the first step in developing a quantitative Raman spectroscopy morphologic analysis with the purpose to accurately classify normal arteries and atherosclerotic plaques ex vivo, and in the future to predict plaque stability and disease progression in-vivo.
- confocal Raman microspectroscopy is illustrated to be used to perform an in-situ biochemical analysis of individual microscopic morphologic structures (such as foam cells and necrotic core) in intact arterial tissues that cannot be isolated or purified using conventional analytical techniques.
- the various morphologic structures have characteristic Raman spectra, which, as expected, vary little from structure to structure or from artery to artery, and can be used as basis spectra in a morphologic reference to perform a relative comparison of the morphology of normal and atherosclerotic coronary arteries ex-vivo.
- This nondestructive technique may ultimately be used to assess plaque stability and disease progression in humans in-vivo, as well as to study atherogenesis in animal models and lipid metabolism in cell cultures in-vitro.
- the embodiments of the present invention interpret Raman spectra in terms of morphology.
- the Raman spectra can be associated with a morphological structure, for example, a foam cell which can be associated with specific chemical compounds.
- the number of spectra can be reduced, for example, from a large number of chemical spectra to only eight unique spectra associated with morphological structures thereby decreasing the error in the fit.
- the diagnostics that are available to identify and monitor vulnerable plaque using the optical fiber catheter system of the present invention include the use of chemical composition, information about the morphological structures, thickening of the intimal layer and the thinning of the overlying collagen layer.
- Preferred embodiments include the determination of the depth of collagen by measuring the percentage of collagen. Further, the presence of calcification is monitored and any edges are identified and located relative to the collagen as indicators of a potential rupture and blood clot. As discussed previously, the reduced fractional fit contributions of collagen fibers in non-calcified plaques is an indicator of unstable plaque.
Abstract
Description
- The present application claims the benefit of the U.S. Provisional Patent Application No. 60/370,197, filed Apr. 5, 2002. The entire contents of the above application is incorporated herein by reference in its entirety.
- [0002] This invention was supported, in whole or in part, by grants P41-RR-02594 and NIH-HL-64675 from the National Institute of Health. The Government has certain rights in the invention.
- Optical methods are increasingly being used for the detection of disease. Near-infrared Raman spectroscopy in particular, because of its chemical specificity, is proving to be a useful tool for both disease diagnosis and the study of disease progression. Over the past decade Raman spectroscopy has been applied to many diseases and biological problems and there have been many advances in-vitro. More recently there have been reports of in-vivo work that however have either been confined to studies of skin or other easily accessible organs, or have used optical fiber configurations that require collection times that are unreasonably long for practical clinical use. The majority of applications require remote sampling via optical fibers, and the size of the probe and fiber bundle is strictly limited by the application. A particular example that current commercial systems cannot provide is the ability to evaluate atherosclerotic lesions in-vivo in real-time, through an angiographic catheter, thus aiding cardiologists in directing the most appropriate treatment in each individual case. These objectives have not been fulfilled by current systems.
- In addition, prior art probes for remote Raman sensing, using several different methods for filtering out the fiber spectral background, either exhibit extremely low optical throughput or are too bulky to be used intravascularly. A problem with the prior art designs includes having a 4 cm long stiff tip that prohibits their incorporation into transcutaneous catheters for accessing the coronary arteries. Secondly, in data collected with these probes, a considerable component of the fiber Raman spectrum still remains. Further, data collection times on the order of 30 seconds or longer are typically required for collection of signals with an acceptable signal to noise ratio (SNR).
- A need still exists for improved systems and methods which include probes for, for example, Raman spectroscopy that are sized for applications in medicine and provide an improved spectral signature from tissue.
- The system and method of the present invention relates to using spectroscopy, for example, Raman spectroscopic methods for diagnosis of tissue conditions such as vascular disease or cancer. The system and methods of the present invention have several applications: optical breast biopsies and breast analysis through ductoscopy, percutaneous blood analysis and monitoring, vascular stenosis, gastrointestinal cancer evaluation, scanning for dysplasia in the pancreatic duct and skin analyses.
- In accordance with a preferred embodiment of the present invention, a system for measuring tissue includes a fiber optic probe having a proximal end, a distal end, and a diameter of 2 mm or less. This small diameter allows the system to be used for the diagnosis of coronary artery disease or other small lumens or soft tissue with minimal trauma. A delivery optical fiber (or fibers) is included in the probe coupled at the proximal end to a light source. A filter for the delivery fibers is included at the distal end. The system includes a collection optical fiber (or fibers) in the probe that collects Raman scattered radiation from tissue, the collection optical fiber is coupled at the proximal end to a detector. A second filter is disposed at the distal end of the collection fibers. An optical lens system is disposed at the distal end of the probe including a delivery waveguide coupled to the delivery fiber, a collection waveguide coupled to the collection fiber and a lens.
- The delivery waveguide comprises a rod and the collection waveguide comprises a cylindrical tube, the tube being concentric about the rod. In an alternate preferred embodiment, the delivery waveguide comprises a first tube and the collection waveguide comprises a second cylindrical tube, the second tube being concentric about the first tube. Further the lens includes a ball lens optically coupled to the delivery fiber and the collection fiber.
- In a preferred embodiment, the probe further comprises a sleeve that optically isolates the delivery waveguide from the collection waveguide. The sleeve can be metallic, such as palladium, silver or gold. The glass rod tube and sleeve can be attached together with an adhesive. An outer retaining sleeve can attach the distal optics to the fiber optics.
- The probe further comprises a first plurality of collection fibers arranged concentrically about the delivery fiber at a first radius, and a second plurality of collection fibers arranged concentrically about the delivery fiber at a second radius that is larger than the first radius.
- In accordance with another aspect of the present invention, the probe includes a controller that gates a collection time, the collection time being less than 2 seconds. In one embodiment, the optical lens system has a length less than 10 mm. In a preferred embodiment, the optical lens system has a length of less than 4 mm. The diameter of the distal optical system is preferably in the range of 1-2 mm. The optical lens systems delivers and collects radiation in a radial direction, which can be defined as any off-axis direction. The light source has a wavelength longer than 750 nm with a preferred embodiment using an argon laser pumped Ti: sapphire laser emitting at 830 nm. In an alternate embodiment a diode laser such as a InGaAs laser emitting at 785 nm or 830 nm may be used.
- In a preferred embodiment, the radial Raman probe in accordance with the present invention for use in diagnosing atherosclerosis is incorporated in a catheter of the type used for angiography, for example. It includes a balloon for displacing blood and other fluids and to position the catheter in the artery. A preferred embodiment includes a channel for balloon inflation. Further, the catheter system includes the capability for flushing away the blood temporarily with a fluid, for example, saline. One or several optical fibers can be configured so as to direct excitation light in a radial direction, either to the side or at an angle ranging from 45°-90°. In such a preferred embodiment a balloon disposed on the side is used to contact the fibers adjacent the artery wall, and displace blood or other intervening fluids.
- Alternately, the delivery fibers can be arranged to direct light in a circular pattern at an angle to the axis of the probe. The different collection fibers collect light simultaneously from different portions of the circumferential region illuminated. In this embodiment, the probe is enclosed in an inflatable balloon which is inflated before light delivery and/or collection to displace blood and other fluids. In preferred embodiments, the balloon is of a type used in arterial applications, such as, for example, angioplasty, and are made of thin material so as to allow excitation light to pass through to the artery wall, and return Raman light generated in the artery wall to pass through the balloon to the collection fibers.
- The present invention includes the diagnostic classification of atherosclerotic plaques in human coronary arteries by quantitative assessment of their morphologic composition using Raman spectroscopy. The rapid and nondestructive nature of Raman spectroscopy provides the opportunity to diagnose coronary artery plaques in-vivo, when applied in a clinical setting using optical fiber technology. So used, the preferred embodiments of the present invention classify an atherosclerotic lesion, and can provide in-vivo quantitative assessment of its morphologic features, such as the presence of foam cells (FC), necrotic core (NC), and cholesterol crystals (CC), which may be used to assess plaque instability and the extent of disease progression, and thereby, the risk of life-threatening complications such as thrombosis and acute plaque hemorrhage. So used, the methods of the present invention may provide insight into as yet poorly understood dynamics in the evolution of atherosclerotic lesions and the effects of lipid-lowering and other therapies.
- Chemical composition and morphology, rather than anatomy (degree of stenosis), determine atherosclerotic plaque instability and predict disease progression. In a preferred embodiment, a modification of the Raman spectroscopy reference data can also be used to identify the microscopic morphologic structures comprising the plaque, and the pathological state of the artery can be accurately assessed using a diagnostic algorithm based on the relative contribution of these microscopic morphological structures to the macroscopic arterial Raman spectrum.
- In a preferred embodiment eight atherosclerotic classes are used for comparison with previous studies using the principal component analysis (PCA) and chemical reference data. These eight classes are reduced to three classes. On pathologic examination, the presence of FC, NC, and CC are significant predictors of plaque instability and disease progression. The embodiments of the present invention show that Raman spectroscopic analysis of these same morphologic structures can be used to diagnose atherosclerotic lesions in intact coronary arteries, without the need for microscopic examination. This suggests that Raman spectroscopy can provide not only quantitative chemical information, but also quantitative morphologic information regarding atherosclerotic lesion composition, such as the presence of CC, not readily available in current diagnostic imaging techniques such as intravascular ultrasound (IVUS), magnetic resonance imaging (MRI), and angiography.
- In a preferred embodiment, the spectral signatures of the cellular and extracellular morphologic components of normal and atherosclerotic arterial tissue in-situ are determined using confocal Raman microspectroscopy. The specific morphologic structures are selected because of their role in normal arterial anatomy (e.g. elastic laminae) and/or atherosclerotic plaque formation (e.g. foam cells, necrotic core, cholesterol crystals). Least-squares minimization of a linear combination of the basis spectra of 12 biochemical components provide information on the biochemical composition of the various morphologic structures. These biochemical components are selected because they were known to be present in high concentration in normal arterial tissue and/or atherosclerotic plaque (e.g. collagen, elastin, and free and esterified cholesterol) or because they are strong Raman scatterers (e.g. β-carotene). Glycosaminoglycans (e.g. hyaluronic acid, chondroitin sulfate, dermatan sulfate, and heparan sulfate), which may contribute 3% of artery dry mass, did not contribute significantly to the biochemical model and reference data fits, most likely because they are weak Raman scatterers (i.e. they have small Raman cross sections), and were excluded from the reference data.
- The embodiments of the present invention interpret Raman spectra in terms of morphology. For example, the Raman spectra can be associated with a morphological structure, for example, a foam cell which can be associated with specific chemical compounds. Further, the number of spectra can be reduced, for example, from a large number of chemical spectra to only eight unique spectra associated with morphological structures thereby decreasing the error in the fit. The diagnostics that are available to identify and monitor vulnerable plaque using the optical fiber catheter system of the present invention include the use of chemical composition, information about the morphological structures, thickening of the intimal layer and the thinning of the overlying collagen layer. Preferred embodiments include the determination of the depth of collagen by measuring the percentage of collagen. Further, the presence of calcification is monitored and any edges are identified and located relative to the collagen as indicators of a potential rupture and blood clot. Further, the reduced fractional fit contributions of collagen fibers in non-calcified plaques is an indication of decreased plaque stability.
- The foregoing and other features and advantages of the systems and methods for spectroscopy of in-vivo biological tissue will be apparent from the following more particular description of preferred embodiments of the system and method as illustrated in the accompanying drawings in which like reference characters refer to the same parts throughout the different views. The drawings are not necessarily to scale, emphasis instead being placed upon illustrating the principles of the invention.
- FIG. 1A graphically illustrates a comparison of theory, simulations and results for Raman emission data of turbid samples of blood tissue for the radial distribution of the Raman scattered light in accordance with a preferred embodiment of the present invention.
- FIG. 1B graphically illustrates a comparison of simulations, theory and results for Raman emission data of turbid samples of blood tissue for angular distribution of the Raman scattered light in accordance with a preferred embodiment of the present invention.
- FIGS. 2A-2C are graphical representations of morphological reference data of coronary arteries for a normal coronary artery, non-calcified plaque and calcified plaque, respectively in accordance with a preferred embodiment of the present invention.
- FIG. 3 is a graphical illustration of Raman morphometry of a coronary artery in accordance with a preferred embodiment of the present invention.
- FIG. 4A is a longitudinal view of an apparatus including a probe for measuring tissue in accordance with a preferred embodiment of the present invention.
- FIG. 4B is a transverse view of the probe illustrated in FIG. 4A in accordance with a preferred embodiment of the present invention.
- FIGS. 4C and 4D are a longitudinal and transverse view respectively of an alternate embodiment of a probe for measuring tissue with a paraboloidal mirror in accordance with the system of the present invention.
- FIG. 5 graphically illustrates the transmission characteristics of the excitation and collection fibers incorporating filters with respect to the Raman shift in accordance with a preferred embodiment of the present invention.
- FIG. 6 graphically illustrates the Raman spectrum of a non-calcified artherosclerotic plaque collected in 1 second with 100 mW excitation power in accordance with a preferred embodiment of the present invention.
- FIG. 7 graphically illustrates the Raman spectrum of a normal artery in accordance with an in-vitro system preferred embodiment of the present invention.
- FIG. 8 is a schematic diagram illustrating a system for measuring tissue in accordance with a preferred embodiment of the present invention.
- FIG. 9 illustrates the excitation light diffusing through tissue in accordance with a preferred embodiment of the present invention.
- FIGS. 10A-10C are graphical representations of the integrated radial distributions, integrated angular distributions and optimized collection efficiency for blood tissue, respectively, in accordance with a preferred embodiment of the present invention.
- FIG. 11 is a graphical representation of an excitation spot size in accordance with a preferred embodiment of the present invention.
- FIG. 12 is an illustration of a ray diagram of the distribution of excitation light in tissue in accordance with a preferred embodiment of the present invention.
- FIG. 13 is an illustration of a ray diagram of the collection efficiency of a probe in accordance with a preferred embodiment of the present invention.
- FIG. 14 graphically illustrates the collection efficiency of the probe in accordance with a preferred embodiment of the present invention.
- FIG. 15 is partially sectioned view illustrating a portion of a coronary artery showing a probe in accordance with a preferred embodiment of the present invention.
- FIG. 16 illustrates a signal from a ball lens as a function of laser power in accordance with a preferred embodiment of the present invention.
- FIG. 17 graphically illustrates a comparison of data as collected using a probe and an experimental system of a normal aorta in accordance with a preferred embodiment of the present invention.
- FIG. 18 graphically illustrates a Raman spectrum of normal breast issue examined with a probe in accordance with a preferred embodiment of the present invention.
- FIG. 19 graphically illustrates a comparison of Raman spectra of a malignant breast tumor as collected using a probe in accordance with a preferred embodiment of the present invention and as predicted by reference data of the present invention.
- FIG. 20 graphically illustrates a comparison of morphological reference data to calcified aorta data collected with a probe in accordance with a preferred embodiment of the present invention.
- FIGS. 21A-C illustrate longitudinal views of alternate preferred embodiments of side-viewing probes for measuring tissue in accordance with a system of the present invention.
- FIG. 21D illustrates a view of a preferred embodiment of a side-viewing probe delivering light imaged onto a portion of tissue and Raman light collected from the tissue in accordance with a preferred embodiment of the present invention.
- FIG. 22 is a schematic illustration of a combined Raman macrospectroscopy and confocal microspectroscopy system in accordance with a preferred embodiment of the present invention.
- FIG. 23 graphically illustrates the Raman spectra of eight selected coronary artery morphological structures in accordance with a preferred embodiment of the present invention.
- FIGS. 24A-24C graphically illustrate the results of the fit contribution of seven morphologic structures to the calibration data set and the diagnostic algorithm classification wherein FIG. 24A illustrates nonatherosclerotic tissue, FIG. 24B illustrates noncalcified atherosclerotic plaque and FIG. 24C illustrates calcified atherosclerotic plaque in accordance with a preferred embodiment of the present invention.
- FIG. 25 illustrates the spectral contribution of β-carotene in a calibration data set in relation to three diagnostic categories, wherein the carotenoid level is expressed in arbitrary units in accordance with a preferred embodiment of the present invention.
- FIGS. 26A and 26B graphically illustrate the results of the algorithm developed with an initial calibration data set and the results of the prospective validation data set, respectively, in accordance with a preferred embodiment of the present invention.
- FIG. 27 is a schematic diagram of a system including a confocal Raman microspectrometer in accordance with a preferred embodiment of the present invention.
- FIGS. 28A and 28B are a photomicrograph of internal elastic lamina in a 6-μm unstained coronary artery section viewed under phase contrast and the Raman spectrum of the internal elastic lamina, respectively, in accordance with a preferred embodiment of the present invention.
- FIGS. 29A and 29B are a photomicrograph of the tunica adventitia with collagen fibers in a 6-μm unstained coronary artery section viewed under phase contrast and the Raman spectrum of the fibers, respectively, in accordance with a preferred embodiment of the present invention.
- FIG. 30 graphically illustrates the Raman spectra of four different smooth muscle cells in the tunica media in accordance with a preferred embodiment of the present invention.
- FIG. 31 graphically illustrates the Raman spectra of four fat cells (adipocytes) in the tunica adventitia in accordance with a preferred embodiment of the present invention.
- FIGS. 32A and 32B are a photomicrograph of foam cells in an intimal athersclerotic plaque in a 6-μm unstained coronary artery section viewed under phase contrast and a Raman spectra of the foam cells and necrotic core, respectively, in accordance with a preferred embodiment of the present invention.
- FIG. 33 graphically illustrates the Raman spectra of cholesterol crystals in intimal atherosclerotic plaques in accordance with a preferred embodiment of the present invention.
- FIGS. 34A and 34B are a photomicrograph of the calcification in the necrotic core of an intimal atherosclerotic plaque in a 6-μm unstained coronary artery section viewed under phase contrast and the corresponding Raman spectra in accordance with a preferred embodiment of the present invention.
- FIG. 35 graphically illustrates a Raman basis spectra of the 12 biochemicals used for linear fitting to the morphologic spectra in accordance with a preferred embodiment of the present invention.
- FIGS. 36A-36H provide a graphical comparison between observed data and reference data of spectra of the different morphological structures in the coronary artery in accordance with a preferred embodiment of the present invention.
- FIGS. 37A-37H graphically illustrate the biochemical composition of each morphologic structure in accordance with a preferred embodiment of the present invention.
- FIG. 38A graphically illustrates the results for Raman emission data of turbid samples of artery tissue for the radial distribution of the Raman scattered light in accordance with a preferred embodiment of the present invention.
- FIG. 38B graphically illustrates the results for Raman emission data of turbid samples of artery tissue for angular distribution of the Raman scattered light in accordance with a preferred embodiment of the present invention.
- FIGS. 38C-38E are graphical representations of integrated radial distributions, integrated angular distributions and optimized collection efficiency of artery tissue, respectively, in accordance with a preferred embodiment of the present invention.
- The present invention is directed to systems and methods for using Raman spectroscopy of tissue. A predicate for developing systems and methods for in-vivo applications using angiographic catheters to aid cardiologists in directing the appropriate treatment is the development of optical fiber probes for Raman spectroscopy capable of delivering low energy laser light to, and efficiently collecting the resulting Raman spectral signature from, in-vivo tissue. The probes in preferred embodiments are small, and use micro-optical design principles.
- Methods for performing Raman spectroscopy for diagnosis and treatment of tissue are described in U.S. Pat. No. 5,615,673 issued on Apr. 1, 1997, in U.S. Pat. No. 5,304,173 issued on Apr. 19, 1994, in International Publication No. WO 92/15008, published on Sep. 3, 1992 and in International Publication No. WO 96/29925 published on Oct. 3, 1996, the entire teachings of all the references are incorporated herein by reference.
- There are at least two difficulties to be overcome in producing such probes. The first is due to the spectral background signal generated in the delivery and collection fibers themselves, which may be orders of magnitude larger than the signal from the tissue site being examined. This background signal includes Raman light from the fused silica core, fluorescence from impurities and dopants used to design fibers of a particular numerical aperture (NA), as well as signal from various jacket materials. Laser light in the delivery fibers generates an intense fiber background due to the long path length traversed in the fibers, typically three to four meters. This fiber spectrum is scattered from the tissue surface and is collected, along with the tissue Raman spectrum, by the collection fibers, often masking the tissue Raman signal which is generated from only approximately 1 mm of sample due to the relatively short penetration of light into tissue.
- In addition, laser light backscattered from the tissue is also collected by the collection fibers, and this scattered laser light produces an additional fiber spectrum originating in the collection fibers, which further compromises the quality of the tissue spectrum reaching the detector. In addition to obscuring and distorting the spectrum of interest, the intense fiber background adds a level of shot-noise to the signal and this noise can often be larger than the tissue Raman bands. Analyzing both delivery and collection fibers indicates that they both produce approximately equal amounts of this fiber spectral background. In a preferred embodiment, two different filters are used to suppress the undesired fiber background, one for delivery and one for collection. Further, it is desirable to terminate the delivery fibers with a short wavelength pass or band-pass filter that transmits the laser excitation light while blocking the longer wavelength spectral background generated in the delivery fibers. In a preferred embodiment, the collection fibers can be preceded by a long wavelength pass filter or notch filter which transmits the tissue Raman spectrum while blocking laser light backscattered from the tissue. Any filters used also perform the appropriate function over a range of angles corresponding to the acceptance angle (NA) of the fibers they are coupled to.
- The second difficulty is related to signal collection. This has two components, the first of which pertains to the inherently weak nature of the Raman effect. Approximately only one out of every billion excitation photons are converted into a Raman photon. In a preferred embodiment, a high-throughput optical probe apparatus collects signals with sufficient signal-to-noise ratio (SNR) to be useful in a clinically realistic timeframe. To be clinically useful and commercially viable, a preferred embodiment collects high SNR spectra in approximately 1-2 seconds. The second component also addresses optimization of collection which is further compromised by absorption and scattering in the tissue which results in causing the light to be widely diffused over large areas and angles.
- In a preferred embodiment the collection ability of an optical system is limited by its throughput, approximately given by the product of area of collection (A) and solid angle (Ω) (AΩ-product). The AΩ product is conserved throughout the system. In typical Raman spectroscopy systems, throughput is determined by the spectrograph/CCD collection detection system. In a preferred embodiment, the spectrograph is f/1.8 (NA=0.278) corresponding to a solid angle of Ω=0.242sr, with a maximal slit height of 16 mm. To achieve sufficient spectral resolution for biological Raman spectroscopy a 0.2 mm slit width is used. Therefore, the maximal area of collection is A=3.2 mm 2, resulting in a theoretical maximal throughput of AΩ=0.77 mm2-sr. In a preferred embodiment a CCD detector is used to ensure that the effective Raman source generated in the tissue by the incident excitation light, no matter how bright, is optimally collected. The light is considered to be emitted over a large area and 4π solid angle but is limited by the collection angle 27π. Therefore the optimal trade-off between collection solid angle and area is determined in preferred embodiments of the present invention.
- In a preferred embodiment system the spectrograph/CCD is replaced by a higher throughput system. For example, one such arrangement consists of a series of dichroic beam-splitters, filters and photodiodes. The filter wavelengths are determined to optimize multivariate spectral analysis with the minimum number of wavelengths. The exact number of wavelengths and bandwidths of the detector element depend on the spectral features of the chemical/morphological structures to be sensed. Such a system results in much greater throughput than the prior art spectrograph/CCD systems and is smaller, cheaper and does not require cooling, further eliminating bulk and expense.
- FIGS. 1A and 1B graphically illustrate a comparison of theory, simulations and results for Raman emission data of turbid samples of blood tissue for radial and angular distribution, respectively, of the Raman scattered light in accordance with a preferred embodiment of the present invention. Biological tissue is a collection of similar cells and the intercellular substances surrounding them. The four basic tissues in the body include epithelium tissue; connective tissues including blood, bone, and cartilage; muscle tissue; and nerve tissue. Most tissues with the exception of the cornea, are turbid, as they exhibit a high degree of elastic scattering, due to microscopic structures and refractive index variations contained therein and thus light entering such tissue is greatly diffused. Thus, the samples are characterized as turbid samples in FIGS. 1A, 1B, 10A-10C, 38A-38E. In a preferred embodiment, simulations such as, for example, Monte Carlo simulations are performed to predict the spatial and radial distribution of both the excitation and the Raman scattered light. In a preferred embodiment, the radial distribution is approximately Gaussian as shown in FIG. 1A, while the angular distribution is Lambertian as shown in FIG. 1B. Using these parameters and the optical throughput theorem which includes the conservation of the product of area and solid angle of the light being transmitted through an optical system, the optimal collection area and angles are determined. It should be recognized that the product AΩ is a constant and choosing the optimal combination of A and Ω is important as shown in FIGS. 10A-10C. In a preferred embodiment collection parameters of approximately 0.35 mm radius and 55° are optimal for blood tissue. The optimal collection parameters for artery tissue are approximately 0.4 mm radius and 20°. The results of the analyses are then incorporated into an optical design program such as, for example, Zemax program to determine appropriate optics for maximal signal collection.
- FIG. 38A graphically illustrates the results for
Raman emission data 1360 of turbid samples of artery tissue in contrast to blood tissue described with respect to FIG. 1A for the radial distribution of the excitation and Raman scattered light in accordance with a preferred embodiment of the present invention. Thecurve 1362 illustrates the fit using a three Gaussian fit. Further, FIG. 38B graphically illustrates the results forRaman emission data 1360 of turbid samples of artery tissue for angular distribution of the excitation and Raman scattered light in accordance with a preferred embodiment of the present invention. Similar to FIGS. 10A-10C which illustrated distributions and collection efficiency for blood tissue; FIGS. 38C-38E are graphical representations of integrated radial distributions, integrated angular distributions and optimized collection efficiency for artery tissue, respectively, in accordance with a preferred embodiment of the present invention. - Optical elements are used to transfer the light collected from the tissue to the distal end of optical fibers in the probe. The proximal end of the fiber bundle is then re-shaped to match the shape, area, and NA of the spectrograph. These procedures are followed so as not to decrease light transmission efficiency, and provide effective coupling. The choice of collection fiber NA and collection fiber diameter is determined by the spectrometer NA, the desired spectral resolution, and considerations of matching optics, as well as the limitation set by filter acceptance angle. The trade-offs for the system include the spectrometer chosen, and the desired resolution determines a slit width. At the output end the collection fibers are arranged in a straight line, which is imaged onto the entrance slit by the matching optics. Considering the throughput theorem, the requirement on the collection fibers includes that the product of fiber NA and diameter equal the product of spectrometer NA and slit width. If a fiber is chosen which satisfies the stronger condition that the fiber diameter equals the slit width and the fiber NA equals the spectrometer NA, the necessity of using matching optics is eliminated and the probe is directly coupled into the spectrometer. If only the product requirement can be satisfied then matching optics are needed. In an alternate embodiment, spectrometers use curved slits, and the output end of the collection fibers can be modified to match any slit shape. An upper limit on the number of collection fibers is defined by the height of the fiber array image that is less than the slit height or CCD chip, whichever is less. However a smaller limitation may be set by the space available in the collection tip.
- FIGS. 2A-2C are
graphical representations - FIG. 3 is a
graphical illustration 60 of Raman morphometry of a coronary artery in accordance with a preferred embodiment of the present invention. The relative fit coefficients are plotted against different conditions in the normal artery, artery having non-calcified plaque and calcified plaque. - In accordance with preferred embodiments for intravascular applications all of the parameters such as, for example, but not limited to optical filtering and high-throughput optics designed to collect from diffuse sources is accomplished without increasing the diameter of the tip, or compromising its flexibility. Many prior art commercial probes are designed to be used with 785 nm excitation. The methods of the present invention include the recognition that the fluorescence background generated in tissue with 785 nm excitation is at least four times greater than that generated with 830 nm excitation. Operating at 785 nm necessitates longer data acquisition times that is prohibitive for in-vivo applications. The longer the wavelength of operation, the better in terms of fluorescence background. In a preferred embodiment, the use of 830 nm is governed by the fundamental long wavelength limit (1100 nm) of the silicon based charge coupled device (CCD) detectors which is governed by the silicon band gap. Alternate preferred embodiments, can use 785 nm or 1064 nm excitation light with appropriate detector technology.
- A preferred embodiment of the present invention includes an optical fiber Raman probe which removes the optical fiber background, limits the length of the rigid distal tip to less than a few mm and the diameter to about two mm, for example, to facilitate use in coronary artery catheterization, employs 830 nm excitation and, maximizes signal collection from diffuse sources in order to allow data collection times of a few seconds or less.
- A preferred embodiment includes a rod and tube configuration in which the rod and tube of optical filter modules are coated separately which is easier than coating a single disc having two separate coatings: one in the center to filter the excitation light, and one at the edges to filter the collected light. These embodiments are preferable to coating individual fibers because the filter can adhere better due to the increased surface area. In addition, a two-tone disc is preferable to coating a single disc because it is difficult to deposit concentric coatings on a small diameter with a smooth circular interface without gaps or overlapping regions. Further, it is difficult to place three meter fiber lengths in deposition coating chambers. Each filter can include a stack of dielectric thin films. Such thin film filters can be fabricated by Research Electro-Optics Inc., Boulder, Colo.
- FIGS. 4A-4B show a longitudinal and transverse view, respectively, of a preferred embodiment apparatus including a Raman probe. The
apparatus 70 includes a two piece multiple, for example, dual wavelength micro-optical dielectric filter module for minimizing and preferably eliminating fiber Raman background in the delivery and collection fibers. This module consists of arod 82 carrying the excitation dielectric filter coating on one plane face, fitted into thetube 78 carrying the collection dielectric coating on one plane face of the tube. Rods and tubes are used in the embodiment that are made of either sapphire or fused silica which are separately coated with their respective filters prior to assembly. The rod is wrapped or coated with a thin sheet ofmetal 80 to provide optical isolation between the components. The module is then placed at the distal end of the probe between the fiber bundles and a lens system for collimating the light beams having alens 86 such as, for example, a ball lens. The lens collects light from high angles and a large area effectively overlapping excitation and collection regions. The ball lens can be fabricated and supplied by Edmund Industrial Optics, New Jersey. In a preferred embodiment, sapphire lenses that are coated with anti-reflection coatings and having an appropriate index for angular acceptance, for example, 1.77 is fabricated by MK Photonics, Albuquerque, N. Mex. Although it is expensive to obtain high quality interference filters at this scale, the cost of the filters is independent on the number of pieces coated, thus it is possible to coat many filters at once, thereby reducing the construction cost of each probe. Furthermore, through additional coating runs, the filter size can be adjusted to create smaller diameter probes for various applications. In a preferred embodiment, the filters are deposited on sapphire or quartz rods and tubes for proper registration with fibers. - FIGS. 4C and 4D show a longitudinal and transverse view, respectively, of an alternate preferred embodiment having a paraboloidal mirror disposed in the lens system. The collection angle can be in the range of 0 to approximately 55° with a collection diameter of approximately 1 mm. The paraboloidal mirror collects light from a wider angle and a larger area.
- Transmission characteristics of the excitation and collection fibers incorporating these filters are shown in FIG. 5 wherein 0 cm −1=830 nm.
- In accordance with preferred embodiments, the choice of fiber diameter and numerical aperture (NA), is dictated by the following considerations, for example, that the fiber Raman signal (produces unwanted background) is proportional to the square of the NA, and independent of the fiber diameter, that low NA is better, and that diameter has no effect.
- For the excitation fiber, using a lower NA fiber is useful, however there are issues to contend with. At the input end it makes coupling the energy into the fiber more difficult. In a preferred embodiment, when exciting with a laser with a low beam divergence, reasonable care in mounting the fiber and the matching optics avoids this problem. At the output end the beam is more confined. This makes the filter construction simpler and more efficient, but illuminating a larger area in order to minimize the potential of tissue damage due to confining the power of the incident beam to a smaller area (spot) can also be important. However, even a smaller diameter spot of laser excitation light incident on the tissue spreads to cover a larger area typically ½-1 mm diameter because of the aforementioned elastic scattering turbidity, thus mitigating this consideration. In a preferred embodiment a larger diameter fiber, or a distributed array of smaller fibers is used. Preferred embodiments balance the fact that low NA fibers typically exhibit an increased spectral background caused by dopants used in the core and cladding of the fiber to reduce the NA, and hence, use a modest core size and NA for the excitation fiber.
- For the collection fibers the situation is different. The Raman energy collected is proportional to the square of the NA. Therefore, from a signal-to-background analysis there is an advantage in using high NA collection fibers the size of which is limited by the spectrograph NA. Here, the best choice of fiber NA and fiber diameter is determined by the spectrometer NA, the desired spectral resolution, and considerations of matching optics, as well as the limitation set by filter acceptance angle. In a preferred geometry, one or a few number of delivery fibers are used as the energy of the laser source can be efficiently coupled into the delivery fiber/fibers. However, a greater number of collection fibers is important to increase the area of collection as shown in FIG. 4B. The area for collection is maximized since it is important to optimize collection of Raman light. Taking all these considerations into account, it is best to use as much of the available cross-sectional area of the optical fiber probe for collection fibers, keeping the number and diameter of the delivery fiber(s) to a minimum.
- Preferred embodiments include the following trade-offs. For the spectrometer chosen, the desired resolution determines a slit width. Considering the throughput theorem again, the requirement on the collection fibers is that the product of fiber NA and diameter equal the product of spectrometer NA and slit width. If it is possible to choose a fiber which satisfies the stronger condition that the fiber diameter equals the slit width and the fiber NA equals the spectrometer NA, the necessity of using matching optics is eliminated and the probe can be directly coupled into the spectrometer. If only the product requirement can be satisfied then matching optics are needed. At the output end the collection fibers are arranged in a straight line, which is imaged onto the entrance slit by the matching optics. Occasionally spectrometers use curved slits; the output end of the collection fibers can be modified to match any slit shape. An upper limit on the number of collection fibers is that the height of the fiber array image be less than the slit height or CCD chip, whichever is less. However a smaller limitation may be set by the space available in the collection tip.
- In a preferred embodiment, the fiber section of the probe includes a single central excitation fiber with an NA of 0.22 and a core diameter of 200 μm. The buffer of the fiber is matched to the diameter of the excitation filter rod, to facilitate proper fiber/filter registration, and has an aluminum jacket to provide optical isolation from the collection fibers. The 200 μm core diameter collection fibers are arranged in two different geometries in two alternate embodiments. The first embodiment consists of two concentric rings of 10 and 17 fibers for the inner and outer ring, respectively. The second embodiment has a single ring of 15 collection fibers. Although the second design has a slightly reduced collection efficiency, it is more flexible and still able to collect a high SNR spectra in short exposure times. The collection fibers all have an NA of 0.26 so that they are f/#-matched to the spectrograph for optimal throughput as illustrated in FIGS. 4A-4D. The diameter of the probe, in a preferred embodiment is less than 2 mm for access to coronary arteries.
- A preferred embodiment provides flexibility with respect to the particular choice of optics for high-throughput collection so that a variety of optical elements can be used to collect the desired AΩ-product. In a preferred embodiment, a ball lens provides highly efficient collection for front viewing optical fiber probes that closely match calculated collection over a radius of 0.35 mm for blood tissue (0.4 mm for artery tissue) while still collecting over large angles as shown in FIGS. 1A-1B and 4A-4B. Collection efficiencies greater than 30% are achieved if a small space is maintained between the sample and lens, greater than 10% when in contact with tissue, the likely and more reproducible in-vivo geometry. An example of the high quality spectra obtained with a preferred embodiment with the probe in contact with tissue is presented in FIG. 6 which shows the Raman spectrum of a non-calcified atherosclerotic plaque collected in 1 second with 100 mW excitation power. In contrast, FIG. 7 shows the spectrum of a normal artery taken with another preferred embodiment system in 10 seconds with the same excitation power.
- FIG. 8 is a schematic diagram illustrating a system for measuring tissue in accordance with a preferred embodiment of the present invention. A
light source 206 emitting at a wavelength longer than 750 nm, such as an argon pumped Ti: sapphire laser system or a diode laser is used. The diode laser may be an InGaAs laser emitting at 785 nm or 830 nm, such as, for example, fabricated by Process Instruments, Salt Lake City, Utah. The laser output is band pass-filtered and is coupled into the delivery optical fibers which are included in theprobe 204. Theprobe 204 is inserted into anartery 202 to diagnose and possibly treat the buildup of, for example, plaque in the artery. FIG. 15 is a partially sectioned view of a portion of coronary artery showing a probe in accordance with a preferred embodiment of the system of the present invention. The system may include a guidewire, and a guide catheter for threading through the large arteries. In a preferred embodiment, in an artery that is partially blocked byfatty material 416, the guide wire is first extended into the artery followed by the catheter which includes theballoon 420. A probe assembly is housed in the tip of the catheter and has acollection window 418. Once the balloon has entered theartery 414, the probe assembly provides a surgeon with a cross-sectional view of the artery. The balloon temporarily blocks blood flow providing a clear field of view, stabilizes the probe and minimizes effects of cardiac motion. Fluoroscopic markers may be used in preferred embodiments. The light is incident on the tissue and Raman-scattered light from the tissue is collected by the collection optical fibers. The collected light is notch-filtered and projected onto an entrance slot of a spectrophotometer. The notch filter removes Rayleigh—scattered laser light. Inside the spectrograph, a grating disperses light onto aCCD detector 228. The CCD interface and data storage and processing is provided in a computer such as a personal computer. A program such as Winspec Software provided by Princeton Instruments can be used to connect the CCD interface to the personal computer which performs the data processing and storage function. In alternate embodiments, the Labview program by National Instruments, Austin, Tex., is used to connect the CCD interface to the personal computer. Raman signals are read from the CCD, collected by the computer and stored on a computer readable media for later analysis or may be used for real time analysis in a clinical setting. - FIG. 9 illustrates the excitation light diffusing through tissue in accordance with a preferred embodiment of the present invention. FIGS. 10A-10C are graphical representations of the integrated radial distributions, integrated angular distributions and optimized collection efficiency, respectively, for blood tissue in accordance with a preferred embodiment of the present invention. FIG. 10C illustrates the collection efficiency by varying A and Ω illustrated in FIGS. 10A and 10B, respectively, but keeping the product AΩ constant and equal to that of the spectrograph. By the throughput theorem, the étendue is conserved where étendue is the product of area and solid angle. The radial and angular distributions are integrated and their product determines the
optimization curve 300. The collection optics are designed to perform at the maximum of theefficiency curve 300. Similar graphical illustrations for artery tissue are provided in FIGS. 38C-38E. - FIG. 11 is a
graphical representation 320 of an excitation spot diameter in accordance with a preferred embodiment of the present invention. FIG. 12 is an illustration of a ray diagram 340 of the distribution of excitation light in tissue in accordance with a preferred embodiment of the present invention. FIG. 13 is an illustration of a ray diagram 360 of the collection efficiency of a probe in accordance with a preferred embodiment of the present invention. - FIG. 14 graphically illustrates the collection efficiency of the probe in accordance with a preferred embodiment of the present invention. The efficiency from a measured distribution for tissue and air is illustrated. All components of the probe are constructed of medical grade materials that can withstand standard cold gas, ethylene oxide sterilization. Alternate sterilization methods as provided by Steris Corporation of Ohio can be used such as, for example, a low temperature sterile processing system. The filter module in the probe tip is assembled and attached to the fiber bundle using high purity sodium silicate as an index matching cement. The advantages of sodium silicate as an index matching cement in Raman spectroscopy are unique and its utility goes beyond the present application. The advantages include producing no interfering Raman spectrum, having an index of refraction close to that of fused silica, thereby greatly reducing the reflection losses from mating surfaces, having a low optical absorption in the near IR, so it introduces no appreciable absorption losses, having cementing properties that facilitate the assembly of the small optical components involved, and it is an article accepted in commerce with uses in many industrial applications.
- Sodium silicate is a ternary compound, created by mixing various combinations of water, silicon dioxide and sodium hydroxide, in the alternative sodium oxide. The optical and mechanical properties of the end product can be adjusted by varying these ratios. The other alkali silicates have similar properties, for example, lithium silicate, potassium silicate and can also be used in certain applications.
- It is important not to have any adherents between the ball lens and the filters so that there is no index matching that can compromise the lensing effect provided by the curvature of the lens. The lens is secured with a crimped retaining sleeve and sealed with medical grade epoxy to prevent fluid from leaking into the probe tip in accordance with a preferred embodiment of the present invention.
- The modular nature of the preferred embodiment probe is very versatile and can accommodate many optical embodiments. Additional embodiments for side-viewing probes as well as other front viewing embodiments for alternate applications are included in the systems of the present invention. For example the use of an angled and mirrored ball lens, a prism, or a micro-optical paraboloidal mirror allows efficient side-viewing probes. A tapered tip allows incorporation into needle probes for optical breast biopsies and a slightly smaller diameter in an alternate preferred embodiment allows breast analysis through ductoscopy. Other potential uses are for skin analysis, transcutaneous blood analyte monitoring, and gastrointestinal cancer evaluation.
- FIG. 16 illustrates a
signal 450 from a ball lens and function of laser power in accordance with a preferred embodiment of the present invention. The front-viewing Raman probe uses a sapphire ball lens to focus the excitation light and to collect the Raman signal from the tissue. The Raman spectrum from the sapphire lens can be used as an internal standard to calibrate collected signals relative to the excitation laser power, thereby obtaining intensity information. This intensity information is not typically exploited in biological Raman spectroscopy, but can provide enhanced diagnostic power. The graphical plot is generated using data taken with a preferred embodiment Raman probe and a clinical Raman system and represents the magnitude of the signal from the sapphire lens as a function of excitation power while the probe is held in the air. It is indicative of a natural internal standard for measuring power delivered to tissue using a preferred embodiment of the present invention. - FIG. 17 graphically illustrates a comparison of data from a normal artery collected using a preferred embodiment probe 472 and an
experimental system 474. To demonstrate and verify the function of the Raman probe, similar types of tissue are examined. It is demonstrated that similar spectra are obtained, and the signal-to-noise ratio (SNR) of the spectra is also examined, which is an indication of system performance as greater SNR translates to a system having less noise and indicates better performance. - FIG. 18 graphically illustrates a
Raman spectrum 490 of normal breast tissue examined with a probe in accordance with the present invention. Tissues other than an artery have been examined to demonstrate that the probes have multiple uses for disease diagnosis. The probes can be used in ductoscopy procedures for early diagnosis of breast cancer. - FIG. 19 graphically illustrates a comparison of Raman spectra of a breast tumor which is diagnosed as being malignant in accordance with a preferred embodiment of the present invention and as predicted by reference data of the present invention. The
data 502 as collected using a preferred embodiment probe is compared todata 504 generated by reference data. The reference data coefficients are tabulated in Table 1.TABLE 1 Component Coefficient (%) Calcium oxalate 11 Calcium hydroxyapatite 14 Cholesterol 2 Water 0 β- carotene 0 Fat 15 Collagen 45 Nucleus 0 Cytoplasm 12 - FIG. 20 graphically illustrates a comparison of morphological reference data to calcified aorta data collected using a probe in accordance with a preferred embodiment of the present invention. FIG. 20 illustrates the
Raman spectrum 522 of a calcified aorta obtained with the Raman probe and a clinical Raman system in 1 second with 100 mW excitation power. A fit with morphological reference data is shown asspectrum 524. Theresidual spectrum 526 is plotted below on the same scale. The lack of features in the residual indicate a high level of agreement between the observed data and referenced data, proving that the reference data in accordance with preferred embodiments of the present invention developed with the experimental in-vitro system can be applied to data taken with the preferred embodiment Raman probes. Also of note is that there are no features corresponding to any probe background in theresidual spectrum 526 indicating that any remaining, unfiltered background noise can be accurately removed. Further, the Raman spectra obtained from diseased artery does not diffuse as much in comparison to spectra obtained from normal artery, thus providing a spectra with a better level of signal-to-noise ratio (SNR). It should be noted that the SNR is affected by both Raman cross-sections of the tissue and the distribution of light. - In a preferred embodiment, the non-axial Raman probe in accordance with the present invention for use in diagnosing atherosclerosis is incorporated in a catheter of the type used for angiography, for example. It includes a balloon for displacing blood and other fluids and to position the catheter in the artery. A preferred embodiment includes a channel for balloon inflation. Further, the catheter system includes the capability for flushing away the blood temporarily with a fluid, for example, saline. One or several optical fibers can be configured so as to direct excitation light in a non-axial direction, either to the side or at an angle ranging from 45°-90°. In such a preferred embodiment a balloon disposed on the side is used to contact the fibers adjacent the artery wall, and displace blood or other intervening fluids.
- Alternately, the delivery fibers can be arranged to direct light in a circular pattern at an angle to the axis of the probe. The different collection fibers collect light simultaneously from different portions of the circumferential region illuminated. In this embodiment, the probe is enclosed in an inflatable balloon which is inflated before light delivery and/or collection to displace blood and other fluids. In preferred embodiments, the balloon is of a type used in arterial applications, such as, for example, angioplasty, and are made of thin material so as to allow excitation light to pass through to the artery wall, and return Raman light generated in the artery wall to pass through the balloon to the collection fibers.
- FIG. 21A illustrates a
longitudinal view 550 of an alternate preferred embodiment of the side-viewing probe for measuring tissue in accordance with a system of the present invention. The embodiment includes a modifiedaxicon 556 in which the surfaces of the angled sides are made elliptical. FIGS. 21B and 21C are preferred alternate embodiments including at least two different radii of curvature on the angled surface to provide circumferential imaging. Circumferential imaging can be obtained in an embodiment by providing beams ranging from approximately 45°-90° angle and rotating the probe to get a circumferential image. Alternatively, delivery fibers can provide light to the tissue and image, such as, for example, six images are collected in collection fibers to get a circumferential image. In one preferred embodiment, the volume between thefilters 554 and the angled portion of theaxicon 556 comprises solid glass, preferably sapphire wherein the redirection of light occurs via total internal reflection. - In the alternate preferred embodiment as illustrated in FIG. 21B the
angled surfaces 562 of theaxicon 556 are mirrored which allow for reflections. The laser light is directed radially or non-axially onto the tissue 564. Further, thesurface 565 is elliptical and fabricated using sapphire. The volume between thefilters 554 and theaxicon 556 may either be filled or empty. This embodiment as illustrated in FIG. 21C provides an opencentral channel central channel - FIG. 21D illustrates a view of a preferred embodiment of a side-viewing probe, or non-axial viewing probe, and
catheter 610 delivering light onto a portion oftissue 612 and Raman light collected from the tissue and reimaged on a point at a second surface in accordance with a preferred embodiment of the present invention. The side-viewing probe includes aninflatable balloon 614 or flexible wire installed adjacent the side-looking element across from its viewing aperture. Upon balloon inflation or wire inflexion, the aperture is pressed into contact with theartery wall 616 displacing blood and/or establishing a well-defined collection geometry. - As discussed briefly hereinbefore, recent studies have shown that chemical composition and morphology, rather than anatomy (degree of stenosis), determine atherosclerotic plaque instability and predict disease progression and the risk of life-threatening complications such as thrombosis and acute plaque hemorrhage. For example, the presence of cholesterol esters may soften the plaque, whereas crystalline-free cholesterol may have the opposite effect. Raman spectroscopy can identify cholesterol esters from free cholesterol as illustrated in FIGS. 35F and 35G. Prior art clinical diagnostic techniques provide accurate assessment of plaque anatomy, but have limited capability to assess plaque morphology in-vivo. Further, prior art diagnostic imaging techniques such as intravascular ultrasound (IVUS), MRI, and angiography provide predominantly anatomic information about the extent of luminal stenosis, but yield only limited information about lesion composition. Coronary angiography, still the “gold standard” for diagnosing coronary artery disease, shows the degree of luminal stenosis, but provides no chemical or morphologic information about the plaque. In fact, unstable atherosclerotic plaques are often “silent” on angiography. IVUS, the most accurate and quantitative technique currently in clinical use, uses the reflection of acoustical waves delivered by an intravascular catheter to probe tissue density and provide imaging information. It has advanced the understanding of atherosclerosis significantly by demonstrating extensive atherosclerosis in coronary arteries that appear normal on angiography. However, although IVUS can identify the presence of an atheroma core, it cannot specifically identify foam cells (FC) or cholesterol crystals (CC) and does not provide any chemical information. MRI has the advantage of being a noninvasive technique, and uses radio waves generated by applying a magnetic field gradient to again probe tissue density and provide imaging information. Like IVUS, it can be used to analyze anatomy and, to a lesser extent, morphology. However, conventional proton MRI techniques used clinically largely ignore and often suppress the chemical shift information. Thus, currently plaque morphology and chemical composition can only be assessed by microscopic examination of excised tissues after endarterectomy or atherectomy.
- The preferred embodiment of the present invention includes a method for a morphology-based diagnosis of atherosclerosis in the coronary arteries using Raman spectroscopy that can potentially be performed in-vivo using optical fiber technology. In a preferred embodiment, Raman tissue spectra are collected from normal and atherosclerotic coronary artery samples in different stages of disease progression (n=165) from explanted transplant recipient hearts (n=16). Raman spectra from the elastic laminae (EL), collagen fibers (CF), smooth muscle cells (SMC), adventitial adipocytes (AA) or fat cells, foam cells (FC), necrotic core (NC), cholesterol crystals (CC), β-carotene containing crystals (β-C), and calcium mineralizations (CM) are used as basis spectra in a linear least squares-minimization (LSM) model to calculate the contribution of these morphologic structures to the coronary artery tissue spectra. The preferred embodiment includes a diagnostic sequence of instructions that uses the fit-contributions of the various morphologic structures to classify 97 coronary artery samples in an initial calibration data set as either nonatherosclerotic, calcified plaque, or noncalcified atheromatous plaque. The sequence of instructions correctly classifies 64 (94%) of 68 coronary artery samples prospectively. Raman spectroscopy provides information about the morphologic composition of intact human coronary artery without the need for excision and microscopic examination. Thus, a preferred embodiment uses Raman spectroscopy to analyze the morphologic composition of atherosclerotic coronary artery lesions and assess plaque instability and disease progression in-vivo.
- The present invention includes acquiring quantitative morphologic information regarding lesion composition from coronary arteries by Raman spectroscopy using a modification of mathematical reference data. This morphologic information can be used for diagnostic purposes. The chemical and morphologic information obtained by Raman spectroscopy can be the basis of a diagnostic assessment of human coronary artery disease.
- In principal, both quantitative chemical and morphologic information regarding atherosclerotic lesion composition can be obtained from the same Raman spectrum. A preferred embodiment of the present invention analyzes coronary artery tissue by modeling of Raman tissue spectra using the spectra of morphologic structures rather than biochemical components as a basis set. Basis spectra for the reference data are obtained from morphologic structures commonly observed in the normal artery wall and in atherosclerotic plaque, including collagen fibers (CF), the internal and external elastic laminae (EL), smooth muscle cells (SMC), adventitial adipocytes (AA) or fat cells, foam cells (FC), necrotic core (NC), cholesterol crystals (CC), β-carotene containing crystals (β-C), and calcium mineralizations (CM). These basis spectra can then be used to linearly fit the spectra of an initial calibration set of coronary artery specimens. Using the fit-contributions of the various morphologic structures, an algorithm is included in a preferred embodiment that classifies the arteries as atherosclerotic or nonatherosclerotic as in a biochemical model. The diagnostic performance of the preferred embodiment can be tested by applying morphology-based reference data, to a second, prospective, validation set of coronary arteries.
- In a preferred embodiment, tissue preparation includes obtaining from explanted recipient hearts, within 1 hour after heart transplantation, human coronary artery samples (n=200) from 16 patients, exhibiting different stages of atherosclerosis. Seven patients had heart failure due to dilated cardiomyopathy and nine due to severe ischemic heart disease. Immediately after dissection from the explanted heart, the artery segments were rinsed with neutral-buffered saline solution, snap-frozen in liquid nitrogen, and stored at −85° C. until use. The artery samples were collected in two sets, the first containing 113 (calibration set) and the second, 87 samples (prospective validation set).
- These artery samples can be and were used for macroscopic and microscopic Raman spectroscopy studies. For the macroscopic study, the samples ( 97 and 68, from the first and second sets, respectively) were warmed passively to room temperature, cut open longitudinally, placed in an aluminum holder with the lumen side upwards, and examined under ×10 magnification for selection of the region to be evaluated. After spectroscopic examination, each spot interrogated was marked with a small spot of colloidal ink, and fixed in 10% neutral-buffered formalin.
- For the collection of the Raman spectra using a microspectrometer unstained, transverse tissue sections (6-8 μm) were cut from the coronary artery samples. Four sections of each sample were mounted on glass microscope slides and stained for light microscopic examination, whereas serial unstained transverse sections were mounted on BaF 2 or MgF2 flats (International Scientific Products, Tarrytown, N.Y. and Spectra-Tech, Stamford, Conn.), kept moist with phosphate buffered saline (pH 7.4), and transferred to the microscopic stage for spectroscopic experiments. No coverslip was used. Under white light illumination, the major morphologic structures were selected and recorded on videotape under ×10 and ×63 magnification.
- The formalin-fixed macroscopic tissue samples were processed, paraffin-embedded, and cut through the marked locations in 5-μm thick sections, stained with hematoxylin and eosin, and examined by two experienced cardiovascular pathologists. The tissue sections were classified according to the updated Systemized Nomenclature of Human and Veterinary Medicine (SNoMed). The samples in both the calibration and validation data sets were diagnosed as either (1) normal (n=12 and 1), (2) intimal fibroplasia (n=61 and 25), (3) atherosclerotic plaque (n=3 and 0), (4) atheromatous plaque (n=6 and 16), (5) calcified atherosclerotic plaque (n=1 and 3), (6) calcified atheromatous plaque (n=7 and 13), (7) calcified fibrosclerotic plaque (n=5 and 10), or (8) calcified intimal fibroplasia (n=2 and 0, respectively). Because some of these categories had small sample numbers, the eight categories were condensed into three diagnostic classes for the development of a diagnostic algorithm: Class I, nonatherosclerotic tissue (
Categories Categories - The macroscopic and microscopic Raman spectra were obtained using the Raman spectroscopy system shown in FIG. 22. Near-infrared (NIR) laser light (830 nm) is generated by an Ar +-pumped Ti:
sapphire laser system 572, 574 (Coherent Innova 90/Spectra Physics 3900S, Coherent, Santa Clara, Calif.). The laser output is band pass-filtered (Kaiser Optical Systems HLBF, Ann Arbor, Mich.) and, by insertion of aprism 578, either projected onto the tissue sample in the macroscopic setup, or projected into aconfocal microscope 600 and focused onto the tissue section with a ×63 infinitely corrected water immersion objective (Zeiss Achroplan, NA 0.9). In the macroscopic setup, Raman-scattered light from the tissue (sampling volume 1-2 mm3) is collected with a lens, Notch-filtered 588, and focused onto the entrance slit of a Chromex 250IS/SM spectrophotometer (Chromex, Albuquerque, N. Mex.). In the microscope setup (sampling volume approximately 2×2×2 μm3), the Raman light scattered from the tissue is collected with the same objective that is used to focus light onto the sample, passed through a pinhole (giving the system its confocal characteristic), Notch-filtered, and projected onto the entrance slit of the spectrophotometer. Inside thespectograph 580, a grating disperses light onto a deep-depletion CCD detector 582 (Princeton Instruments, Princeton, N.J.) cooled to −110° C. The CCD interface (ST130, Princeton Instruments), along with data storage and processing, is rendered on apersonal computer 584. - For the macroscopic measurements, the laser power is 350 mW, and the signal collection time is in the range 10-100 s. For the microscopic measurements, the laser power is 80-120 mW, and the signal collection time is 60-360 s, and the Raman spectra is collected in the range between 400 and 2000 cm −1 (
resolution 8 cm−1). - Each spectrum is frequency-calibrated and corrected for chromatic variations in spectrometer system detection. A fourth-order polynomial is fit to each spectrum and subtracted from the spectrum to correct for remaining tissue fluorescence. The macroscopic tissue spectra can be modeled in the 680-1800 cm −1 Raman shift range as a linear combination of the morphologic structure basis spectra by LSM. This Raman shift range is chosen, because this range contains the most spectral information.
- The morphologic structure Raman spectra can be normalized with respect to their maximum peak intensity. All spectra in the two data sets can be modeled accurately with the final set of eight morphologic basis spectra. The Raman spectral reference data calculated the fractional fit-contribution of seven of the morphologic structures. The eighth structure, β-carotene, is an intense Raman scatterer that often contributes to coronary artery Raman spectra, but is present only in low concentrations. For this reason, its spectrum is included in the spectral reference, but no fractional fit-contribution is calculated.
- In calcified atherosclerotic plaques, CM often occupy large volumes of the tissue examined by Raman spectroscopy. To obtain information about the remaining noncalcified regions, and to compare the morphologic structure fractional fit-contributions among the different disease classes, the spectra of calcified plaques are renormalized, neglecting the contribution of calcium mineralization, and the morphologic structure fractional fit-contributions of the noncalcified regions (denoted by X NCR) is calculated.
- The relative fit-contribution of each morphologic structure to the spectra in the calibration data set is used to develop the algorithm or sequence of instructions to classify the tissue into one of the three diagnostic classes. The method of logistic regression can be used to generate a discriminant score, R 1, based on a linear combination of relative fit-contributions (Cl) of each morphologic structure l as Ri=αi+β1iC1+β2iC2+ . . . with αi being a constant and βli an adjustable coefficient for each morphologic structure. This method is chosen over discriminant analysis, because logistic regression does not make any assumptions about the normalcy of the fit-coefficients.
- Using maximum likelihood estimation with an analytical tool, for example, the software package STATA (Release 5.0, Stata, College Station, Tex.), the probability that an artery sample j is nonatherosclerotic (P jI), or contains a noncalcified atherosclerotic plaque (PjII), or contains a calcified atherosclerotic plaque (PjIII) is determined as


- which sum to one. Furthermore, using a likelihood-ratio test on the initial calibration data set, it can be determined which morphologic structure relative fit-contributions are significant for diagnosis, and what diagnostic thresholds for these relative fit-contributions correctly classify the most samples. The algorithm so developed can then be used to prospectively classify the artery samples in the second validation data set.
- To determine the level of error in the reference data, it is necessary to analyze the signal/noise ratio (SNR) of the spectra being used. Because the microscopic Raman artery spectra of the morphological reference data can be collected for arbitrarily long times, they are virtually noise-free as illustrated in FIG. 23 which graphically illustrates the Raman spectra of eight selected coronary artery morphological structures in accordance with a preferred embodiment of the present invention. Therefore, the limiting source of error in the reference is due to noise in the macroscopic spectra of the intact arteries. The in-vitro system is shot noise-limited, and therefore, the noise for any given sample is equal to the square root of the signal. Following standard multivariate analysis techniques, the concentration error is proportional to the noise in the spectrum.
- E=N×B (3)
- where B=P T(PPT)−1, is the calibration vector for the morphologic basis spectrum of interest, and N is the noise in the sample.
- FIGS. 2A-2C described hereinbefore show macroscopic Raman spectra collected from coronary artery samples representing each of the three diagnostic classes (normal coronary artery (FIG. 2A), noncalcified atherosclerotic plaque (FIG. 2B), and calcified atherosclerotic plaque (FIG. 2C)), together with LSM reference data. The solid lines are the macroscopic spectra and the dotted lines are indicative of the reference data. Residual (data minus the fit) are shown on the same scale. For all spectra, the calculated fit agrees well with the measured spectrum, which suggests that the morphologic basis spectra are a reasonably complete representation of the Raman spectra of the macroscopic tissue samples.
- The Raman spectra of all 97 coronary artery samples in the calibration data set, which were classified by a pathologist into one of the three diagnostic classes, can be analyzed in the same way. The mean ± standard error of the mean for the relative fit-contribution of all eight selected morphologic structures in nonatherosclerotic tissue (I), noncalcified atherosclerotic plaque (II), and calcified atherosclerotic plaque (III) are shown in FIGS. 24A-24C, respectively. These figures clearly show that Raman spectroscopic modeling is able to detect morphologic changes in coronary artery tissue. The morphologic Raman reference data showed, as expected, that nonatherosclerotic tissue consisted mainly of AA, CF, EL, and SMC (FIG. 24A). In nonatherosclerotic artery, the intima is thin and therefore, the contribution of the adventitial layer (which contains a relatively large amount of adipose tissue) to the spectroscopically examined tissue volume is large, because the NIR laser light penetrates through the entire vessel wall. In noncalcified and calcified atherosclerotic plaque, the morphologic Raman reference data revealed a dramatic change of the morphologic composition with progression of disease. In noncalcified atherosclerotic plaques, where the initima is thickened, the AA contribution decreased, whereas the contribution of FC/NC and CC increased (FIG. 24B) due to accumulation of lipids in the plaque. Raman spectra of calcified atherosclerotic plaques are dominated by the CM contribution (FIG. 24C). The contribution of AANCR and CFNCR in calcified atherosclerotic plaque is larger than that of AA and CF in noncalcified atherosclerotic plaque. The reduced CFNCR in non-calcified plaques is an indication of decreased plaque stability.
- Although the concentration of β-carotene in arterial tissue is low, the modeling outcome showed large differences in the contribution of carotenoids among the disease classes as illustrated in FIG. 25. The largest contribution is found in noncalcified atherosclerotic plaques, since β-carotene is a lipophilic substance that dissolves easily in the NC.
- Using logistic regression, it is determined that an optimal separation of the data into three diagnostic classes can be obtained using the fit-contributions of CM and FC/NC NCR+CCNCR, with P<0.0001 using a likelihood-ratio test. In addition, the likelihood ratio test determined that no improvement in classification resulted from inclusion of any of the remaining morphologic structures (P<0.05). The discriminant scores are determined to be Rj1=−420.4+1870.0×(FC/NCNCR+CCNCR)−6094.3×CM, and Rj2=−8.3+23.3×(FC/NCNCR+CCNCR)+47.6×CM.
- The fit-contributions of CM and FC/NC NCR+CCNCR of each artery sample can be plotted in a decision diagram as illustrated in FIG. 26A, using the corresponding R1 and R2 values. The border separating the regions of nonatherosclerotic tissue and noncalcified atherosclerotic plaque is given by PI=PII, which is a line described by the equation CM=−0.07+0.31×(FC/NCNCR+CCNCR). The border separating the regions of nonatherosclerotic tissue and calcified atherosclerotic plaque is given by PI=PIII, and has the equation CM=0.17−0.48×(FC/NCNCR+CCNCR). The line separating the regions of noncalcified atherosclerotic plaque and calcified atherosclerotic plaque is given by PII=PIII, and has the equation CM=−0.07+0.30×(FC/NCNCR+CCNCR). For 95 of the 97 (98%) samples in the initial calibration data set, the decision determined by the Raman-based diagnostic algorithm correlated with that of the pathologist.
- This algorithm was also used prospectively in a preferred embodiment to classify the artery samples of the second validation data set into one of the three diagnostic classes as illustrated in FIG. 26B. Prospectively, the algorithm result agreed with that of the pathologist for 64 of 68 (94%). Comparison of the pathologic and Raman spectroscopic diagnoses for both data sets is shown in Table 2.
TABLE 2 Comparison of Pathologic Diagnosis with the of the Morphology-based Raman Diagnostic Algorithm Raman diagnosis Pathology diagnosis I II III Total Calibration data set I 72 0 1 73 II 0 9 0 9 III 1 0 14 15 Total 73 9 15 97 Prospective data set I 26 0 0 26 II 0 12 4 16 III 0 0 26 26 Total 26 12 30 68 - The classes are (1) nonatherosclerotic tissue, (II) noncalcified plaque, and (III) calcified plaque.
- Because the in-vitro Raman system used for collecting macroscopic artery spectra is shot-noise limited, the NIR techniques used in acquiring the data have resulted in extremely high SNR spectra. The average peak-to-peak noise is less than 0.04 counts on normalized spectra. Calculation of error on the fit-coefficients of diagnostic morphologic components yield a three standard deviation (SD) error of 0.041 for CM, and a three-SD error of 0.036 for FC/NC NCR+CCNCR.
- In another preferred embodiment, thirty-five coronary artery samples were taken from 16 explanted transplant recipient hearts, and thin sections were prepared. Using a high-resolution confocal Raman microspectrometer system with an 830-nm laser light, high signal-to-noise Raman spectra were obtained from the following morphologic structures: internal and external elastic lamina, collagen fibers, fat, foam cells, smooth muscle cells, necrotic core, β-carotene, cholesterol crystals, and calcium mineralizations. Their Raman spectra can be modeled by using a linear combination of basis Raman spectra from the major biochemicals present in arterial tissue, including collagen, elastin, actin, myosin, tropomyosin, cholesterol monohydrate, cholesterol linoleate, phosphatidyl choline, triolein, calcium hydroxyapatite, calcium carbonate, and β-carotene.
- The results show that the various morphologic structures have characteristic Raman spectra, which vary little from structure to structure and from artery to artery. The biochemical model describes the spectrum of each morphologic structure well, indicating that the most essential biochemical components are included in the reference data. Furthermore, the biochemical composition of each structure, indicated by the fit contributions of the biochemical basis spectra of the morphologic structure spectrum, are very consistent. Thus, the Raman spectra of various morphologic structures in normal and atherosclerotic coronary artery may be used as basis spectra in a linear combination model to analyze the morphologic composition of atherosclerotic coronary artery lesions.
- Raman spectroscopy has great potential for biochemical analysis of tissue on both the macroscopic and microscopic scale. One of the great advantages of this method is its ability to provide information about the concentration, structure, and interaction of biochemical molecules in their microenvironments within intact cells and tissues (i.e. in-situ), nondestructively, without homogenization, extraction, or the use of dyes, labels, or other contrast-enhancing agents. In addition, Raman spectroscopy can be performed in-vivo using optical fiber technology as described hereinbefore.
- Using the predicate that morphologic factors may be as important as biochemical composition in determining plaque stability and progression, a preferred embodiment of the present invention includes the morphology-based diagnosis of atherosclerotic lesions in arterial tissue using Raman spectroscopy. To that end, in-situ Raman spectra of individual cellular and extracellular components of normal and atherosclerotic human coronary artery tissue were obtained in-vitro using confocal Raman microspectroscopy described hereinbefore. The biochemical composition of these microscopic morphologic structures were then determined by modeling their Raman spectra using a linear combination of basis Raman spectra of biochemicals in a similar way as used previously for intact tissue. Analogous to the macroscopic Raman spectroscopy biochemical analyses, these macroscopic Raman spectroscopy morphologic analyses can ultimately be used in a diagnostic algorithm to assess atherosclerotic plaque stability and disease progression in-vivo. Human coronary artery samples (n=35), exhibiting varying stages of atherosclerosis, were obtained from explanted recipient hearts (n=16) within 1 hour of heart transplantation. Immediately after dissection from the explanted hearts, the artery samples were rinsed with neutral buffered saline, snap frozen in liquid nitrogen, and stored at −85C.
- Frozen coronary artery samples were mounted on a cryostat chuck with Histoprep (Fisher Diagnostics, Orangeburg, N.Y.). Thin transverse tissue sections (6-8 μm) for light microscopy and Raman microspectroscopy were cut using a cryostat/microtome (International Equipment, Needham Heights, Mass.). Four sections of each sample were mounted on glass microscope slides and stained with hematoxylin and eosin. Serial unstained sections were then mounted on BaF 2 or MgF2 flats (International Scientific Products, Tarrytown, N.Y., and Spectra-Tech., Stamford, Conn.), kept moist with phosphate buffered saline (pH 7.4), and transferred to the microscope stage for spectroscopic experiments performed at room temperature. No coverslip was used for spectroscopic measurements. If spectra were collected from a large number of morphologic structures, each section was replaced by a freshly cut section after approximately 2 hours to avoid biochemical changes in the tissue as a result of enzymatic degradation. No significant changes were seen in the Raman spectra within this 2 hour period of study. The morphologic structures examined were in normal arteries: collagen fibers in the various layers of the arterial wall, internal and external elastic laminae, medial smooth muscle cells, and adventitial fat cells, and in intimal atherosclerotic lesions: collagen fibers in the fibrous cap, foam cells, necrotic core, cholesterol crystals, β-carotene-containing crystals, and calcium mineralizations.
- A schematic representation of the system in accordance with the preferred embodiment of the present invention is shown in FIG. 27. All Raman spectroscopic measurements are carried out using a confocal configuration in order to suppress signal Raman light from features that are in peripheral surfaces other than the region of interest of the selected morphologic structure. The observation and analysis used a microscope (
Zeiss Axioskop 50, Zeiss, Thornwood N.Y.), fitted with a phase contrast system and a stage controller (Prior Scientific Instruments, Cambridge, Mass.). Initial examination of the sample was performed with phase contrast microscopy at 10× magnification (Zeiss Achroplan objective). Detailed examination and microspectroscopy were performed with 63× infinitely corrected water immersion objective (Zeiss Achroplan, NA 0.9). The phase contrast tissue examination and morphologic structure selection for microspectroscopy were recorded using a CCD color video camera 758 (Sony, Cambridge, Mass.) attached to themicroscope 750 and stored on video tape (VCR) 764 from which frames were digitized (PCVision-plus, Imaging Technologies, Bedford, Mass.). - Near-infrared (830 nm) laser light was generated by an Ar + laser 742-pumped Ti: sapphire laser system 744 (
Coherent Innova 90/Spectra Physics 3900S, Coherent, Santa Clara, Calif.). The laser output was band pass filtered 746 (F1) (Kaiser Optical Systems HLBF, Ann Arbor, Mich.) and focused onto the sample using an adjustable mirror (m1) 748, and a dichroic beamsplitter (m2) 754, with a laser power on thesample 756 of 50-100 mW. Light emitted from the tissue sample was collected by the same objective, passed through the beamsplitter and passed through a pinhole (P: 100 μm diameter) by a removable mirror (m3) 752. This mirror was used to direct either light emitted from the sample to the spectrometer/CCD system, or white light images to the video camera system. The light directed to the CCD/spectrometer is then Notch-filtered to reject Rayleigh scattered light (F2; Kaiser Optical Systems HSNF) and focused with an achromatic lens (L) into a Chromex 250IS/SM spectrograph-monochromator (Chromex, Albuquerque, N. Mex.). Thespectrograph 766 includes a grating dispersed light onto a back illuminated deep-depletion CCD detector 768 (Princeton Instruments, Princeton, N.J.) cooled to −100° C. The CCD interface (ST130 Princeton Instruments) was connected to apersonal computer 774 using Winspec software (Princeton Instruments, version 1.4.3), which performed data processing and storage. At least three Raman spectra (sampling time between 10 and 100 s) over a range of 100-2000 cm−1 (8 cm−1 resolution) were obtained from each site selected. - The method to estimate the light collection or sampling volume of the confocal Raman microspectrometer uses a small (1-2 μm 3) collection volume to insure adequate resolution to collect Raman spectra from small or thin microscopic structures, such as individual collagen fibers. In short, polystyrene beads of 1.0 μm diameter (Polysciences, Warrington, Pa.) were moved through the focused laser beam, and the Raman signal was collected as a function of the bead position relative to the center of the laser focus. The step resolution of the microscope stage in the horizontal plane was 1 μm. Vertical displacement proceeded in 1.1 μm steps. The position is optimized to obtain the maximal Raman signal of the bead. Lateral resolution is determined by alternately measuring the Raman signal of the central position and one of eight positions in the X or Y direction from the center of the bead using 1- or 2-μm steps. The intensity of the strong 1004 cm−1 polystyrene Raman band is measured as a function of the distance to the laser focus in both the planar directions and the axial direction. The result for each direction is then fitted with a Gaussian function, and the diameter of the focused beam is determined from the full width at half-maximum intensity (FWHM). For both lateral directions, the diameter is about 1 μm while the axial direction is 2 μm. The sampling volume is calculated to be about 2 μm3.
- Data analysis of Raman spectra from morphologic structures is performed with Microcal Origin software (version 4.10, Clecom, Birmingham, UK). This analysis consists of cosmic ray removal, wavenumber shift calibration using the spectral features of toluene (Mallinckrodt Specialty Chemicals, Paris, Ky.) and correction for chromatic variation in the filter/spectrometer/CCD detector system with a calibrated tungsten light source. The tissue spectra is then corrected for BaF 2 or MgF2 background contribution by subtraction of the appropriate spectrum, and corrected for tissue fluorescence by subtraction of a fourth-order polynomial that is fitted to the spectrum by least-squares minimization (LSM).
- Each morphologic structure spectrum is modeled in the Raman shift range of 700-1800 cm −1, using a simple linear combination reference to generate fractional fit contributions (C1) for each of the 12 biochemical components, as
- r total =C 1 r 1 +C 2 r 2 +C 3 r 3 (4)
- where r is the Raman spectrum. The 700-1800 cm −1 Raman shift range is chosen because this range contains most spectral information.
- Reagent grade commercial chemicals (Sigma, St. Louis, Mo.), are used to obtain the Raman spectra, for use as basis spectra, of the 12 biochemical components, including proteins (collagen type III, elastin, actin, myosin, and tropomyosin), unesterified cholesterol (cholesterol monohydrate), cholesterol esters (cholesterol linoleate), phospholipids (phosphatidyl choline), triglycerides (triolein), carotenoids (β-carotene), and calcium salts (calcium hydroxyapatite and calcium carbonate). These 12 biochemical components are selected as the most common Raman active biochemical species found in normal arterial tissue and atherosclerotic plaque. Additionally, a similar set of biochemical constituents has provided good fit of the reference data to the observed spectrum in previous macroscopic tissue studies. The Raman spectra from these chemicals is recorded in a similar way as the Raman spectra from the morphologic structures.
- The reference data components cannot be scaled on chemical weight, since the actual concentration of the biochemicals in the various morphologic structures in unknown. Therefore, the intensity of the spectral feature at 1440-1455 cm −1 (representing the bonding of CH2 bonds in protein and lipid) is set to unity. The Raman spectra of β-carotene, calcium carbonate, and calcium hydroxyapatite, which lack spectral features in this region, are set to unity with respect to spectral features at 1159, 1080, and 961 cm−1, respectively. This reference thus provides information about the relative fit contribution of these chemical components to the Raman spectra of the various morphologic structures. The fit contribution of each biochemical component is expressed as a fraction of the maximum (i.e. 1).
- FIG. 28A is a photomicrograph of an unstained coronary artery section showing the internal elastic lamina viewed under phase contrast. This structure is examined at a total of 54 sites in 21 coronary artery samples. In nine of these samples, were collected spectra from the external elastic lamina. In FIG. 28B, the Raman spectra of six different internal elastic laminae are shown. The bands at 1664 and 1264 cm −1 are attributable to the amide I and III vibrations, respectively, of structural proteins such as elastin and collagen. The intense band at 1449 cm−1 can be assigned to the CH2 and CH3 bending mode of proteins, while the 1004 cm−1 band is due to phenylalanine. The bands at 1336 and 1104 cm−1 are attributable to desmosine/isodesmosine, and are specific for elastin. The bands at 933 and 855 cm−1 can be assigned to the C—C stretching mode of proline and are present in collagen. These results indicate that internal elastic lamina contains both elastin and collagen. Furthermore, on visual inspection, these spectra show very little variation from structure to structure, indicating that the biochemical composition of internal elastic lamina is very consistent within and between coronary artery samples. Spectra obtained from the external elastic lamina are identical to those obtained from the internal elastic lamina.
- FIG. 29A is a phase contrast photomicrograph showing collagen fibers (length approximately 10 μm , diameter approximately 2 μm) in the connective tissue of the tunica adventitia. In total, 17 collagen fibers in 10 samples were studied. FIG. 29B shows the Raman spectra from collagen fibers from three different artery samples. Again, on visual inspection, these spectra collected from the adventitia (a, b) show little variation from fiber to fiber within or among coronary artery samples, and are identical to those taken from collagen fibers in the fibrous cap (c) of intimal atherosclerotic lesions. These spectra are also very similar to those from the elastic laminae, except for the absence of desmosine and isodesmosine bands (specific for elastin). The collagen fiber spectra also contain a pronounced hydroxyproline contribution (855 cm −1) specific for collagen.
- FIG. 30 shows four Raman spectra recorded from smooth muscle cells in the tunica media in normal and atherosclerotic coronary artery samples in accordance with a preferred embodiment of the present invention. In total, 32 spectra were recorded from 10 coronary artery samples. On visual inspection, no significant differences were observed between spectra taken from individual smooth muscle cells. The main spectral features in the smooth muscle cell spectra are similar to those observed in the elastic laminae and collagen fiber spectra, and are dominated by protein bands at 1660 and 1268 cm −1 (amide I and III vibrations, respectively), 853, 940, 1034, 1336 and 1451 cm−1 (C—C or C—H bending), and 1004 cm−1 (phenylalanine). The main differences between the protein-dominated smooth muscle cell, elastic laminae, and collagen fiber spectra are in intensity variations in the phenylalanine (1004 cm−1), desmosine/isodesmosine (1336 and 1104 cm−1) and amide III (1268 cm−1)bands.
- FIG. 31 shows examples of Raman spectra collected from fat cells (adipocytes) in the tunica adventitia in accordance with a preferred embodiment of the present invention. In total, eight adipocytes were examined from six coronary artery samples. The spectra collected from the fat cells are very similar, and are dominated by an ester band (1747 cm −1), an unsaturated carbon/carbon band (C═C; 1654 cm−1), and CH2/CH3 bands (1440 and 1301 cm−1), which, in combination, indicate triglycerides.
- FIG. 32A is a phase contrast photomicrograph of foam cells in the intima of an atheromatous plaque. The individual lipid droplets in these cells can easily be identified. In total, 30 foam cells in eight coronary artery samples were studied. In FIG. 32B, the Raman spectra from three foam cells are shown (a-c). Although similar on visual inspection, these spectra show more variation among foam cells than the spectra of collagen fibers, the internal and external elastic laminae, and smooth muscle cells. More specifically, the foam cell spectra are distinctly different from the protein-dominated spectra of the elastic laminae, collagen fibers, and smooth muscle cells, particularly with regard to the numerous bands below 1100 cm −1. The bands at 702, 878, 923, and 957 cm−1 can be assigned to the steroid nucleus of both unesterified (free) cholesterol and cholesterol esters. The intense bands at 1671, 1439, 1299, and 1270 cm−1 are due to C═C stretch and CH2/CH3 bending modes. The presence of bands at 1735 and 1026 cm−1 (specific for cholesterol esters) and 1058 and 1328 cm−1 (specific for free cholesterol) indicates that these foam cells contain both esterified and unesterified cholesterol. As discussed previously, the reduced CFNCR in non-calcified plaques is indicative of decreased plaque stability. The bands at 719 cm−1 (symmetric choline stretch), 762 cm−1 (symmetric O—P—O stretch), and 878 cm−1 (asymmetric O—P—O stretch) indicate the presence of phospholipids, and those at 1523 and 1160 cm−1 the presence of β-carotenoids. However, the foam cell spectra lack the triglyceride bands at 1747, 1654, 1440, and 1301 cm−1 seen in adventitial fat cells.
- In total, 31 necrotic core regions in 16 coronary artery samples were studied. FIG. 32B also shows two examples of Raman spectra collected from necrotic core (d and e). Similar to the foam cell spectra, there is some variation from structure to structure within the necrotic core. However, the average spectra from foam cells and necrotic core are quite similar, indicating that the chemical contents of both morphologic structures are quite similar.
- FIG. 33 shows examples of Raman spectra taken from cholesterol crystals of different size in the necrotic core of atheromatous plaques. In total, cholesterol crystals in seven coronary artery samples were studied. The main spectral features of the cholesterol crystal spectra are at 1668 cm −1 (C═C stretch), 1443, 1328, and 1274 cm−1 (CH2 , CH3 bending), and 1176 and 1085 cm−1 (C—C stretch). The spectral features below 1000 cm−1 are attributed to steroids, indicating the presence of unesterified cholesterol. Slightly more variation was seen between the spectra from individual crystals, mainly due to band intensity variations, indicative of differences in the ratio of free to esterified cholesterol in the crystals themselves or in the tissue components surrounding the crystals.
- In necrotic core regions, yellow crystals could be identified under phase contrast occasionally. FIGS. 33 (d and e) shows the Raman spectra of two such crystals from two different coronary artery samples. In total, seven of these crystals from three samples were studied. The main spectral features are bands at 1523 and 1160 cm−1 which are due to C—C and C═C stretches and indicative of β-carotene. Given the presence of bands at 1449 and 956 cm−1, these yellow crystals also appear to contain some structural proteins and cholesterol esters.
- FIG. 34A is a photomicrograph of an atherosclerotic plaque containing a calcification. In total, 15 calcium mineralizations in six coronary artery samples were studied. Raman spectra representing different stages of calcification in two atherosclerotic plaques are shown in FIG. 34B. The main features of these spectra are 1071 and 959 cm −1 bands attributed to CO3 2− (symmetric)/PO4 3− (asymmetric) and PO4 3− (symmetric) stretches, indicative of calcium carbonate and calcium hydroxyapatite, respectively. Large calcium mineralizations (FIGS. 34B, a and b) show spectral features different from those of minute punctate calcium mineralizations in the necrotic core (FIGS. 34B, c). The main difference is the presence of additional features in the spectra of the punctate calcium mineralizations attributable to lipids and/or phospholipids (1433 cm−1), most likely due to the surrounding necrotic core.
- Using the basis spectra of pure chemicals as illustrated in FIG. 35, the spectra of the individual morphologic structures were fitted in the biochemical model. Each panel in FIGS. 36A-H shows a Raman spectrum of one of the morphologic structures, and the result of the least-squares minimization fit of the biochemical model. Residuals (data minus the fit) are shown on the same scale. Because the Raman spectra from foam cells and necrotic core were very similar, only the fit results of the foam cells are shown. Judging from the residuals of the fits to the observed spectra, which are on the order of magnitude of the noise and show no consistent pattern from spectrum to spectrum, the Raman spectrum of each morphologic structure (panels A-H) is well described using the 12 biochemical basis spectra.
- For each morphologic structure examined, the contribution of each biochemical component was determined. FIGS. 37A-H confirm that each morphologic structure has a characteristic biochemical composition. Generally, each morphologic structure is composed largely of one or two major biochemical components, combined with one or more less abundant biochemical components.
- The internal and external elastic laminae (FIG. 37A) are mainly composed of elastin with a smaller collagen component, whereas collagen fibers in both normal arteries and the fibrous cap of atherosclerotic lesions (FIG. 37B) are mainly composed of collagen with a small elastin component. Smooth muscle cells (FIG. 37C) were modeled almost entirely by actin and a small tropomyosin component. Myosin did not contribute at all.
- Adventitial fat cells (FIG. 37D) contain almost exclusively triglycerides (triolein) with a small contribution of phospholipids (phosphatidyl choline). In contrast, foam cells and necrotic core (FIG. 37E) contains mainly cholesterol esters (linoleate) and free cholesterol (monohydrate) at a ratio of about 2:1, with smaller contributions of collagen, phospholipids, and β-carotene. Foam cells appear similar in the current data and cannot be distinguished from necrotic core on the basis of their biochemical composition. However in a following assessment they can be distinguished. For example, the spectral feature at approximately 1750 cm −1 can be used to distinguish the foam cells from the necrotic core. Cholesterol crystals (FIG. 37F) contain free cholesterol and cholesterol ester at a ratio of about 3:1. The yellow crystals (FIG. 37G) consist almost entirely of β-carotene, with a small contribution of cholesterol. This may indicate that these crystals are in fact cholesterol crystals that contain high concentrations of β-carotene. Calcium mineralizations (FIG. 37H) are mainly composed of calcium hydroxypatite with small contributions of collagen, triglycerides, and calcium carbonate.
- The presence of foam cells and other inflammatory cells may also play a role in plaque instability. Therefore, morphologic factors, such as the presence of crystalline-free cholesterol or foam cells, may be as important as biochemical composition in determining atherosclerotic plaque stability and progression.
- As was shown in FIG. 36, the biochemical model of FIG. 35 describes the spectrum of each morphologic structure well, which means that the most essential biochemical components are included in the reference. The biochemical composition of each structure, indicated by the fit contributions of the biochemical basis spectra to the morphologic structure spectrum, is very consistent (FIGS. 36A-H). The largest biochemical variations were found in foam cells, necrotic core, cholesterol crystals, and calcium mineralizations. The biochemical variations in both calcium mineralizations, cholesterol crystals, and β-carotene-containing crystals may be due to differences in their stage of progression (as reflected by size). The cause of the biochemical variations within foam cells and necrotic core (differences in collagen, β-carotene, and cholesterol esters) is less clear. Variations in the lipid composition of atherosclerotic plaques at various stages of progression have been described previously in in-vitro studies of homogenized or extracted tissues and cultured monocyte-derived foam cells. However, these biochemical data are the results of analysis of atherosclerotic plaque components in-situ, without the confounding effects of tissue preparation or in-vitro cell culture models. More detailed in-situ Raman microspectroscopy studies of foam cells and necrotic cores in atherosclerotic plaques at various stages of disease progression may help to further elucidate the origin of this variation.
- Although the biochemical model did provide valuable information on the biochemical composition of the microscopic cellular and extracellular morphologic structures, it has its limitations. One of the major limitations of this model and/or reference was illustrated by the fits of the smooth muscle cell spectra. Previous in-vitro studies have shown that smooth muscle cells, which comprise the majority of the tunica media of muscular arteries such as the coronary artery, contain approximately three times more actin than myosin, but approximately equal amounts of myosin and tropomyosin. However, the fit contributions in the biochemical model indicated that smooth muscle cells contained almost exclusively actin, with a small amount of tropomyosin and virtually no myosin. These unexpected results may be due to conformational differences in spectroscopic characteristics of myosin between tissue-extracted myosin and intracellular myosin in-situ. In addition, as seen with the glycosaminoglycans, the contribution of weak Raman scatterers may be underestimated.
- Observed variations may also be due to contributions of biochemical compounds that are not included in the reference. For example, only one class of collagen was included. This should not be a great concern, as there is little difference observed in the Raman spectra of the different classes of collagens in-vitro. However, there may be significant changes in the Raman spectra of collagen in-vivo due to increased crosslinking as atherosclerotic lesions progress.
- Despite these limitations, the results of previous quantitative Raman spectroscopic biochemical analyses of normal and atherosclerotic arterial tissue, using the same biochemical model, compared well with standard analytical techniques. Previous studies have also shown that these quantitative Raman spectroscopy biochemical analyses could be used as the basis of a diagnostic algorithm that accurately classified arterial tissues as either nonatherosclerotic or calcified or noncalcified atherosclerotic plaque. The results of the preferred embodiments of the present invention indicate that a modification of the biochemical model can be used to perform a relative comparison of cellular and extra cellular morphologic components of normal and atherosclerotic arterial tissue. Furthermore, another preferred embodiment shows that these relative morphologic comparisons can be used as the basis for an algorithm that allows diagnosis of atherosclerosis in coronary arteries. This is the first step in developing a quantitative Raman spectroscopy morphologic analysis with the purpose to accurately classify normal arteries and atherosclerotic plaques ex vivo, and in the future to predict plaque stability and disease progression in-vivo.
- Using the biochemical model reference of the preferred embodiment, confocal Raman microspectroscopy is illustrated to be used to perform an in-situ biochemical analysis of individual microscopic morphologic structures (such as foam cells and necrotic core) in intact arterial tissues that cannot be isolated or purified using conventional analytical techniques. Furthermore, the various morphologic structures have characteristic Raman spectra, which, as expected, vary little from structure to structure or from artery to artery, and can be used as basis spectra in a morphologic reference to perform a relative comparison of the morphology of normal and atherosclerotic coronary arteries ex-vivo. This nondestructive technique may ultimately be used to assess plaque stability and disease progression in humans in-vivo, as well as to study atherogenesis in animal models and lipid metabolism in cell cultures in-vitro.
- The embodiments of the present invention interpret Raman spectra in terms of morphology. For example, the Raman spectra can be associated with a morphological structure, for example, a foam cell which can be associated with specific chemical compounds. Further, the number of spectra can be reduced, for example, from a large number of chemical spectra to only eight unique spectra associated with morphological structures thereby decreasing the error in the fit. The diagnostics that are available to identify and monitor vulnerable plaque using the optical fiber catheter system of the present invention include the use of chemical composition, information about the morphological structures, thickening of the intimal layer and the thinning of the overlying collagen layer. Preferred embodiments include the determination of the depth of collagen by measuring the percentage of collagen. Further, the presence of calcification is monitored and any edges are identified and located relative to the collagen as indicators of a potential rupture and blood clot. As discussed previously, the reduced fractional fit contributions of collagen fibers in non-calcified plaques is an indicator of unstable plaque.
- The claims should not be read as limited to the described order or elements unless stated to that effect. Therefore, all embodiments that come within the scope and spirit of the following claims and equivalents thereto are claimed as the invention.
Claims (34)
Priority Applications (10)
| Application Number | Priority Date | Filing Date | Title |
|---|---|---|---|
| US10/178,062 US7647092B2 (en) | 2002-04-05 | 2002-06-21 | Systems and methods for spectroscopy of biological tissue |
| US10/407,923 US20040073120A1 (en) | 2002-04-05 | 2003-04-04 | Systems and methods for spectroscopy of biological tissue |
| AU2003230799A AU2003230799A1 (en) | 2002-04-05 | 2003-04-04 | Systems and methods for spectroscopy of biological tissue |
| EP10183925A EP2327978A3 (en) | 2002-04-05 | 2003-04-04 | Systems and methods for spectroscopy of biological tissue |
| PCT/US2003/010307 WO2003087793A1 (en) | 2002-04-05 | 2003-04-04 | Systems and methods for spectroscopy of biological tissue |
| EP03723896A EP1495309A1 (en) | 2002-04-05 | 2003-04-04 | Systems and methods for spectroscopy of biological tissue |
| EP10184224A EP2325623A3 (en) | 2002-04-05 | 2003-04-04 | Systems and methods for spectroscopy of biological tissue |
| JP2003584690A JP4588324B2 (en) | 2002-04-05 | 2003-04-04 | Tissue measurement probe |
| JP2010136655A JP2010249835A (en) | 2002-04-05 | 2010-06-15 | System and method for spectroscopy of biological tissue |
| US15/388,640 US20170202462A1 (en) | 2002-04-05 | 2016-12-22 | Systems and methods for spectroscopy of biological tissue |
Applications Claiming Priority (2)
| Application Number | Priority Date | Filing Date | Title |
|---|---|---|---|
| US37019702P | 2002-04-05 | 2002-04-05 | |
| US10/178,062 US7647092B2 (en) | 2002-04-05 | 2002-06-21 | Systems and methods for spectroscopy of biological tissue |
Related Child Applications (1)
| Application Number | Title | Priority Date | Filing Date |
|---|---|---|---|
| US10/407,923 Continuation-In-Part US20040073120A1 (en) | 2002-04-05 | 2003-04-04 | Systems and methods for spectroscopy of biological tissue |
Publications (2)
| Publication Number | Publication Date |
|---|---|
| US20030191398A1 true US20030191398A1 (en) | 2003-10-09 |
| US7647092B2 US7647092B2 (en) | 2010-01-12 |
Family
ID=29250155
Family Applications (1)
| Application Number | Title | Priority Date | Filing Date |
|---|---|---|---|
| US10/178,062 Expired - Fee Related US7647092B2 (en) | 2002-04-05 | 2002-06-21 | Systems and methods for spectroscopy of biological tissue |
Country Status (3)
| Country | Link |
|---|---|
| US (1) | US7647092B2 (en) |
| EP (2) | EP2325623A3 (en) |
| WO (1) | WO2003087793A1 (en) |
Cited By (74)
| Publication number | Priority date | Publication date | Assignee | Title |
|---|---|---|---|---|
| US20040073102A1 (en) * | 2002-10-11 | 2004-04-15 | Tearney Guillermo J. | Phase discrimation for detection of vulnerable-plaque |
| US20040092830A1 (en) * | 2002-08-05 | 2004-05-13 | Scott Robert W. | Catheter and method for diagnosis and treatment of diseased vessels |
| US20040133094A1 (en) * | 2002-10-24 | 2004-07-08 | Christoph Becker | Method and data processing device to support diagnosis and/or therapy of a pathological change of a blood vessel |
| US20040249260A1 (en) * | 2003-03-10 | 2004-12-09 | Ge Wang | Systems and methods for bioluminescent computed tomographic reconstruction |
| US20050010130A1 (en) * | 2003-07-01 | 2005-01-13 | The Regents Of The University Of Michigan | Method and apparatus for diagnosing bone tissue conditions |
| US20050054934A1 (en) * | 2003-09-05 | 2005-03-10 | Simon Furnish | Optical catheter with dual-stage beam redirector |
| WO2005031291A1 (en) * | 2003-09-22 | 2005-04-07 | Wang-Long Zhou | Bifurcated fiber optic probe and system |
| US20050119587A1 (en) * | 2003-07-01 | 2005-06-02 | University Of Michigan | Method and apparatus for evaluating connective tissue conditions |
| US20050250091A1 (en) * | 2004-05-05 | 2005-11-10 | Chemlmage Corporation | Raman molecular imaging for detection of bladder cancer |
| US20050286048A1 (en) * | 2004-06-24 | 2005-12-29 | Olympus Corporation | Light scanning type confocal microscope |
| US20060024007A1 (en) * | 2004-07-27 | 2006-02-02 | Carlin Donald B | Device for tissue characterization |
| US20060036164A1 (en) * | 2001-06-19 | 2006-02-16 | The Trustees Of The University Of Pennsylvania | Optically guided system for precise placement of a medical catheter in a patient |
| US20060146322A1 (en) * | 2003-03-25 | 2006-07-06 | Riken | Raman probe and Raman spectrum measuring apparatus utilizing the same |
| US20060184037A1 (en) * | 2004-11-30 | 2006-08-17 | Can Ince | Pulsed lighting imaging systems and methods |
| US20060241364A1 (en) * | 2004-10-01 | 2006-10-26 | Academisch Medisch Centrum Of The University Van Amsterdam | System and method for imaging the reflectance of a substrate |
| US20060271154A1 (en) * | 2005-05-25 | 2006-11-30 | Prescient Medical, Inc. | Methods and systems for treating vulnerable plaque |
| US20060281068A1 (en) * | 2005-06-09 | 2006-12-14 | Chemimage Corp. | Cytological methods for detecting a disease condition such as malignancy by Raman spectroscopic imaging |
| WO2007014173A2 (en) * | 2005-07-22 | 2007-02-01 | Massachusetts Institute Of Technology | Intrinsic raman spectroscopy |
| WO2007014212A1 (en) | 2005-07-25 | 2007-02-01 | Massachusetts Institute Of Technology | Multi modal spectroscopy |
| US20070038123A1 (en) * | 2005-06-02 | 2007-02-15 | Newton Laboratories, Inc. | Optical probe for Raman scattering from arterial tissue |
| US20070038120A1 (en) * | 2005-07-05 | 2007-02-15 | The Board Of Regents Of The University Of Texas | Depth-Resolved Spectroscopy Method and Apparatus |
| US20070049808A1 (en) * | 2005-09-01 | 2007-03-01 | The Regents Of The University Of Michigan | Method and apparatus for evaluating connective tissue conditions |
| US20070078500A1 (en) * | 2005-09-30 | 2007-04-05 | Cornova, Inc. | Systems and methods for analysis and treatment of a body lumen |
| US20070093700A1 (en) * | 2005-05-31 | 2007-04-26 | Ge Wang | Computational optical biopsy |
| US20070127020A1 (en) * | 2005-11-10 | 2007-06-07 | Naoko Hikichi | Optical coupling system of light measuring device and sample |
| US20070136014A1 (en) * | 2005-12-08 | 2007-06-14 | Neiss Jason H | System and method for automated baseline correction for raman spectra |
| US20070167835A1 (en) * | 2005-07-25 | 2007-07-19 | Massachusetts Institute Of Technology | Tri modal spectroscopic imaging |
| US20070173736A1 (en) * | 2005-10-07 | 2007-07-26 | Femspec Llc | Apparatus and methods for endometrial biopsies |
| US7273056B2 (en) | 2001-06-19 | 2007-09-25 | The Trustees Of The University Of Pennsylvania | Optical guidance system for invasive catheter placement |
| US20070232874A1 (en) * | 2003-10-03 | 2007-10-04 | Can Ince | System and method for imaging the reflectance of a substrate |
| US20080039715A1 (en) * | 2004-11-04 | 2008-02-14 | Wilson David F | Three-dimensional optical guidance for catheter placement |
| US20090153852A1 (en) * | 2004-04-27 | 2009-06-18 | Koninklijke Philips Electronics, N.V. | Optical fiber for spectroscopic analysis system |
| US20090175576A1 (en) * | 2008-01-08 | 2009-07-09 | Cornova, Inc. | Shaped fiber ends and methods of making same |
| US20090187108A1 (en) * | 2006-09-29 | 2009-07-23 | Cornova, Inc. | Systems and methods for analysis and treatment of a body lumen |
| US20090219523A1 (en) * | 2005-09-16 | 2009-09-03 | The Regents Of The University Of Michigan | Method and System for Measuring Sub-Surface Composition of a Sample |
| US20100034743A1 (en) * | 2008-08-08 | 2010-02-11 | Chemlmage Corporation | Raman Characterization of Transplant Tissue |
| US20100033717A1 (en) * | 2008-08-08 | 2010-02-11 | Chemimage Corporation | Raman Chemical Imaging of Implantable Drug Delivery Devices |
| US7697576B2 (en) | 2004-05-05 | 2010-04-13 | Chem Image Corporation | Cytological analysis by raman spectroscopic imaging |
| US20100094109A1 (en) * | 2008-10-15 | 2010-04-15 | Cornova, Inc. | Systems and methods for analysis and treatment of an occluded body lumen |
| US20100174196A1 (en) * | 2007-06-21 | 2010-07-08 | Cornova, Inc. | Systems and methods for guiding the analysis and treatment of a body lumen |
| US20100249607A1 (en) * | 2008-09-26 | 2010-09-30 | Massachusetts Institute Of Technology | Quantitative spectroscopic imaging |
| WO2010111508A1 (en) * | 2009-03-25 | 2010-09-30 | Los Alamos National Security, Llc | Fiber optical assembly for fluorescence spectrometry |
| US20100261195A1 (en) * | 2009-03-25 | 2010-10-14 | Richard Rubenstein | Rapid antemortem detection of infectious agents |
| US20100286531A1 (en) * | 2005-09-30 | 2010-11-11 | Cornova, Inc. | Systems and methods for analysis and treatment of a body lumen |
| US20100302538A1 (en) * | 2009-05-28 | 2010-12-02 | Indatech | Spectroscopic probe and method for detecting an inhomogeneity |
| EP2294385A2 (en) * | 2008-06-06 | 2011-03-16 | Longevity Link, Inc. | Noninvasive measurement of carotenoids in biological tissue |
| US20110135244A1 (en) * | 2009-12-03 | 2011-06-09 | Marple Eric T | Filtered fiber optic probe |
| US8078261B2 (en) | 2005-09-13 | 2011-12-13 | Children's Medical Center Corporation | Light-guided transluminal catheter |
| US8432542B2 (en) | 2011-01-10 | 2013-04-30 | Eric T. Marple | Fiber optic probes utilizing GRIN lenses for spatially precise optical spectroscopy |
| WO2014007759A1 (en) * | 2012-07-02 | 2014-01-09 | National University Of Singapore | Methods related to real-time cancer diagnostics at endoscopy utilizing fiber-optic raman spectroscopy |
| WO2014021785A1 (en) * | 2012-08-02 | 2014-02-06 | Agency For Science, Technology And Research | Testing apparatuses, servers and methods for controlling a testing apparatus |
| WO2014027967A1 (en) * | 2012-08-16 | 2014-02-20 | National University Of Singapore | Diagnostic instrument and methods relating to raman spectroscopy |
| EP2708871A1 (en) * | 2011-05-10 | 2014-03-19 | Sumitomo Electric Industries, Ltd. | Optical tomography device |
| US8702321B2 (en) | 2009-12-03 | 2014-04-22 | Eric T. Marple | Filtered fiber optic probe |
| JP2014511746A (en) * | 2011-04-18 | 2014-05-19 | コーニンクレッカ フィリップス エヌ ヴェ | Classification of tumor tissue using personalized thresholds |
| US20140142391A1 (en) * | 2012-05-25 | 2014-05-22 | Olympus Medical Systems Corp. | Measurement probe |
| US8954134B2 (en) | 2005-09-13 | 2015-02-10 | Children's Medical Center Corporation | Light-guided transluminal catheter |
| US20150148629A1 (en) * | 2011-12-22 | 2015-05-28 | University Health Network | Biopsy Device with Integrated Optical Spectroscopy Guidance |
| US20150150458A1 (en) * | 2012-08-14 | 2015-06-04 | The Trustees Of Columbia University In The City Of New York | Imaging interfaces for full finger and full hand optical tomography |
| US20150253254A1 (en) * | 2012-09-21 | 2015-09-10 | Panasonic Corporation | Analysis apparatus |
| CN105358947A (en) * | 2013-02-14 | 2016-02-24 | 曾海山 | Integrated spectral probe for raman, reflectance and fluorescence spectral measurements |
| EP3054282A1 (en) * | 2015-02-06 | 2016-08-10 | Commissariat à l'Énergie Atomique et aux Énergies Alternatives | Method for characterising a sample by measuring a backscattered optical signal |
| US9867557B2 (en) | 2012-03-13 | 2018-01-16 | Konica Minolta, Inc. | Probe |
| WO2018195466A1 (en) * | 2017-04-20 | 2018-10-25 | Henry Ford Health System | System and method for characterization of a brain tissue sample using raman marker regions |
| WO2018213698A1 (en) * | 2017-05-18 | 2018-11-22 | Vanderbilt University | Method, system and speculum-free optical probe for optical assessment of cervix, and applications of same |
| WO2018217928A1 (en) * | 2017-05-26 | 2018-11-29 | Branson Ultrasonics Corporation | Dual channel feedback for ascertaining fiber bundle throughput |
| WO2019144237A1 (en) * | 2018-01-25 | 2019-08-01 | Provincial Health Services Authority | Endoscopic raman spectroscopy device |
| US10670530B2 (en) | 2016-12-19 | 2020-06-02 | Olympus Corporation | Raman probe and Raman spectrum measuring device |
| US10684226B2 (en) | 2018-03-09 | 2020-06-16 | Samsung Electronics Co., Ltd. | Raman probe, Raman spectrum obtaining apparatus, and method of obtaining Raman spectrum and detecting distribution of target material using Raman probe |
| US20210038304A1 (en) * | 2019-08-05 | 2021-02-11 | Gyrus Acmi, Inc. D/B/A Olympus Surgical Technologies America | Selective laser firing for tissue safety |
| US11064920B2 (en) | 2018-08-07 | 2021-07-20 | Biosense Webster (Israel) Ltd. | Brain clot characterization using optical signal analysis, and corresponding stent selection |
| CN113252636A (en) * | 2021-05-06 | 2021-08-13 | 河北大学 | Depth recognition Raman spectrum analysis system and analysis method |
| US11262309B2 (en) * | 2018-07-11 | 2022-03-01 | Advanced Cytometry Instrumentation Systems, Llc | Methods for lipid measurement in cells |
| CN114732371A (en) * | 2022-06-13 | 2022-07-12 | 南京诺源医疗器械有限公司 | Raman spectrum probe and Raman spectrum detection device |
Families Citing this family (66)
| Publication number | Priority date | Publication date | Assignee | Title |
|---|---|---|---|---|
| US6273884B1 (en) | 1997-05-15 | 2001-08-14 | Palomar Medical Technologies, Inc. | Method and apparatus for dermatology treatment |
| US6517532B1 (en) | 1997-05-15 | 2003-02-11 | Palomar Medical Technologies, Inc. | Light energy delivery head |
| US8182473B2 (en) | 1999-01-08 | 2012-05-22 | Palomar Medical Technologies | Cooling system for a photocosmetic device |
| EP1062001B1 (en) | 1998-03-12 | 2005-07-27 | Palomar Medical Technologies, Inc. | System for electromagnetic radiation of the skin |
| CA2433022C (en) * | 2000-12-28 | 2016-12-06 | Palomar Medical Technologies, Inc. | Method and apparatus for therapeutic emr treatment of the skin |
| EP1365699A2 (en) * | 2001-03-02 | 2003-12-03 | Palomar Medical Technologies, Inc. | Apparatus and method for photocosmetic and photodermatological treatment |
| US20040162596A1 (en) * | 2002-10-07 | 2004-08-19 | Palomar Medical Technologies, Inc. | Methods and apparatus for performing photobiostimulation |
| US20040073120A1 (en) * | 2002-04-05 | 2004-04-15 | Massachusetts Institute Of Technology | Systems and methods for spectroscopy of biological tissue |
| BR0312430A (en) | 2002-06-19 | 2005-04-26 | Palomar Medical Tech Inc | Method and apparatus for treating skin and subcutaneous conditions |
| US20070213792A1 (en) * | 2002-10-07 | 2007-09-13 | Palomar Medical Technologies, Inc. | Treatment Of Tissue Volume With Radiant Energy |
| CN1708261B (en) | 2002-10-23 | 2012-07-04 | 帕洛玛医疗技术公司 | Phototreatment device for use with coolants and topical substances |
| AU2003301111A1 (en) * | 2002-12-20 | 2004-07-22 | Palomar Medical Technologies, Inc. | Apparatus for light treatment of acne and other disorders of follicles |
| WO2004064627A1 (en) * | 2003-01-21 | 2004-08-05 | British Columbia Cancer Agency | In vivo raman endoscopic probe and methods of use |
| US20050165288A1 (en) * | 2004-01-27 | 2005-07-28 | Scimed Life Systems, Inc. | Systems and methods for treating breast tissue |
| US20080132886A1 (en) * | 2004-04-09 | 2008-06-05 | Palomar Medical Technologies, Inc. | Use of fractional emr technology on incisions and internal tissues |
| CA2561344A1 (en) * | 2004-04-09 | 2005-10-27 | Palomar Medical Technologies, Inc. | Methods and products for producing lattices of emr-treated islets in tissues, and uses therefor |
| AU2005292074A1 (en) * | 2004-09-29 | 2006-04-13 | Materials Research Services | IR spectrographic apparatus and method for diagnosis of disease |
| GB0426993D0 (en) | 2004-12-09 | 2005-01-12 | Council Cent Lab Res Councils | Apparatus for depth-selective raman spectroscopy |
| US7856985B2 (en) | 2005-04-22 | 2010-12-28 | Cynosure, Inc. | Method of treatment body tissue using a non-uniform laser beam |
| JP4675149B2 (en) * | 2005-05-13 | 2011-04-20 | 独立行政法人理化学研究所 | Spectroscopic probe for blood vessel diagnosis |
| JP4637643B2 (en) * | 2005-05-18 | 2011-02-23 | 日本分光株式会社 | Spectroscopic analyzer |
| US20120302892A1 (en) * | 2005-07-25 | 2012-11-29 | Niyom Lue | Portable optical fiber probe-based spectroscopic scanner for rapid cancer diagnosis |
| CN101282692A (en) * | 2005-08-08 | 2008-10-08 | 帕洛玛医疗技术公司 | Eye-safe photocosmetic device |
| CN101309631A (en) * | 2005-09-15 | 2008-11-19 | 帕洛玛医疗技术公司 | Skin optical characterization device |
| GB0606891D0 (en) | 2006-04-05 | 2006-05-17 | Council Cent Lab Res Councils | Raman Analysis Of Pharmaceutical Tablets |
| US7847941B2 (en) * | 2005-12-07 | 2010-12-07 | Los Alamos National Security, Llc | Fiber optical assembly for fluorescence spectrometry |
| US7586957B2 (en) | 2006-08-02 | 2009-09-08 | Cynosure, Inc | Picosecond laser apparatus and methods for its operation and use |
| WO2008074005A1 (en) * | 2006-12-13 | 2008-06-19 | Palomar Medical Technologies, Inc. | Cosmetic and biomedical applications of ultrasonic energy and methods of generation thereof |
| US7717624B2 (en) * | 2007-04-17 | 2010-05-18 | Medeikon Corporation | Connectors for multi fiber optical probes |
| WO2008153999A1 (en) * | 2007-06-08 | 2008-12-18 | Cynosure, Inc. | Thermal surgery safety apparatus and method |
| US8945511B2 (en) | 2009-06-25 | 2015-02-03 | Paul Weinberger | Sensitive methods for detecting the presence of cancer associated with the over-expression of galectin-3 using biomarkers derived from galectin-3 |
| US9919168B2 (en) | 2009-07-23 | 2018-03-20 | Palomar Medical Technologies, Inc. | Method for improvement of cellulite appearance |
| WO2011081887A1 (en) * | 2009-12-15 | 2011-07-07 | Los Alamos National Security, Llc | High throughput fiber optical assembly for fluorescence spectrometry |
| GB201005075D0 (en) * | 2010-03-25 | 2010-05-12 | Avalon Instr Ltd | Alignment methods and systems and devices using them |
| US9662047B2 (en) | 2010-08-05 | 2017-05-30 | Massachusetts Institute Of Technology | Portable raman diagnostic system |
| EP2653090A4 (en) | 2010-12-16 | 2016-11-16 | Konica Minolta Inc | Probe |
| WO2012087319A2 (en) * | 2010-12-22 | 2012-06-28 | Verifica-Bg Inc. | Method and apparatus for in vivo optical measurement of blood glucose concentration |
| US8942530B2 (en) | 2011-09-20 | 2015-01-27 | San Marino Capital, Inc. | Endoscope connector method and apparatus |
| EP2790580A4 (en) | 2011-12-14 | 2015-08-12 | Univ Pennsylvania | Fiber optic flow and oxygenation monitoring using diffuse correlation and reflectance |
| KR102183581B1 (en) | 2012-04-18 | 2020-11-27 | 싸이노슈어, 엘엘씨 | Picosecond laser apparatus and methods for treating target tissues with same |
| GB201301280D0 (en) | 2013-01-24 | 2013-03-06 | Univ St Andrews | Optical apparatus for use with a medical imager |
| JP6397431B2 (en) * | 2013-02-05 | 2018-09-26 | ラファル・パヴルチイクRafal PAWLUCZYK | Fiber optic probe for remote spectroscopy |
| EP2973894A2 (en) | 2013-03-15 | 2016-01-20 | Cynosure, Inc. | Picosecond optical radiation systems and methods of use |
| WO2014168734A1 (en) | 2013-03-15 | 2014-10-16 | Cedars-Sinai Medical Center | Time-resolved laser-induced fluorescence spectroscopy systems and uses thereof |
| WO2015104158A1 (en) | 2014-01-07 | 2015-07-16 | Opsolution Gmbh | Device and method for determining a concentration in a sample |
| US10206581B2 (en) | 2014-10-29 | 2019-02-19 | Zoll Medical Corporation | Transesophageal or transtracheal cardiac monitoring by optical spectroscopy |
| JP6336949B2 (en) | 2015-01-29 | 2018-06-06 | 富士フイルム株式会社 | Image processing apparatus, image processing method, and endoscope system |
| US10716499B1 (en) | 2015-03-24 | 2020-07-21 | Zoll Medical Corporation | Physiological monitoring by optical spectroscopy |
| US9924894B2 (en) | 2015-06-03 | 2018-03-27 | Hong Kong Applied Science And Technology Research Institute Co. Ltd. | Non-invasive measurement of skin thickness and glucose concentration with Raman spectroscopy and method of calibration thereof |
| US10656089B2 (en) | 2016-04-01 | 2020-05-19 | Black Light Surgical, Inc. | Systems, devices, and methods for time-resolved fluorescent spectroscopy |
| US10646111B2 (en) | 2016-09-23 | 2020-05-12 | Canon U.S.A., Inc. | Spectrally encoded endoscopy apparatus and methods |
| WO2018134980A1 (en) | 2017-01-20 | 2018-07-26 | オリンパス株式会社 | Cartilage tissue analysis device |
| GB201701355D0 (en) | 2017-01-27 | 2017-03-15 | Renishaw Plc | Direct laser writing and chemical etching |
| KR102258499B1 (en) * | 2017-03-13 | 2021-06-01 | 조에티스 서비시즈 엘엘씨 | Cross Flow Test System |
| US10876892B2 (en) | 2017-04-28 | 2020-12-29 | Biospex, Inc. | Measuring biological analytes using time-resolved spectroscopy |
| SG11202008151QA (en) | 2018-02-26 | 2020-09-29 | Cynosure Inc | Q-switched cavity dumped sub-nanosecond laser |
| US11446055B1 (en) | 2018-10-18 | 2022-09-20 | Lumoptik, Inc. | Light assisted needle placement system and method |
| WO2020115645A1 (en) | 2018-12-03 | 2020-06-11 | Istituti Clinici Scientifici Maugeri S.p.A. SB | Method for the characterisation of breast microcalcifications using a raman spectroscopy imaging technique in the diagnosis of breast cancer |
| US10760969B1 (en) | 2019-02-28 | 2020-09-01 | Biospex, Inc. | Fluorescence and systemic noise reduction in time-gated spectroscopy |
| EP3942996A4 (en) | 2019-03-22 | 2022-12-28 | Speclipse, Inc. | Diagnostic method using laser induced breakdown spectroscopy, and diagnostic device for performing same |
| US10881301B2 (en) * | 2019-05-07 | 2021-01-05 | Biospex, Inc. | Spatial optimization for measuring biological analytes |
| US11326944B2 (en) | 2019-07-12 | 2022-05-10 | Biospex, Inc. | Wearable spectrometer with filtered sensor |
| US11454540B2 (en) | 2019-07-12 | 2022-09-27 | Biospex, Inc. | Wearable spectroscopy using filtered sensor |
| JP2022545405A (en) * | 2019-08-16 | 2022-10-27 | バーソロミュー、ポール | Raman spectroscopy for mineral identification |
| JP2023534465A (en) * | 2020-07-14 | 2023-08-09 | マープル,エリック | Fiber optic probe with performance-enhancing components and features |
| US11460640B2 (en) * | 2021-02-24 | 2022-10-04 | Captain Jrt Llc | Fiber optic probe having components and features that improve performance |
Citations (18)
| Publication number | Priority date | Publication date | Assignee | Title |
|---|---|---|---|---|
| US4445892A (en) * | 1982-05-06 | 1984-05-01 | Laserscope, Inc. | Dual balloon catheter device |
| US4573761A (en) * | 1983-09-14 | 1986-03-04 | The Dow Chemical Company | Fiber-optic probe for sensitive Raman analysis |
| US5217454A (en) * | 1991-08-01 | 1993-06-08 | Angiolaz, Incorporated | Laser delivery catheter |
| US5293872A (en) * | 1991-04-03 | 1994-03-15 | Alfano Robert R | Method for distinguishing between calcified atherosclerotic tissue and fibrous atherosclerotic tissue or normal cardiovascular tissue using Raman spectroscopy |
| US5304173A (en) * | 1985-03-22 | 1994-04-19 | Massachusetts Institute Of Technology | Spectral diagonostic and treatment system |
| US5398670A (en) * | 1993-08-31 | 1995-03-21 | Ethicon, Inc. | Lumen traversing device |
| US5402508A (en) * | 1993-05-04 | 1995-03-28 | The United States Of America As Represented By The United States Department Of Energy | Fiber optic probe having fibers with endfaces formed for improved coupling efficiency and method using same |
| US5510894A (en) * | 1988-12-22 | 1996-04-23 | Renishaw Plc | Spectroscopic apparatus and methods |
| US5615673A (en) * | 1995-03-27 | 1997-04-01 | Massachusetts Institute Of Technology | Apparatus and methods of raman spectroscopy for analysis of blood gases and analytes |
| US5764840A (en) * | 1995-11-20 | 1998-06-09 | Visionex, Inc. | Optical fiber with enhanced light collection and illumination and having highly controlled emission and acceptance patterns |
| US5901261A (en) * | 1997-06-19 | 1999-05-04 | Visionex, Inc. | Fiber optic interface for optical probes with enhanced photonic efficiency, light manipulation, and stray light rejection |
| US5911017A (en) * | 1996-07-31 | 1999-06-08 | Visionex, Inc. | Fiber optic interface for laser spectroscopic Raman probes |
| US5917971A (en) * | 1996-08-26 | 1999-06-29 | Kaiser Optical Systems | Confocal data collection in a fiber optically coupled microscope |
| US5943128A (en) * | 1997-06-27 | 1999-08-24 | Kaiser Optical Systems | Grating-based optical probe |
| US20020072678A1 (en) * | 2000-10-31 | 2002-06-13 | Yuichi Komachi | Analysis system of matter adhered to inside wall of vessel |
| US6483581B1 (en) * | 1997-07-02 | 2002-11-19 | Spectra Code, Inc. | Raman system for rapid sample indentification |
| US6487349B2 (en) * | 1995-11-20 | 2002-11-26 | Cirrex Corp. | Method and apparatus for improved fiber optic light management |
| US20040073120A1 (en) * | 2002-04-05 | 2004-04-15 | Massachusetts Institute Of Technology | Systems and methods for spectroscopy of biological tissue |
Family Cites Families (27)
| Publication number | Priority date | Publication date | Assignee | Title |
|---|---|---|---|---|
| EP0230679B1 (en) | 1986-01-30 | 1990-08-08 | The Dow Chemical Company | Fiber-optic probe |
| JPS63277030A (en) * | 1987-05-09 | 1988-11-15 | Mitsubishi Cable Ind Ltd | Catheter-shaped fiberscope |
| EP0380586B1 (en) | 1987-09-24 | 1999-12-08 | Massachusetts Institute Of Technology | Catheter system for imaging |
| US5261410A (en) * | 1991-02-07 | 1993-11-16 | Alfano Robert R | Method for determining if a tissue is a malignant tumor tissue, a benign tumor tissue, or a normal or benign tissue using Raman spectroscopy |
| US5280788A (en) * | 1991-02-26 | 1994-01-25 | Massachusetts Institute Of Technology | Devices and methods for optical diagnosis of tissue |
| JPH06505183A (en) | 1991-02-26 | 1994-06-16 | マサチユセツツ・インスチチユート・オブ・テクノロジー | Molecular spectrometer system and method for diagnosing tissues |
| WO1993003672A1 (en) | 1991-08-20 | 1993-03-04 | Redd Douglas C B | Optical histochemical analysis, in vivo detection and real-time guidance for ablation of abnormal tissues using a raman spectroscopic detection system |
| US5354294A (en) * | 1993-05-26 | 1994-10-11 | Xintec Corporation | Combination reflectance fiber optic laser beam angle delivery |
| WO1995011624A2 (en) * | 1993-10-29 | 1995-05-04 | Feld Michael S | A raman endoscope |
| US5983125A (en) * | 1993-12-13 | 1999-11-09 | The Research Foundation Of City College Of New York | Method and apparatus for in vivo examination of subcutaneous tissues inside an organ of a body using optical spectroscopy |
| DE9414467U1 (en) * | 1994-07-15 | 1994-11-10 | Bruker Analytische Messtechnik | Raman spectrometer with a measuring probe |
| US5697373A (en) * | 1995-03-14 | 1997-12-16 | Board Of Regents, The University Of Texas System | Optical method and apparatus for the diagnosis of cervical precancers using raman and fluorescence spectroscopies |
| US6174424B1 (en) * | 1995-11-20 | 2001-01-16 | Cirrex Corp. | Couplers for optical fibers |
| US5862273A (en) * | 1996-02-23 | 1999-01-19 | Kaiser Optical Systems, Inc. | Fiber optic probe with integral optical filtering |
| EP0975995A1 (en) | 1996-06-19 | 2000-02-02 | Visionex, Inc. | Fiber optic interface for optical probes with enhanced photonic efficiency, light manipulation, and stray light rejection |
| US5842995A (en) * | 1996-06-28 | 1998-12-01 | Board Of Regents, The Univerisity Of Texas System | Spectroscopic probe for in vivo measurement of raman signals |
| CA2264870C (en) | 1996-08-02 | 2005-07-26 | Board Of Regents, The University Of Texas System | Apparatus for the characterization of tissue of epithelial lined viscus |
| US6038363A (en) | 1996-08-30 | 2000-03-14 | Kaiser Optical Systems | Fiber-optic spectroscopic probe with reduced background luminescence |
| US6278534B1 (en) | 1996-11-27 | 2001-08-21 | Kaiser Optical Systems | Dispersive optical device |
| US6006001A (en) * | 1996-12-02 | 1999-12-21 | The Research Foundation Of Cuny | Fiberoptic assembly useful in optical spectroscopy |
| US5974211A (en) | 1997-02-07 | 1999-10-26 | Kaiser Optical Systems | Enhanced collection efficiency fiber-optic probe |
| JPH10267846A (en) | 1997-03-27 | 1998-10-09 | Jeol Ltd | Laser emission/fetching optical apparatus |
| US6067156A (en) | 1997-05-16 | 2000-05-23 | Kaiser Optical Systems | Wavelength calibration and tracking methods and apparatus |
| US6141095A (en) | 1998-06-10 | 2000-10-31 | New Chromex, Inc. | Apparatus for measuring and applying instrumentation correction to produce a standard Raman spectrum |
| US6281971B1 (en) | 1999-05-18 | 2001-08-28 | New Chromex, Inc. | Method for adjusting spectral measurements to produce a standard Raman spectrum |
| US20010044129A1 (en) * | 2000-03-14 | 2001-11-22 | Jian Ling | Methodology of using raman imaging microscopy for evaluating drug action within living cells |
| US6701181B2 (en) * | 2001-05-31 | 2004-03-02 | Infraredx, Inc. | Multi-path optical catheter |
-
2002
- 2002-06-21 US US10/178,062 patent/US7647092B2/en not_active Expired - Fee Related
-
2003
- 2003-04-04 EP EP10184224A patent/EP2325623A3/en not_active Withdrawn
- 2003-04-04 WO PCT/US2003/010307 patent/WO2003087793A1/en active Application Filing
- 2003-04-04 EP EP10183925A patent/EP2327978A3/en not_active Withdrawn
Patent Citations (19)
| Publication number | Priority date | Publication date | Assignee | Title |
|---|---|---|---|---|
| US4445892A (en) * | 1982-05-06 | 1984-05-01 | Laserscope, Inc. | Dual balloon catheter device |
| US4573761A (en) * | 1983-09-14 | 1986-03-04 | The Dow Chemical Company | Fiber-optic probe for sensitive Raman analysis |
| US5304173A (en) * | 1985-03-22 | 1994-04-19 | Massachusetts Institute Of Technology | Spectral diagonostic and treatment system |
| US5510894A (en) * | 1988-12-22 | 1996-04-23 | Renishaw Plc | Spectroscopic apparatus and methods |
| US5293872A (en) * | 1991-04-03 | 1994-03-15 | Alfano Robert R | Method for distinguishing between calcified atherosclerotic tissue and fibrous atherosclerotic tissue or normal cardiovascular tissue using Raman spectroscopy |
| US5217454A (en) * | 1991-08-01 | 1993-06-08 | Angiolaz, Incorporated | Laser delivery catheter |
| US5402508A (en) * | 1993-05-04 | 1995-03-28 | The United States Of America As Represented By The United States Department Of Energy | Fiber optic probe having fibers with endfaces formed for improved coupling efficiency and method using same |
| US5398670A (en) * | 1993-08-31 | 1995-03-21 | Ethicon, Inc. | Lumen traversing device |
| US5615673A (en) * | 1995-03-27 | 1997-04-01 | Massachusetts Institute Of Technology | Apparatus and methods of raman spectroscopy for analysis of blood gases and analytes |
| US5764840A (en) * | 1995-11-20 | 1998-06-09 | Visionex, Inc. | Optical fiber with enhanced light collection and illumination and having highly controlled emission and acceptance patterns |
| US5878178A (en) * | 1995-11-20 | 1999-03-02 | Visionex Inc | Optical fiber with enhanced light collection and illumination and having highly controlled emission and acceptance patterns |
| US6487349B2 (en) * | 1995-11-20 | 2002-11-26 | Cirrex Corp. | Method and apparatus for improved fiber optic light management |
| US5911017A (en) * | 1996-07-31 | 1999-06-08 | Visionex, Inc. | Fiber optic interface for laser spectroscopic Raman probes |
| US5917971A (en) * | 1996-08-26 | 1999-06-29 | Kaiser Optical Systems | Confocal data collection in a fiber optically coupled microscope |
| US5901261A (en) * | 1997-06-19 | 1999-05-04 | Visionex, Inc. | Fiber optic interface for optical probes with enhanced photonic efficiency, light manipulation, and stray light rejection |
| US5943128A (en) * | 1997-06-27 | 1999-08-24 | Kaiser Optical Systems | Grating-based optical probe |
| US6483581B1 (en) * | 1997-07-02 | 2002-11-19 | Spectra Code, Inc. | Raman system for rapid sample indentification |
| US20020072678A1 (en) * | 2000-10-31 | 2002-06-13 | Yuichi Komachi | Analysis system of matter adhered to inside wall of vessel |
| US20040073120A1 (en) * | 2002-04-05 | 2004-04-15 | Massachusetts Institute Of Technology | Systems and methods for spectroscopy of biological tissue |
Cited By (128)
| Publication number | Priority date | Publication date | Assignee | Title |
|---|---|---|---|---|
| US20080027408A1 (en) * | 2001-06-19 | 2008-01-31 | The Trustees Of The University Of Pennsylvania | Method for catheter placement |
| US7757695B2 (en) | 2001-06-19 | 2010-07-20 | The Trustees Of The University Of Pennsylvania | Method for catheter placement |
| US7273056B2 (en) | 2001-06-19 | 2007-09-25 | The Trustees Of The University Of Pennsylvania | Optical guidance system for invasive catheter placement |
| US7992573B2 (en) | 2001-06-19 | 2011-08-09 | The Trustees Of The University Of Pennsylvania | Optically guided system for precise placement of a medical catheter in a patient |
| US20060036164A1 (en) * | 2001-06-19 | 2006-02-16 | The Trustees Of The University Of Pennsylvania | Optically guided system for precise placement of a medical catheter in a patient |
| US20040092830A1 (en) * | 2002-08-05 | 2004-05-13 | Scott Robert W. | Catheter and method for diagnosis and treatment of diseased vessels |
| US20040073102A1 (en) * | 2002-10-11 | 2004-04-15 | Tearney Guillermo J. | Phase discrimation for detection of vulnerable-plaque |
| US7313432B2 (en) * | 2002-10-11 | 2007-12-25 | Infraredx, Inc. | Phase discrimination for detection of vulnerable-plaque |
| US20040133094A1 (en) * | 2002-10-24 | 2004-07-08 | Christoph Becker | Method and data processing device to support diagnosis and/or therapy of a pathological change of a blood vessel |
| US7570983B2 (en) * | 2002-10-24 | 2009-08-04 | Siemens Aktiengesellschaft | Method and data processing device to support diagnosis and/or therapy of a pathological change of a blood vessel |
| US20040249260A1 (en) * | 2003-03-10 | 2004-12-09 | Ge Wang | Systems and methods for bioluminescent computed tomographic reconstruction |
| US8090431B2 (en) | 2003-03-10 | 2012-01-03 | University Of Iowa Research Foundation | Systems and methods for bioluminescent computed tomographic reconstruction |
| US7184142B2 (en) * | 2003-03-25 | 2007-02-27 | Riken | Raman probe and Raman spectrum measuring apparatus utilizing the same |
| US20060146322A1 (en) * | 2003-03-25 | 2006-07-06 | Riken | Raman probe and Raman spectrum measuring apparatus utilizing the same |
| US20050010130A1 (en) * | 2003-07-01 | 2005-01-13 | The Regents Of The University Of Michigan | Method and apparatus for diagnosing bone tissue conditions |
| US20050119587A1 (en) * | 2003-07-01 | 2005-06-02 | University Of Michigan | Method and apparatus for evaluating connective tissue conditions |
| US8417322B2 (en) * | 2003-07-01 | 2013-04-09 | Regents Of The University Of Michigan | Method and apparatus for diagnosing bone tissue conditions |
| US7742805B2 (en) * | 2003-09-05 | 2010-06-22 | Infraredx, Inc. | Optical catheter with dual-stage beam redirector |
| US20050054934A1 (en) * | 2003-09-05 | 2005-03-10 | Simon Furnish | Optical catheter with dual-stage beam redirector |
| WO2005031291A1 (en) * | 2003-09-22 | 2005-04-07 | Wang-Long Zhou | Bifurcated fiber optic probe and system |
| US8452384B2 (en) | 2003-10-03 | 2013-05-28 | MicroVision Medical Holdings B.V. | Systems and methods for sidesstream dark field imaging |
| US20070232874A1 (en) * | 2003-10-03 | 2007-10-04 | Can Ince | System and method for imaging the reflectance of a substrate |
| US8064976B2 (en) | 2003-10-03 | 2011-11-22 | Can Ince | Systems and methods for sidesstream dark field imaging |
| US20090153852A1 (en) * | 2004-04-27 | 2009-06-18 | Koninklijke Philips Electronics, N.V. | Optical fiber for spectroscopic analysis system |
| US20050250091A1 (en) * | 2004-05-05 | 2005-11-10 | Chemlmage Corporation | Raman molecular imaging for detection of bladder cancer |
| US8553732B2 (en) | 2004-05-05 | 2013-10-08 | Chemimage Corporation | Cytological analysis by raman spectroscopic imaging |
| US20100262378A1 (en) * | 2004-05-05 | 2010-10-14 | Chemlmage Corporation | Cytological Analysis by Raman Spectroscopic Imaging |
| US7697576B2 (en) | 2004-05-05 | 2010-04-13 | Chem Image Corporation | Cytological analysis by raman spectroscopic imaging |
| US20050286048A1 (en) * | 2004-06-24 | 2005-12-29 | Olympus Corporation | Light scanning type confocal microscope |
| US7365842B2 (en) * | 2004-06-24 | 2008-04-29 | Olympus Corporation | Light scanning type confocal microscope |
| US20060024007A1 (en) * | 2004-07-27 | 2006-02-02 | Carlin Donald B | Device for tissue characterization |
| US7242832B2 (en) * | 2004-07-27 | 2007-07-10 | Medeikon Corporation | Device for tissue characterization |
| US20060241364A1 (en) * | 2004-10-01 | 2006-10-26 | Academisch Medisch Centrum Of The University Van Amsterdam | System and method for imaging the reflectance of a substrate |
| US20080039715A1 (en) * | 2004-11-04 | 2008-02-14 | Wilson David F | Three-dimensional optical guidance for catheter placement |
| US9131861B2 (en) | 2004-11-30 | 2015-09-15 | Academisch Medisch Centrum | Pulsed lighting imaging systems and methods |
| US20060184037A1 (en) * | 2004-11-30 | 2006-08-17 | Can Ince | Pulsed lighting imaging systems and methods |
| US20060271154A1 (en) * | 2005-05-25 | 2006-11-30 | Prescient Medical, Inc. | Methods and systems for treating vulnerable plaque |
| US20070093700A1 (en) * | 2005-05-31 | 2007-04-26 | Ge Wang | Computational optical biopsy |
| US20070038123A1 (en) * | 2005-06-02 | 2007-02-15 | Newton Laboratories, Inc. | Optical probe for Raman scattering from arterial tissue |
| US20060281068A1 (en) * | 2005-06-09 | 2006-12-14 | Chemimage Corp. | Cytological methods for detecting a disease condition such as malignancy by Raman spectroscopic imaging |
| US20070038120A1 (en) * | 2005-07-05 | 2007-02-15 | The Board Of Regents Of The University Of Texas | Depth-Resolved Spectroscopy Method and Apparatus |
| US7499161B2 (en) | 2005-07-05 | 2009-03-03 | The Board Of Regents Of The University Of Texas System | Depth-resolved spectroscopy method and apparatus |
| WO2007006039A3 (en) * | 2005-07-05 | 2007-06-14 | Univ Texas | Depth-resolved spectroscopy method and apparatus |
| WO2007014173A3 (en) * | 2005-07-22 | 2007-06-21 | Massachusetts Inst Technology | Intrinsic raman spectroscopy |
| WO2007014173A2 (en) * | 2005-07-22 | 2007-02-01 | Massachusetts Institute Of Technology | Intrinsic raman spectroscopy |
| US9103793B2 (en) | 2005-07-22 | 2015-08-11 | Massachusetts Institute Of Technology | Intrinsic Raman spectroscopy |
| US20070049809A1 (en) * | 2005-07-22 | 2007-03-01 | Kate Bechtel | Intrinsic Raman spectroscopy |
| WO2007014212A1 (en) | 2005-07-25 | 2007-02-01 | Massachusetts Institute Of Technology | Multi modal spectroscopy |
| US20070167835A1 (en) * | 2005-07-25 | 2007-07-19 | Massachusetts Institute Of Technology | Tri modal spectroscopic imaging |
| US20070049808A1 (en) * | 2005-09-01 | 2007-03-01 | The Regents Of The University Of Michigan | Method and apparatus for evaluating connective tissue conditions |
| US20100234740A1 (en) * | 2005-09-01 | 2010-09-16 | The Regents Of The University Of Michigan | Method and Apparatus for Evaluating Ocular Tissue Conditions |
| US7729749B2 (en) | 2005-09-01 | 2010-06-01 | The Regents Of The University Of Michigan | Method and apparatus for evaluating connective tissue conditions |
| US8078261B2 (en) | 2005-09-13 | 2011-12-13 | Children's Medical Center Corporation | Light-guided transluminal catheter |
| US8954134B2 (en) | 2005-09-13 | 2015-02-10 | Children's Medical Center Corporation | Light-guided transluminal catheter |
| US20090219523A1 (en) * | 2005-09-16 | 2009-09-03 | The Regents Of The University Of Michigan | Method and System for Measuring Sub-Surface Composition of a Sample |
| US8054463B2 (en) | 2005-09-16 | 2011-11-08 | The Regents Of The University Of Michigan | Method and system for measuring sub-surface composition of a sample |
| WO2007041542A3 (en) * | 2005-09-30 | 2007-11-15 | Cornova Inc | Systems and methods for analysis and treatment of a body lumen |
| US20070078500A1 (en) * | 2005-09-30 | 2007-04-05 | Cornova, Inc. | Systems and methods for analysis and treatment of a body lumen |
| US20100286531A1 (en) * | 2005-09-30 | 2010-11-11 | Cornova, Inc. | Systems and methods for analysis and treatment of a body lumen |
| US20070173736A1 (en) * | 2005-10-07 | 2007-07-26 | Femspec Llc | Apparatus and methods for endometrial biopsies |
| US7405824B2 (en) * | 2005-11-10 | 2008-07-29 | Nippon Sheet Glass Company, Limited | Optical coupling system of light measuring device and sample |
| US20070127020A1 (en) * | 2005-11-10 | 2007-06-07 | Naoko Hikichi | Optical coupling system of light measuring device and sample |
| US20070136014A1 (en) * | 2005-12-08 | 2007-06-14 | Neiss Jason H | System and method for automated baseline correction for raman spectra |
| US7337066B2 (en) * | 2005-12-08 | 2008-02-26 | Chemimage, Corporation | System and method for automated baseline correction for Raman spectra |
| US20090187108A1 (en) * | 2006-09-29 | 2009-07-23 | Cornova, Inc. | Systems and methods for analysis and treatment of a body lumen |
| US20100174196A1 (en) * | 2007-06-21 | 2010-07-08 | Cornova, Inc. | Systems and methods for guiding the analysis and treatment of a body lumen |
| US20090175576A1 (en) * | 2008-01-08 | 2009-07-09 | Cornova, Inc. | Shaped fiber ends and methods of making same |
| US20090227993A1 (en) * | 2008-01-08 | 2009-09-10 | Cornova, Inc. | Shaped fiber ends and methods of making same |
| AU2009256144B2 (en) * | 2008-06-06 | 2014-06-26 | Longevity Link, Inc. | Noninvasive measurement of carotenoids in biological tissue |
| EP2294385A2 (en) * | 2008-06-06 | 2011-03-16 | Longevity Link, Inc. | Noninvasive measurement of carotenoids in biological tissue |
| EP2294385A4 (en) * | 2008-06-06 | 2013-04-03 | Longevity Link Inc | Noninvasive measurement of carotenoids in biological tissue |
| US8253936B2 (en) | 2008-08-08 | 2012-08-28 | Chemimage Corporation | Raman characterization of transplant tissue |
| US20100034743A1 (en) * | 2008-08-08 | 2010-02-11 | Chemlmage Corporation | Raman Characterization of Transplant Tissue |
| US8416405B2 (en) | 2008-08-08 | 2013-04-09 | Chemimage Corporation | Raman chemical imaging of implantable drug delivery devices |
| US20100033717A1 (en) * | 2008-08-08 | 2010-02-11 | Chemimage Corporation | Raman Chemical Imaging of Implantable Drug Delivery Devices |
| US20100249607A1 (en) * | 2008-09-26 | 2010-09-30 | Massachusetts Institute Of Technology | Quantitative spectroscopic imaging |
| US8260390B2 (en) | 2008-10-15 | 2012-09-04 | Angiolight, Inc. | Systems and methods for analysis and treatment of an occluded body lumen |
| US20100094109A1 (en) * | 2008-10-15 | 2010-04-15 | Cornova, Inc. | Systems and methods for analysis and treatment of an occluded body lumen |
| US9110024B2 (en) | 2009-03-25 | 2015-08-18 | Los Alamos National Security, Llc | Fiber optical asssembly for fluorescence spectrometry |
| US20100261195A1 (en) * | 2009-03-25 | 2010-10-14 | Richard Rubenstein | Rapid antemortem detection of infectious agents |
| WO2010111508A1 (en) * | 2009-03-25 | 2010-09-30 | Los Alamos National Security, Llc | Fiber optical assembly for fluorescence spectrometry |
| US20100302538A1 (en) * | 2009-05-28 | 2010-12-02 | Indatech | Spectroscopic probe and method for detecting an inhomogeneity |
| US8730467B2 (en) * | 2009-05-28 | 2014-05-20 | Indatech | Spectroscopic probe and method for detecting an inhomogeneity |
| US8175423B2 (en) | 2009-12-03 | 2012-05-08 | Marple Eric T | Filtered fiber optic probe |
| US8702321B2 (en) | 2009-12-03 | 2014-04-22 | Eric T. Marple | Filtered fiber optic probe |
| US20110135244A1 (en) * | 2009-12-03 | 2011-06-09 | Marple Eric T | Filtered fiber optic probe |
| US8432542B2 (en) | 2011-01-10 | 2013-04-30 | Eric T. Marple | Fiber optic probes utilizing GRIN lenses for spatially precise optical spectroscopy |
| JP2014511746A (en) * | 2011-04-18 | 2014-05-19 | コーニンクレッカ フィリップス エヌ ヴェ | Classification of tumor tissue using personalized thresholds |
| EP2708871A1 (en) * | 2011-05-10 | 2014-03-19 | Sumitomo Electric Industries, Ltd. | Optical tomography device |
| EP2708871A4 (en) * | 2011-05-10 | 2014-10-22 | Sumitomo Electric Industries | Optical tomography device |
| US9179842B2 (en) | 2011-05-10 | 2015-11-10 | Sumitomo Electric Industries, Ltd. | Optical tomography device |
| US9763744B2 (en) * | 2011-12-22 | 2017-09-19 | Trustees Of Dartmouth College | Biopsy device with integrated optical spectroscopy guidance |
| US20150148629A1 (en) * | 2011-12-22 | 2015-05-28 | University Health Network | Biopsy Device with Integrated Optical Spectroscopy Guidance |
| US9867557B2 (en) | 2012-03-13 | 2018-01-16 | Konica Minolta, Inc. | Probe |
| CN104219988A (en) * | 2012-05-25 | 2014-12-17 | 奥林巴斯医疗株式会社 | Measuring probe |
| US20140142391A1 (en) * | 2012-05-25 | 2014-05-22 | Olympus Medical Systems Corp. | Measurement probe |
| EP2870462A4 (en) * | 2012-07-02 | 2016-03-23 | Univ Singapore | Methods related to real-time cancer diagnostics at endoscopy utilizing fiber-optic raman spectroscopy |
| JP2015526135A (en) * | 2012-07-02 | 2015-09-10 | ナショナル ユニヴァーシティー オブ シンガポール | Methods related to real-time cancer diagnosis in endoscopy using fiber optic Raman spectroscopy |
| US9931039B2 (en) | 2012-07-02 | 2018-04-03 | National University Of Singapore | Methods related to real-time cancer diagnostics at endoscopy utilizing fiber-optic Raman spectroscopy |
| WO2014007759A1 (en) * | 2012-07-02 | 2014-01-09 | National University Of Singapore | Methods related to real-time cancer diagnostics at endoscopy utilizing fiber-optic raman spectroscopy |
| CN104541153A (en) * | 2012-07-02 | 2015-04-22 | 新加坡国立大学 | Methods related to real-time cancer diagnostics at endoscopy utilizing fiber-optic raman spectroscopy |
| WO2014021785A1 (en) * | 2012-08-02 | 2014-02-06 | Agency For Science, Technology And Research | Testing apparatuses, servers and methods for controlling a testing apparatus |
| US20150150458A1 (en) * | 2012-08-14 | 2015-06-04 | The Trustees Of Columbia University In The City Of New York | Imaging interfaces for full finger and full hand optical tomography |
| EP2885628A4 (en) * | 2012-08-16 | 2016-07-20 | Univ Singapore | Diagnostic instrument and methods relating to raman spectroscopy |
| WO2014027967A1 (en) * | 2012-08-16 | 2014-02-20 | National University Of Singapore | Diagnostic instrument and methods relating to raman spectroscopy |
| CN104603601A (en) * | 2012-08-16 | 2015-05-06 | 新加坡国立大学 | Diagnostic instrument and methods relating to raman spectroscopy |
| US9726614B2 (en) * | 2012-09-21 | 2017-08-08 | Panasonic Intellectual Property Management Co., Ltd. | Analysis apparatus |
| US20150253254A1 (en) * | 2012-09-21 | 2015-09-10 | Panasonic Corporation | Analysis apparatus |
| CN105358947A (en) * | 2013-02-14 | 2016-02-24 | 曾海山 | Integrated spectral probe for raman, reflectance and fluorescence spectral measurements |
| EP3054282A1 (en) * | 2015-02-06 | 2016-08-10 | Commissariat à l'Énergie Atomique et aux Énergies Alternatives | Method for characterising a sample by measuring a backscattered optical signal |
| FR3032342A1 (en) * | 2015-02-06 | 2016-08-12 | Commissariat Energie Atomique | METHOD FOR CHARACTERIZING A SAMPLE BY MEASURING A RETROFUL OPTICAL SIGNAL |
| US9931072B2 (en) | 2015-02-06 | 2018-04-03 | Commissariat A L'energie Atomique Et Aux Energies Alternatives | Method for characterizing a sample by measurement of a backscattered optical signal |
| US10670530B2 (en) | 2016-12-19 | 2020-06-02 | Olympus Corporation | Raman probe and Raman spectrum measuring device |
| US11375897B2 (en) | 2017-04-20 | 2022-07-05 | Henry Ford Health System | System and method for characterization of a brain tissue sample using Raman marker regions |
| WO2018195466A1 (en) * | 2017-04-20 | 2018-10-25 | Henry Ford Health System | System and method for characterization of a brain tissue sample using raman marker regions |
| US11666221B2 (en) | 2017-05-18 | 2023-06-06 | Vanderbilt University | Method, system and speculum-free optical probe for optical assessment of cervix, and applications of same |
| WO2018213698A1 (en) * | 2017-05-18 | 2018-11-22 | Vanderbilt University | Method, system and speculum-free optical probe for optical assessment of cervix, and applications of same |
| WO2018217928A1 (en) * | 2017-05-26 | 2018-11-29 | Branson Ultrasonics Corporation | Dual channel feedback for ascertaining fiber bundle throughput |
| WO2019144237A1 (en) * | 2018-01-25 | 2019-08-01 | Provincial Health Services Authority | Endoscopic raman spectroscopy device |
| US11660378B2 (en) | 2018-01-25 | 2023-05-30 | Provincial Health Services Authority | Endoscopic raman spectroscopy device |
| US10684226B2 (en) | 2018-03-09 | 2020-06-16 | Samsung Electronics Co., Ltd. | Raman probe, Raman spectrum obtaining apparatus, and method of obtaining Raman spectrum and detecting distribution of target material using Raman probe |
| US11262309B2 (en) * | 2018-07-11 | 2022-03-01 | Advanced Cytometry Instrumentation Systems, Llc | Methods for lipid measurement in cells |
| US11064920B2 (en) | 2018-08-07 | 2021-07-20 | Biosense Webster (Israel) Ltd. | Brain clot characterization using optical signal analysis, and corresponding stent selection |
| CN114502091A (en) * | 2019-08-05 | 2022-05-13 | 捷锐士阿希迈公司(以奥林巴斯美国外科技术名义) | Selective laser emission for tissue safety |
| US20210038304A1 (en) * | 2019-08-05 | 2021-02-11 | Gyrus Acmi, Inc. D/B/A Olympus Surgical Technologies America | Selective laser firing for tissue safety |
| CN113252636A (en) * | 2021-05-06 | 2021-08-13 | 河北大学 | Depth recognition Raman spectrum analysis system and analysis method |
| CN114732371A (en) * | 2022-06-13 | 2022-07-12 | 南京诺源医疗器械有限公司 | Raman spectrum probe and Raman spectrum detection device |
| WO2023241090A1 (en) * | 2022-06-13 | 2023-12-21 | 南京诺源医疗器械有限公司 | Raman spectroscopy probe and raman spectroscopy detection apparatus |
Also Published As
| Publication number | Publication date |
|---|---|
| WO2003087793A1 (en) | 2003-10-23 |
| EP2327978A3 (en) | 2012-06-13 |
| EP2325623A2 (en) | 2011-05-25 |
| EP2327978A2 (en) | 2011-06-01 |
| EP2325623A3 (en) | 2013-03-20 |
| US7647092B2 (en) | 2010-01-12 |
Similar Documents
| Publication | Publication Date | Title |
|---|---|---|
| US7647092B2 (en) | Systems and methods for spectroscopy of biological tissue | |
| US20170202462A1 (en) | Systems and methods for spectroscopy of biological tissue | |
| JP4588324B2 (en) | Tissue measurement probe | |
| CN100533127C (en) | Use of high wavenumber raman spectroscopy for measuring tissue | |
| Motz et al. | In vivo Raman spectral pathology of human atherosclerosis and vulnerable plaque | |
| US5615673A (en) | Apparatus and methods of raman spectroscopy for analysis of blood gases and analytes | |
| US6697665B1 (en) | Systems and methods of molecular spectroscopy to provide for the diagnosis of tissue | |
| Moreira et al. | Raman spectroscopy: A powerful technique for biochemical analysis and diagnosis | |
| US20020156380A1 (en) | Raman endoscope | |
| US20070167836A1 (en) | Multi modal spectroscopy | |
| Bodanese et al. | Differentiating normal and basal cell carcinoma human skin tissues in vitro using dispersive Raman spectroscopy: a comparison between principal components analysis and simplified biochemical models | |
| WO2016015052A1 (en) | Apparatus, devices and methods for in vivo imaging and diagnosis | |
| van de Poll et al. | Raman spectroscopy of atherosclerosis | |
| Vasquez et al. | Multimodal scanning microscope combining optical coherence tomography, Raman spectroscopy and fluorescence lifetime microscopy for mesoscale label-free imaging of tissue | |
| Krafft et al. | Near infrared Raman spectroscopy to study the composition of human brain tissue and tumors | |
| US20170049328A1 (en) | Raman and resonant raman detection of vulnerable plaque optical analyzer and imager | |
| Baraga | In situ chemical analysis of biological tissue--vibrational Raman spectroscopy of human atheroschlerosis | |
| Motz | Development of in vivo Raman spectroscopy of atherosclerosis | |
| Borisova et al. | Multispectral autofluorescence diagnosis of non-melanoma cutaneous tumors | |
| Brennan III et al. | Histochemical analysis of human coronary artery using near-infrared Raman spectroscopy | |
| Van de Poll et al. | Prospects of laser spectroscopy to detect vulnerable plaque | |
| Hewko et al. | Atherosclerosis diagnostic imaging by optical spectroscopy and optical coherence tomography | |
| Römer et al. | Raman spectroscopy of atherosclerosis: towards real-time in vivo histochemistry and pathology | |
| Chau | Development of an intracoronary Raman spectroscopy | |
| Buschman et al. | Human coronary atherosclerosis studied in vitro by catheter-based transluminal Raman spectroscopy |
Legal Events
| Date | Code | Title | Description |
|---|---|---|---|
| AS | Assignment |
Owner name: MASSACHUSETTS INSTITUTE OF TECHNOLOGY, MASSACHUSET Free format text: ASSIGNMENT OF ASSIGNORS INTEREST;ASSIGNORS:MOTZ, JASON T.;GALINDO, LUIS H.;HUNTER, MARTIN;AND OTHERS;REEL/FRAME:013293/0621 Effective date: 20020729 |
|
| AS | Assignment |
Owner name: NATIONAL INSTITUTES OF HEALTH (NIH), U.S. DEPT. OF Free format text: CONFIRMATORY LICENSE;ASSIGNOR:MASSACHUSETTS INSTITUTE OF TECHNOLOGY;REEL/FRAME:021493/0909 Effective date: 20020826 |
|
| STCF | Information on status: patent grant |
Free format text: PATENTED CASE |
|
| CC | Certificate of correction | ||
| AS | Assignment |
Owner name: NATIONAL INSTITUTES OF HEALTH (NIH), U.S. DEPT. OF Free format text: CONFIRMATORY LICENSE;ASSIGNOR:MASSACHUSETTS INSTITUTE OF TECHNOLOGY;REEL/FRAME:026240/0587 Effective date: 20110505 |
|
| CC | Certificate of correction | ||
| FPAY | Fee payment |
Year of fee payment: 4 |
|
| CC | Certificate of correction | ||
| FPAY | Fee payment |
Year of fee payment: 8 |
|
| FEPP | Fee payment procedure |
Free format text: MAINTENANCE FEE REMINDER MAILED (ORIGINAL EVENT CODE: REM.); ENTITY STATUS OF PATENT OWNER: LARGE ENTITY |
|
| LAPS | Lapse for failure to pay maintenance fees |
Free format text: PATENT EXPIRED FOR FAILURE TO PAY MAINTENANCE FEES (ORIGINAL EVENT CODE: EXP.); ENTITY STATUS OF PATENT OWNER: LARGE ENTITY |
|
| STCH | Information on status: patent discontinuation |
Free format text: PATENT EXPIRED DUE TO NONPAYMENT OF MAINTENANCE FEES UNDER 37 CFR 1.362 |
|
| FP | Lapsed due to failure to pay maintenance fee |
Effective date: 20220112 |