US4853636A - NMR imaging method - Google Patents
NMR imaging method Download PDFInfo
- Publication number
- US4853636A US4853636A US07/141,788 US14178888A US4853636A US 4853636 A US4853636 A US 4853636A US 14178888 A US14178888 A US 14178888A US 4853636 A US4853636 A US 4853636A
- Authority
- US
- United States
- Prior art keywords
- image
- magnetic field
- imaging method
- region
- along
- Prior art date
- Legal status (The legal status is an assumption and is not a legal conclusion. Google has not performed a legal analysis and makes no representation as to the accuracy of the status listed.)
- Expired - Fee Related
Links
Images


Classifications
-
- G—PHYSICS
- G01—MEASURING; TESTING
- G01R—MEASURING ELECTRIC VARIABLES; MEASURING MAGNETIC VARIABLES
- G01R33/00—Arrangements or instruments for measuring magnetic variables
- G01R33/20—Arrangements or instruments for measuring magnetic variables involving magnetic resonance
- G01R33/44—Arrangements or instruments for measuring magnetic variables involving magnetic resonance using nuclear magnetic resonance [NMR]
- G01R33/48—NMR imaging systems
- G01R33/483—NMR imaging systems with selection of signals or spectra from particular regions of the volume, e.g. in vivo spectroscopy
- G01R33/4833—NMR imaging systems with selection of signals or spectra from particular regions of the volume, e.g. in vivo spectroscopy using spatially selective excitation of the volume of interest, e.g. selecting non-orthogonal or inclined slices
Definitions
- the present invention relates generally to an imaging method and apparatus in which phenomenon of the nuclear magnetic resonance (hereinafter referred to as NMR in abbreviation) is made use of and more particularly to an imaging method and apparatus capable of moving a part or region of the image of an object under inspection in a phase encoding direction.
- NMR nuclear magnetic resonance
- X-ray computed tomography (CT) apparatus and ultrasonic imaging method and apparatus are extensively used as the means for inspecting or observing nondestructively internal structures of the head, abdominal region and others of the human body.
- CT computed tomography
- ultrasonic imaging method and apparatus are extensively used as the means for inspecting or observing nondestructively internal structures of the head, abdominal region and others of the human body.
- attempts of conducting the similar inspection-by making use of the NMR phenomenon have achieved success, and it has turned out that information or data which could not be obtained with the X-ray CT or ultrasonic imaging method and apparatus are made available.
- the inspecting apparatus operative based on the NMR phenomenon, it is required to separate and identify discriminatively the signals produced by the object under inspection in correspondence with individual parts of the object.
- a locally selective excitation imaging method according to which a specified region or part of the human body is selectively excited to allow only that part to be imaged.
- this locally selective excitation imaging the field of view to be imaged is required to be moved.
- a method of moving the field of view is disclosed, for example, in Japanese Patent Application Laid-Open No. 207045/1985 (JP-A-No. 60-207045).
- a phase modulation and a frequency modulation is performed on the NMR signal along two orthogonal axes, respectively, in a selectively excited plane, and the orientation of the two axes is selected in dependence on the position of the field of view to be imaged so that the center position of coil coincides with the axis for the frequency modulation independent of the position of the field of view to be imaged.
- This method is however disadvantageous in that the orientation of the image itself varies in dependence on the position of the field of view to be imaged, not to speak of high technical expenditure involved in changing the direction of the gradient magnetic field in accordance with the position of the field of view to be imaged.
- An object of the present invention is to provide an NMR imaging method and apparatus in which the orientation of the image can remain constant independent of the position of the field of view and in which the local imaging can be realized at low technical expenditure.
- Another object of the present invention is to provide an NMR imaging method and apparatus in which divided images produced due to arbitrary setting of the position of the field of view to be imaged can be automatically restored to a normal image.
- a still further object of the present invention is to provide an NMR imaging method and apparatus in which not only the position of the field of view but also the size thereof and thus the magnification factor can be set at respective desired values so that optimum image can be ensured constantly.
- an NMR imaging method and apparatus in which a whole tomographic image of concern is displayed on a display device, and a region of the image which is to be selected is designated, wherein the frequency of RF magnetic field, intensity of gradient field, the band of a filter, frequency of a reference signal for signal detection and the sampling rate are automatically calculated and set on the basis of the position and size of the region to be selected for the measurement.
- the region in which the NMR signal is generated can be limited to the region to be selected and made to coincide with the region to be imaged, whereby the local imaging can be accomplished.
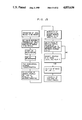
- FIG. 1 is a block diagram showing an arrangement of the NMR imaging method and apparatus according to an embodiment of the present invention
- FIGS. 2A to 2F are views showing time charts for illustrating, by way of example, a sequence of measurement process which can be carried out with the NMR imaging method and apparatus shown in FIG. 1;
- FIG. 3 is a schematic diagram for illustrating relation between a whole field of view and a local field of view to be selected therefrom;
- FIGS. 4A to 4F are views showing time charts for illustrating another sequence of measurements which can be carried out with the apparatus shown in FIG. 1;
- FIG. 5 is a view showing a schematic diagram for illustrating the effect due to change in the intensity of the static magnetic field
- FIG. 6 and FIGS. 7A and 7B are views showing schematic diagrams for illustrating division of an image and mutual exchange of image blocks resulting from the image division;
- FIGS. 8 to 11 are views showing schematic diagrams for illustrating procedures of exchanging the image blocks
- FIGS. 12 to 15 are views showing flow charts corresponding to FIGS. 8 to 11, respectively.
- FIGS. 16 and 17 are views showing flow charts for illustrating, respectively, operations of the NMR imaging method and apparatus according to embodiments of the invention.
- FIG. 1 shows schematically a general arrangement of an NMR imaging method and apparatus according to an exemplary embodiment of the present invention.
- a static magnetic field coil 14 is so arranged that upon energization thereof by a power supply source 15, the effective field area of view positioned internally of the coil 14 is placed under a static magnetic field of a predetermined direction (Z-direction) and a predetermined intensity (H o ).
- a gradient coil 8 of the Z-direction is constituted by a pair of coils through which electric currents flow in the opposite directions, respectively.
- a gradient makes appearance in the intensity distribution of the magnetic field along the Z-direction.
- the gradient field coils 9 and 10 are driven by respective gradient drivers 12 and 13, whereby the abovementioned intensity profile of the magnetic field exhibits gradients in the X- and Y-directions, respectively, with the origin of the X-, Y- and Z-coordinate system being located at the center of these coils.
- a human body 16 which is the object for inspection is disposed on a bed 17 which in turn is supported on a platform 18 so as to be movable thereon.
- the output of a high frequency or RF pulse generator 2 is amplified by a power amplifier 3 for exciting a RF coil 4, which serves also a reception coil for receiving nuclear magnetic resonance signals (NMR signal) as produced.
- the signal components received by the RF coil 4 undergo phase-sensitive detection by a detector 6 after having been amplified by an amplifier 5.
- a reference signal for this detection is derived from the pulse generator 2.
- the detected signal is then subjected to a band limitation by a band-pass filter 20 and subsequently sampled by an analogue-to-digital (A/D) converter 21 to be subsequently fetched by a computer 1, which is programmed to perform processings such as Fourier transformation, image reconstitution and others, whereby a signal intensity distribution on a section of the human body is transformed into an image which is then displayed on a display device 7.
- A/D analogue-to-digital
- the computer 1 is imparted with a function to output various control commands to different components at predetermined timing in response to manipulations on a console 22.
- a whole image of a section under to be inspected is displayed on the display device 7.
- values of the intensities of individual ingredient magnetic fields, the band pass width of the filter 20, the sampling frequency of the A/D converter 21 and the oscillation frequency of the RF generator 2 are arithmetically determined automatically by the computer 1, whereby the various components mentioned above are controlled in accordance with the relevant determined values.
- FIGS. 2A to 2F show a pulse sequence for realizing the local high-resolution imaging, in which FIG. 2A shows a RF magnetic field pulse train, FIG. 2B shows a Z-gradient magnetic field pulse train produced by the gradient field coil 8, FIG. 2C shows a Y-gradient magnetic field pulse train generated by the gradient coil 10, FIG. 2D shows a X-gradient magnetic field pulse train produced by the gradient coil 9, FIG. 2E shows period in which the sampling is performed by the A/D converter 21, and FIG. 2F shows an NMR signal to be sampled.
- a period t 1 90° -RF magnetic field pulse P 1 is applied under application of the Z-gradient magnetic field, whereby spins in a slice orthogonal to the Z-direction are selectively excited.
- the value of center angular frequency ⁇ z of the magnetic field pulse P 1 determines the position of a section to be imaged in the Z-direction.
- 180° -RF magnetic field pulse P 2 having a center angular frequency ⁇ y and an angular frequency band width ⁇ y is applied under the application of the Y-gradient magnetic field of the intensity G y , whereby direction only of the spins in a certain region in the Y-direction is inverted.
- the time span between the peaks of the pulses P 1 and P 2 is represented by ⁇ 1 .
- the Z-gradient magnetic field applied in a period t 3 is to compensate the phase dispersion due to the application of the gradient magnetic field in the period t 1 .
- Y- and X-gradient magnetic fields are applied.
- the former serves as the gradient magnetic field for encoding the positional information in the Y-direction in terms of the phase of spin (and referred to as phase encoding gradient magnetic field), while the latter serves as a dephasing magnetic field which cancels out the effect of the X-gradient magnetic field applied during a preceding half of a period t 7 for thereby causing echo to make appearance at a predetermined time point.
- a period t t6 the Y-gradient magnetic field is again applied for the purpose of cancelling the influence exerted on the phase encoded quantity due to transients of rise-up and fall of the magnetic field.
- 180° -RF magnetic field P 3 having a center angular frequency ⁇ x and an angular frequency band width ⁇ x is applied in addition to the X-gradient magnetic field of the intensity G x , whereby direction only of the spins in a certain region located along the X-direction are inverted.
- the spins occurring in a definite rectangular region of the predetermined slice or section can form echo signals having respective peaks at a time point distanced from the peak of the 180° -RF magnetic field pulse by a time span ⁇ 2 .
- the echo signals can be read out in a period t 7 by way of the detector 6 and the A/D converter 20 in the state in which a X-gradient magnetic field of intensity G READ (referred to as the reading-out gradient magnetic field) is applied.
- the process or sequence described above is repeated a plurality of times by changing intensity of the phase encoding gradient magnetic field by ⁇ G y in the periods t 4 and t 6 upon every repetition, as indicated by broken lines in FIG. 2C.
- the change ⁇ G p in the phase encode quantity is given by
- image of an entire field of view denoted by a reference numeral 31 in FIG. 3 is first displayed on the display device 7 and subsequently a local field of view 32 to be imaged with an increased resolution power is designated on the display screen.
- various parameters for the sequence illustrated in FIGS. 2A to 2F are automatically determined by the computer 1 so that the echo signals can be obtained only from the spins in the region corresponding to the local field of view 32. More specifically, parameters G x , G y , ⁇ x , ⁇ y , ⁇ x , ⁇ y and x, y, ⁇ x, ⁇ y are so determined that the following relations apply valid:
- ⁇ x and ⁇ y represent the widths of the field 32 to be locally imaged in the X- and Y-directions, respectively
- x and y represent the coordinates of the center of the field of view 32 with respect to the origin defined by the center of the entire field 31 (i.e. the center of the respective coils)
- H o represents the static field intensity
- ⁇ represents the ratio of magnetic rotation.
- the sequence illustrated in FIGS. 2A to 2F is executed on the basis of the parameters set as mentioned above, there are produced echo signal reflecting the signal components originating only in the spins within the region corresponding to the field of view 32.
- the selective excitation can be accomplished in which the range to be excited is limited to the region which corresponds to the field of view 32.
- the region to be selected in the X-direction can be limited by limiting the band pass width of the filter 20 shown in FIG. 1 instead of limitation effectuated by the RF pulse P 3 .
- the sequence for executing this limitation of the region to be selected in the X-direction is illustrated in FIGS. 4A to 4F. This sequence differs from that illustrated in FIGS.
- the sampling is performed under application of the gradient megnetic field G READ for reading out the spin echoes produced in response to the RF pulse P 2 and that the phase encoding Y-gradient magnetic field is applied in precedence to the application of the RF pulse P 2 for the purpose of reducing the time required for the imaging sequence.
- Setting of the center angular frequency ⁇ y of the RF pulse P 2 , the angular frequency band width ⁇ y and the Y-gradient magnetic field intensity G y is made in the utterly the same manner as described hereinbefore in conjunction with the expressions (3) and (5).
- the cut-off frequency ⁇ c of the filter 20 is set as follows on the assumption that the signal detection is performed based on the quadrature detection.
- the range in which image is to be reconstituted must be made to coincide with the field of view 32 shown in FIG. 3.
- the angular frequency ⁇ 1 of the reference signal for the detector 6 is selected to meet the following equation:
- the sampling period T in the sampling interval shown in FIGS. 2F or FIG. 4E is set as follows:
- the reading-out gradient field G READ is set to satisfy the following condition:
- the angular frequency of the reference signal can be set constant at ⁇ o while only the period for sampling the static field intensity is changed by ⁇ H o .
- This method will be elucidated by referring to FIG. 5.
- a gradient magnetic field of the intensity equal to that of the field G READ is applied, distribution of the field intensity along the X-direction is such as illustrated by a solid line l 1 in FIG. 5.
- NMR nuclear magnetic resonance
- distribution of the static field intensity in the X-direction is such as depicted by a single-dotted broken line l 2 .
- the position corresponding to the NMR angular frequency ⁇ o is moved by the distance x toward the position A.
- the center of the field of view can also be moved by the distance x by changing the static magnetic field intensity by ⁇ H o in accordance with the expression (10).
- the field of the view at an arbitrary position can be imaged by conducting the aforementioned selective excitation in the Y-direction by making use of the folding phenomenon, which will be elucidated by referring to FIG. 6. It is assumed that the region to be imaged which is determined by the value of change ⁇ G p of the phase encode quantity given by the expression (1) extends from B -1 to B 1 , as shown in FIG. 6.
- the image obtained through the two-dimensional Fourier transformation includes not only the spin distribution in the range from B -1 to B 1 but also the spin distribution in the range from B 1 to B 2 or from B 2 to B 3 folded over the spin distribution in the range from B -1 to B 1 , by way of example. Accordingly, when the range in which the spin signals are produced by the selective excitation is limited to the hatched region shown in FIG. 6, the image in this hatched region can be reconstituted through the two-dimensional Fourier transformation. In that case, however, the following relation must apply valid between the change ⁇ G p of the phase encoding quantity and the width ⁇ y of the selective excitation in the Y-direction. That is,
- the computer 1 determines those parameters ⁇ y , ⁇ y , G y , ⁇ x , ⁇ x and G x (or ⁇ y , ⁇ y , G y and cut-off angular frequency ⁇ c of the filter 20) which define the range to be selectively excited, and additionally determines those parameters ⁇ 1 (or ⁇ H o ), T (or G READ ) and ⁇ G p which define the region to be imaged.
- the turned-back image dividing line extends from B 3 to y-nB (n is an integer).
- FIG. 8 is a view for illustrating an exemplary one of the methods.
- a hatched area represents an image of a desired body portion produced in the set field of view, from which it will be seen that the image is divided into parts I and J'.
- a density profile on a given line L 1 of the direction (X-direction) perpendicular to the encoding direction is determined. Unless the density profile is at noise level and flat, the density profile on other lines are determined repeatedly. When the density profile on a line L 3 is found to be at noise level and flat, this line L 3 is used as the division line L shown in FIG. 7A.
- FIG. 9 illustrates another method of determining the image dividing line.
- the density profile on a given line M of the direction (Y-direction) parallel to the encoding direction is determined to detect regions L S -L E of noise level.
- density profile is determined on and along a line L 1 extending between the regions L S -L E perpendicularly to the encoding direction.
- the density profile on other lines is determined as with the case illustrated in FIG. 8.
- this line is selected as the dividing line L shown in FIG. 7A.
- FIG. 10 shows still another exemplary method of determining the image dividing line.
- the density profile is determined on and along a line M of the direction (Y-direction) parallel to the encoding direction.
- a mid-point E o of the region where the density profile is at noise level is determined, wherein the line L passing the mid-point E o in the direction (X-direction) perpendicular to the encoding direction is selected as the dividing line.
- FIG. 11 shows still another method of determining the image dividing line.
- an average density of a predetermined region occupying a give position in the image is first determined. Unless the average density value is at noise level as in the case of the region N 2 , the average density value is determined for another region. This procedure is repeated. When a region is detected in which the average density value is at noise level as represented by a region N 1 is found, a given line L passing the region N 1 in the direction perpendicularly to the encoding direction is selected as the dividing line.
- FIG. 12 shows a flow chart for illustrating the procedure described above in conjunction with FIG. 8.
- FIG. 13 illustrates in a flow chart the procedure described above by reference to FIG. 9.
- FIG. 14 illustrates in a flow chart the procedure described by reference to FIG. 10.
- FIG. 15 is a flow chart for illustrating the procedure described by reference to FIG. 11.
- FIG. 16 shows a flow chart for illustrating the whole sequence of operations according to an embodiment of the present invention, in which the measurement sequence described hereinbefore in conjunction with FIGS. 2A to 2F is adopted.
- FIG. 17 illustrates in a flow chart the procedure in which the sequence of measurement described hereinbefore by reference to FIGS. 4A to 4F is adopted. In either of these procedures, the operation for exchanging the image positions at the final step can be realized in accordance with any one of the methods shown in FIGS. 12, 13, 14 and 15.
Abstract
Description
ΔG.sub.p≈ΔG.sub.y ·(τ.sub.y1 -τ.sub.y2) (1)
G.sub.x =Δω.sub.x /γΔx (2)
G.sub.y =Δω.sub.y /γΔ.sub.y (3)
ω.sub.x =-γ(H.sub.o +G.sub.x ·x) (4)
ω.sub.y =-γ(H.sub.o +G.sub.y ·y) (5)
ω.sub.c =2γ·G.sub.READ ·Δx (6)
ω.sub.1 =γ(H.sub.o +G.sub.READ ·x) (7)
T=2π/γ·G.sub.READ ·Δx (8)
G.sub.READ =2π/γ·T·Δx (9)
ΔH.sub.o =-G.sub.READ ·x (10)
ΔG.sub.p =2π/γ·ΔY (11)
Claims (6)
Applications Claiming Priority (4)
| Application Number | Priority Date | Filing Date | Title |
|---|---|---|---|
| JP62003183A JPH0747024B2 (en) | 1987-01-12 | 1987-01-12 | Inspection device using nuclear magnetic resonance |
| JP62-3183 | 1987-01-12 | ||
| JP62-22313 | 1987-02-04 | ||
| JP62022313A JPS63192430A (en) | 1987-02-04 | 1987-02-04 | Examination apparatus using nuclear magnetic resonance |
Publications (1)
| Publication Number | Publication Date |
|---|---|
| US4853636A true US4853636A (en) | 1989-08-01 |
Family
ID=26336704
Family Applications (1)
| Application Number | Title | Priority Date | Filing Date |
|---|---|---|---|
| US07/141,788 Expired - Fee Related US4853636A (en) | 1987-01-12 | 1988-01-11 | NMR imaging method |
Country Status (1)
| Country | Link |
|---|---|
| US (1) | US4853636A (en) |
Cited By (5)
| Publication number | Priority date | Publication date | Assignee | Title |
|---|---|---|---|---|
| US4962763A (en) * | 1987-06-22 | 1990-10-16 | Hitachi, Ltd. | Magnetic resonance image synthesizing system |
| US5003264A (en) * | 1989-03-17 | 1991-03-26 | Hitachi, Ltd. | MR imaging method and apparatus |
| US7268553B1 (en) * | 1997-11-26 | 2007-09-11 | Fonar Corporation | Method and apparatus for magnetic resonance imaging |
| EP2317333A1 (en) * | 2009-10-30 | 2011-05-04 | Max-Delbrück-Centrum für Molekulare Medizin (MDC) | MRT operating procedure |
| US20210325493A1 (en) * | 2020-04-17 | 2021-10-21 | Siemens Healthcare Gmbh | Magnet system for a magnetic resonance imaging system |
Citations (3)
| Publication number | Priority date | Publication date | Assignee | Title |
|---|---|---|---|---|
| US4599565A (en) * | 1981-12-15 | 1986-07-08 | The Regents Of The University Of Calif. | Method and apparatus for rapid NMR imaging using multi-dimensional reconstruction techniques |
| US4607222A (en) * | 1983-02-10 | 1986-08-19 | Hitachi, Ltd. | Imaging region-of-interest in medical NMR observation |
| US4644278A (en) * | 1984-01-27 | 1987-02-17 | Hitachi, Ltd. | Nuclear magnetic resonance imaging apparatus |
-
1988
- 1988-01-11 US US07/141,788 patent/US4853636A/en not_active Expired - Fee Related
Patent Citations (3)
| Publication number | Priority date | Publication date | Assignee | Title |
|---|---|---|---|---|
| US4599565A (en) * | 1981-12-15 | 1986-07-08 | The Regents Of The University Of Calif. | Method and apparatus for rapid NMR imaging using multi-dimensional reconstruction techniques |
| US4607222A (en) * | 1983-02-10 | 1986-08-19 | Hitachi, Ltd. | Imaging region-of-interest in medical NMR observation |
| US4644278A (en) * | 1984-01-27 | 1987-02-17 | Hitachi, Ltd. | Nuclear magnetic resonance imaging apparatus |
Cited By (6)
| Publication number | Priority date | Publication date | Assignee | Title |
|---|---|---|---|---|
| US4962763A (en) * | 1987-06-22 | 1990-10-16 | Hitachi, Ltd. | Magnetic resonance image synthesizing system |
| US5003264A (en) * | 1989-03-17 | 1991-03-26 | Hitachi, Ltd. | MR imaging method and apparatus |
| US7268553B1 (en) * | 1997-11-26 | 2007-09-11 | Fonar Corporation | Method and apparatus for magnetic resonance imaging |
| EP2317333A1 (en) * | 2009-10-30 | 2011-05-04 | Max-Delbrück-Centrum für Molekulare Medizin (MDC) | MRT operating procedure |
| US20210325493A1 (en) * | 2020-04-17 | 2021-10-21 | Siemens Healthcare Gmbh | Magnet system for a magnetic resonance imaging system |
| US11768263B2 (en) * | 2020-04-17 | 2023-09-26 | Siemens Healthcare Gmbh | Magnet system for a magnetic resonance imaging system |
Similar Documents
| Publication | Publication Date | Title |
|---|---|---|
| US7486076B2 (en) | Magnetic resonance imaging apparatus and method with adjustment in positioning within imaging space to correct deviation from desired position | |
| EP0042254B2 (en) | Nuclear resonance apparatus including means for rotating the gradient of a magnetic field | |
| EP0390086B1 (en) | Magnetic resonance imaging method. | |
| US5003264A (en) | MR imaging method and apparatus | |
| US5241271A (en) | Ultra-fast imaging method and apparatus | |
| JPH06169896A (en) | Magnetic resonance imaging system | |
| US4703271A (en) | NMR tomographic apparatus | |
| US4853636A (en) | NMR imaging method | |
| JP3728346B2 (en) | Image data acquisition device and nuclear spin tomography device in nuclear spin tomography device | |
| JP2805405B2 (en) | Magnetic resonance imaging equipment | |
| JPH03176031A (en) | Method and device for magnetic resonance tomographing | |
| JPH0365971B2 (en) | ||
| US4786871A (en) | NMR imaging method and apparatus | |
| JP3588690B2 (en) | Magnetic resonance equipment | |
| EP0265955B1 (en) | Nuclear magnetic resonance imaging method | |
| JPH0622934A (en) | Magnetic resonance imaging device and method | |
| EP0153703A2 (en) | NMR imaging apparatus | |
| US20220187403A1 (en) | Magnetic resonance imaging apparatus and method of controlling the same | |
| JP2703888B2 (en) | Magnetic resonance imaging equipment | |
| JPS63122440A (en) | Magnetic resonance imaging apparatus | |
| JP3499927B2 (en) | Magnetic resonance imaging system | |
| JP2000237163A (en) | Magnetic resonance imaging device | |
| JP4400957B2 (en) | Magnetic resonance imaging system | |
| JPH0430830A (en) | Magnetic resonance imaging apparatus | |
| JPH0245037A (en) | Method for magnetic resonance imaging |
Legal Events
| Date | Code | Title | Description |
|---|---|---|---|
| AS | Assignment |
Owner name: HITACHI, LTD., 6, KANDA SURUGADAI 4-CHOME, CHIYODA Free format text: ASSIGNMENT OF ASSIGNORS INTEREST.;ASSIGNORS:YAMAMOTO, ETSUJI;OGURA, YUKIKO;KOHNO, HIDEKI;REEL/FRAME:004823/0215 Effective date: 19871221 Owner name: HITACHI, LTD., A CORP. OF JAPAN,JAPAN Free format text: ASSIGNMENT OF ASSIGNORS INTEREST;ASSIGNORS:YAMAMOTO, ETSUJI;OGURA, YUKIKO;KOHNO, HIDEKI;REEL/FRAME:004823/0215 Effective date: 19871221 |
|
| FPAY | Fee payment |
Year of fee payment: 4 |
|
| AS | Assignment |
Owner name: HITACHI MEDICAL CORPORATION, JAPAN Free format text: ASSIGNMENT OF ASSIGNORS INTEREST;ASSIGNOR:HITACHI, LTD.;REEL/FRAME:006867/0502 Effective date: 19940125 |
|
| FEPP | Fee payment procedure |
Free format text: PAYOR NUMBER ASSIGNED (ORIGINAL EVENT CODE: ASPN); ENTITY STATUS OF PATENT OWNER: LARGE ENTITY |
|
| FPAY | Fee payment |
Year of fee payment: 8 |
|
| REMI | Maintenance fee reminder mailed | ||
| LAPS | Lapse for failure to pay maintenance fees | ||
| FP | Lapsed due to failure to pay maintenance fee |
Effective date: 20010801 |
|
| STCH | Information on status: patent discontinuation |
Free format text: PATENT EXPIRED DUE TO NONPAYMENT OF MAINTENANCE FEES UNDER 37 CFR 1.362 |