US5995644A - Robust and automatic adjustment of display window width and center for MR images - Google Patents
Robust and automatic adjustment of display window width and center for MR images Download PDFInfo
- Publication number
- US5995644A US5995644A US08/885,080 US88508097A US5995644A US 5995644 A US5995644 A US 5995644A US 88508097 A US88508097 A US 88508097A US 5995644 A US5995644 A US 5995644A
- Authority
- US
- United States
- Prior art keywords
- images
- center
- histogram
- window width
- display window
- Prior art date
- Legal status (The legal status is an assumption and is not a legal conclusion. Google has not performed a legal analysis and makes no representation as to the accuracy of the status listed.)
- Expired - Lifetime
Links
- 238000013528 artificial neural network Methods 0.000 claims abstract description 62
- 239000013598 vector Substances 0.000 claims abstract description 48
- 230000002860 competitive effect Effects 0.000 claims abstract description 15
- 230000004927 fusion Effects 0.000 claims abstract description 15
- 238000012549 training Methods 0.000 claims description 62
- 238000000034 method Methods 0.000 claims description 41
- 238000009826 distribution Methods 0.000 claims description 13
- 230000006835 compression Effects 0.000 claims 1
- 238000007906 compression Methods 0.000 claims 1
- 238000005070 sampling Methods 0.000 claims 1
- 230000006870 function Effects 0.000 description 35
- 238000012360 testing method Methods 0.000 description 17
- 238000000354 decomposition reaction Methods 0.000 description 12
- 238000000513 principal component analysis Methods 0.000 description 7
- 230000008569 process Effects 0.000 description 6
- 230000007613 environmental effect Effects 0.000 description 5
- 239000011159 matrix material Substances 0.000 description 5
- 230000003466 anti-cipated effect Effects 0.000 description 4
- 230000002902 bimodal effect Effects 0.000 description 4
- 238000004422 calculation algorithm Methods 0.000 description 4
- 238000002474 experimental method Methods 0.000 description 4
- 239000000203 mixture Substances 0.000 description 4
- 238000012935 Averaging Methods 0.000 description 3
- 230000006978 adaptation Effects 0.000 description 3
- 230000001419 dependent effect Effects 0.000 description 3
- 230000003044 adaptive effect Effects 0.000 description 2
- 210000003484 anatomy Anatomy 0.000 description 2
- 230000008901 benefit Effects 0.000 description 2
- 238000004364 calculation method Methods 0.000 description 2
- 238000011161 development Methods 0.000 description 2
- 230000018109 developmental process Effects 0.000 description 2
- 238000010586 diagram Methods 0.000 description 2
- 238000000605 extraction Methods 0.000 description 2
- 238000013507 mapping Methods 0.000 description 2
- 238000001208 nuclear magnetic resonance pulse sequence Methods 0.000 description 2
- 238000012545 processing Methods 0.000 description 2
- 230000004044 response Effects 0.000 description 2
- 230000004075 alteration Effects 0.000 description 1
- 230000015556 catabolic process Effects 0.000 description 1
- 230000001010 compromised effect Effects 0.000 description 1
- 238000010276 construction Methods 0.000 description 1
- 238000013144 data compression Methods 0.000 description 1
- 230000007423 decrease Effects 0.000 description 1
- 238000006731 degradation reaction Methods 0.000 description 1
- 238000001914 filtration Methods 0.000 description 1
- 238000009499 grossing Methods 0.000 description 1
- 238000003384 imaging method Methods 0.000 description 1
- 238000002075 inversion recovery Methods 0.000 description 1
- 238000012986 modification Methods 0.000 description 1
- 230000004048 modification Effects 0.000 description 1
- 210000000056 organ Anatomy 0.000 description 1
- 238000007619 statistical method Methods 0.000 description 1
- 235000019640 taste Nutrition 0.000 description 1
- 230000009466 transformation Effects 0.000 description 1
- 238000013519 translation Methods 0.000 description 1
- 230000014616 translation Effects 0.000 description 1
Images


Classifications
-
- G06T5/90—
-
- G—PHYSICS
- G06—COMPUTING; CALCULATING OR COUNTING
- G06T—IMAGE DATA PROCESSING OR GENERATION, IN GENERAL
- G06T5/00—Image enhancement or restoration
- G06T5/40—Image enhancement or restoration by the use of histogram techniques
-
- G—PHYSICS
- G06—COMPUTING; CALCULATING OR COUNTING
- G06T—IMAGE DATA PROCESSING OR GENERATION, IN GENERAL
- G06T5/00—Image enhancement or restoration
- G06T5/50—Image enhancement or restoration by the use of more than one image, e.g. averaging, subtraction
-
- G06T5/60—
-
- G—PHYSICS
- G06—COMPUTING; CALCULATING OR COUNTING
- G06V—IMAGE OR VIDEO RECOGNITION OR UNDERSTANDING
- G06V10/00—Arrangements for image or video recognition or understanding
- G06V10/20—Image preprocessing
- G06V10/25—Determination of region of interest [ROI] or a volume of interest [VOI]
-
- G—PHYSICS
- G06—COMPUTING; CALCULATING OR COUNTING
- G06T—IMAGE DATA PROCESSING OR GENERATION, IN GENERAL
- G06T2207/00—Indexing scheme for image analysis or image enhancement
- G06T2207/10—Image acquisition modality
- G06T2207/10072—Tomographic images
- G06T2207/10088—Magnetic resonance imaging [MRI]
-
- G—PHYSICS
- G06—COMPUTING; CALCULATING OR COUNTING
- G06T—IMAGE DATA PROCESSING OR GENERATION, IN GENERAL
- G06T2207/00—Indexing scheme for image analysis or image enhancement
- G06T2207/20—Special algorithmic details
- G06T2207/20048—Transform domain processing
- G06T2207/20064—Wavelet transform [DWT]
-
- G—PHYSICS
- G06—COMPUTING; CALCULATING OR COUNTING
- G06T—IMAGE DATA PROCESSING OR GENERATION, IN GENERAL
- G06T2207/00—Indexing scheme for image analysis or image enhancement
- G06T2207/20—Special algorithmic details
- G06T2207/20084—Artificial neural networks [ANN]
-
- G—PHYSICS
- G06—COMPUTING; CALCULATING OR COUNTING
- G06T—IMAGE DATA PROCESSING OR GENERATION, IN GENERAL
- G06T2207/00—Indexing scheme for image analysis or image enhancement
- G06T2207/20—Special algorithmic details
- G06T2207/20212—Image combination
- G06T2207/20221—Image fusion; Image merging
Definitions
- the present invention relates to displaying magnetic resonance images and more particularly to linearly re-mapping the image intensity range of magnetic resonance images.
- Magnetic Resonance (MR) images have typically a data depth of 12 bits.
- the image intensity range of the MR image needs to be re-mapped in general.
- One of the common prior art re-mapping processes is the so-called windowing process. It maps the image intensity values linearly from [(center--width)/2, (center+width)/2] to [0, 255], where center and width are two display parameters to be adjusted.
- the image intensity values below [(center--width)/2] are mapped to zero, while they are set to 255 if greater than [(center+width)/2].
- these two parameters can greatly influence the appearance of the image displayed. In other words, the brightness and the contrast of an image is determined by these two parameters. Inadequate adjustment of these parameters can lead to degradation of image quality and in severe cases to loss of valuable diagnostic information of the images.
- the maximum and the minimum pixel intensity value are instable quantities for the automatic adjustment of display parameters. They can be influenced strongly by many factors, such as spikes and background noise. This makes any system that uses the maximum and minimum values of the image intensity instable.
- the region of interest in the intensity domain may only occupy a small portion of the dynamic range of the image pixel values. It is therefore inadequate to map the entire dynamic range of an image to [0, 255].
- the spatial distribution of an image may also play an important role in the adjustment of the display window parameters. Different organs may have similar intensity distribution (histograms) but should be windowed differently. This factor makes the use of other information sources beyond the histogram of MR images necessary. Unfortunately, all current algorithms known to us are based on histograms or its derivatives.
- the optimal display parameters also depend on the type of MR examinations. Different types of MR images may need to be viewed, and hence windowed differently. For example, 3D angiographic images, T1 or T2 weighted images, and inversion recovery images should be windowed very differently.
- the optimal display window parameter setting is environmental condition dependent. Different lighting conditions, for example, may influence the adjustment results greatly.
- the optimal display parameters are also monitor dependent. Different monitor settings, such as the gamma curve, the brightness and the contrast control values, may also affect the window width and center parameters strongly. There may be even large difference between aged and new monitors.
- this method has some advantages by utilizing a neural network over the above two methods, it is still a pure histogram based method since the features for the training is generated only from the histogram.
- pure histogram based methods will not be able to solve the potential problem for the images with different spatial distributions but very similar histograms.
- pure neural network based methods in general have problems when an input image type has not been trained before. Since MRI can generate a large amount of different image types with different pulse sequences and different TR, TE, TI parameters, it presents a great challenge for any pure neural network based method to cover all possible cases in the training phase.
- this method uses only one neural network to learn the relationship between histogram based features and the desired output of the optimal display parameters.
- the present invention provides a system for the automatic adjustment of display window width and center for a wide range of MR images.
- the system consists of a feature generator utilizing both histogram and spatial information computed from an input MR image, a wavelet transform within the feature generator for compressing the size of the feature vector, a classifier for clustering MR images into different subclasses, a bi-modal linear estimator and a radial bases function network based non-linear estimator for each subclass, as well as a data fusion system using estimates from both estimators to compute the final display parameters.
- Both estimators can adapt to new kinds of MR images simply by training them with those images, which makes the present invention adaptive and extendable. This trainability also makes possible advanced future developments such as adaptation of the display parameters to a user's personal preference. While the non-linear neural network based estimator performs very well for images which are similar to those in the training data set, the linear estimator provides reasonable estimations for a wide range of images, which may not be included in the training data set. The data fusion makes the final estimation of the display parameters accurate for trained images and robust for the unknown images.
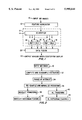
- FIG. 1 illustrates a block diagram of one embodiment of the present invention.
- FIG. 2 illustrates a flow chart of the wavelet histogram feature extraction process.
- FIG. 3 illustrates the implementation of the wavelet transform via the QMF structure from one level to the next with FIG. 3(a) showing decomposition and
- FIG. 3(b) showing reconstruction, adopted from S. G. Mallat, "A Theory Of Multiresolution Signal Decomposition", IEEE Trans. Pattern Anal. Machine Intell., Vol. 11, No. 7, pp. 647-693, 1989.
- FIG. 4 illustrates two completely different MR images shown in FIG. 4(a) and FIG. 4(b) with very similar histograms but very different window width/center settings as shown in FIG. 4(c). Their wavelet histogram feature vectors are still very similar as shown in FIG. 4(d). With the inclusion of the spatial statistical features, the complete feature vectors become much more distinct as shown in FIG. 4(e).
- FIG. 5 illustrates mean and standard deviations combined to be the spatial statistical features.
- FIG. 6 illustrates cross talk maps for more than eight hundred diverse MR images computed with FIG. 6(a) showing wavelet histogram features only and FIG. 6(b) showing wavelet histogram features and the spatial statistical features.
- FIG. 7 illustrates the structure of a modified competitive layer network for clustering.
- FIG. 8 illustrates the structure of a RBF network for function approximation.
- FIG. 9 illustrates the structure of the width bimodal linear network in FIG. 9(a) and the center bimodal linear network in FIG. 9(b).
- FIG. 10 illustrates the consistency measures M w .sup.(i) and M c .sup.(i) for width and center estimates in the i-th cluster respectively.
- FIG. 11 illustrates through experimental results, the MR images with the largest errors in the window width/center estimation from the neural network system of the present invention.
- FIG. 1 illustrates a block diagram of one embodiment of the present invention.
- ninety clusters (classes) will be used for dealing with a wide range of MR image types.
- eight classes with the highest confidence scores from the competitive layer neural network will be used for the estimation.
- a data fusion system is utilized for providing the final robust estimations of the optimal display window parameters.
- the present invention includes feature generator 12 that uses both histogram and spatial intensity distributions of input MR images 10. This resolves, in most cases, the conflicting situations where the window display settings are very different although the histograms of the images are very similar. Since MR images have a data depth of twelve bits, the size of the image histogram could be large. It is therefore necessary to compress the histogram information into a much smaller size, such as sixteen elements for efficient training of neural networks. Both wavelet transform and principal component analysis (PCA) methods have been implemented for obtaining a compact representation of useful information from the MR images. Since the experiments did not show any significant performance difference between both methods and PCA is more computationally expensive, it has been decided to use the wavelet transform for one embodiment of the invention.
- PCA principal component analysis
- Hierarchical neural networks 13 For distinguishing different types of MR images, hierarchical neural networks 13 are used. Hierarchical neural networks 13 include classifier 14, Radial Bases Function (RBF) networks 16 and Bimodal Linear Estimation (BLE) networks 18. Classifier 14 is a competitive layer neural network that clusters any input image into a certain number of clusters. Ninety different clusters (classes) have been used in the current explanation for covering a wide range of different types of MR images. Furthermore, two totally different and independent estimation methods are used for each class for achieving good performance. Radial bases function networks 16 are used for providing accurate estimation for known (trained) MR image types, while bimodal linear estimation networks 18 provide robust and reasonable estimation for a wide range of images, that may not be included in the training data set. Finally, data fusion system 20 is implemented for making the overall system accurate for trained images and robust for the unknown images. The output of data fusion system 20 is output window width and center for display 22.
- a wavelet transformation within feature generation 12 is utilized to compress the histogram of MR images 10 (usually with 4096 bins) to a much smaller size, say sixteen elements, of the feature vector so that the neural networks can be executed and trained efficiently.
- the following will describe the representative features extracted from input MR images 10 used for the estimation of display window width and center, i.e. these features will be fed into the neural networks for window width/center estimation.
- the chosen features must be decisive for the adjustment of the display window width and center.
- the features used in the present invention consist of histogram features and spatial statistical features. The following describes how these two different types of features are extracted from the image.
- Histogram information is very important for the determination of the display window width and center for an MR image.
- Several methods have been proposed previously to automatically adjust the window width and center for an image from its histogram.
- the histogram features are extracted from the histogram of an image as follows.
- the flow of the wavelet histogram or the Karhunen-Loeve histogram feature extraction process is illustrated in FIG. 2.
- the histogram is computed and subsampled in compute and subsample histogram 32 from the input image 10 and a range of interest is obtained from it in range of interest 34.
- the histogram is then smoothed and re-sampled using a pre-determined number of bins in re-sample and normalize histogram 36.
- the wavelet transform 38 or the Karhunen-Loeve transform (KL transform) 40 of the new re-sampled histogram is computed and only the coefficients corresponding to the coarsest level as the wavelet histogram features 42 or KL histogram features 44 are taken.
- the determination of the range of interest from the subsampled histogram involves two steps.
- the first step is to find the background thresholding value from the histogram and set the portion of the histogram that is below this value to zero.
- the second step is to compute the mean ⁇ and standard deviation ⁇ of the image from the new histogram obtained from the first step.
- the range of interest is taken as the interval between max( ⁇ -3 ⁇ , 0) and min( ⁇ +3 ⁇ , Imax).
- the interval [ ⁇ -3 ⁇ , ⁇ +3 ⁇ ] is chosen based on the fact that for a Gaussian distribution 99.73% of samples are inside this interval. Since the pixel values are always inside the interval [0, Imax], the intersection between these two intervals is taken to be the range of interest. How to decide the background thresholding value will be described below.
- the subsampled histogram is smoothed by using smoothing spline. Then the local minimum point less than a default largest background threshold (set to be 100) of the smoothed subsampled histogram and with the strongest positive response to the Laplacian operator, i.e. second-order differential operator, is found. This local minimum point is chosen to be the background threshold of the image.
- the histogram in this interval is re-sampled using fixed n bins and the re-sampled n-dimensional vector is normalized by its Euclidean norm. This occurs in re-sample and normalize histogram 36.
- the wavelet transform 38 or the KL transform 40 of the above normalized vector is taken and the coefficients corresponding to the most representative bases is used to be the histogram features 42, 44.
- wavelet transform 38 the wavelet bases in the coarsest level are chosen.
- KL transform 40 the most dominant principal components are the most representative bases. The following describes wavelet transform 38 and KL transform 40 for completeness.
- Wavelet transform has been used widely in the signal and image processing communities since it provides a powerful tool for multi-resolution analysis. This is described by S. G. Mallat in "A Theory Of Multiresolution Signal Decomposition", IEEE Trans. Pattern Anal. Machine Intell., Vol. 11, No. 7, pp. 647-693, 1989.
- the construction of a wavelet basis is achieved by defining a scaling function ⁇ , such that the integer translates of the dilated scaling function ⁇ 2 -j ⁇ (2 -j X) form an orthonormal basis of L 2 (R), where j is an integer.
- the wavelet decomposition and reconstruction can be efficiently achieved via a Quadrature Mirror Filters (QMF) implementation as shown in FIG. 3.
- QMF Quadrature Mirror Filters
- a j ⁇ is the discrete approximation of the function ⁇ in the subspace V j , i.e. A j ⁇ contains the values of the inner products of the function ⁇ and the orthonormal basis functions in V j
- D j ⁇ encodes the projection of the function ⁇ on the subspace W j .
- the filters H (in decomposition) and H (in reconstruction) are low-pass filters, while the filters G (in decomposition) and G (in reconstruction) are high-pass filters. They are usually designed to be the FIR filters, which can be implemented via convolution operations. With an appropriate choice of a wavelet basis, the associated finite impulse response (FIR) filters with very short length/span can be found and the QMF filter implementation for the wavelet transform can be accomplished very efficiently.
- FIR finite impulse response
- FIG. 3 illustrates the implementation of the wavelet transform via the QMF structure from one level to the next.
- FIG. 3(a) shows decomposition while FIG. 3(b) shows reconstruction.
- FIG. 3 is adopted from S. G. Mallat, "A Theory Of Multiresolution Signal Decomposition", IEEE Trans. Pattern Anal. Machine Intell., Vol. 11, No. 7, pp. 647-693, 1989.
- the QMF structure decomposes the space from one level to the next coarser level with each stage involving a low-pass and high-pass filtering.
- an orthogonal wavelet transform is used, which means the low-pass filter H is the same as H and the high-pass filter G is the same as G.
- These filters are implemented by FIR filters of coefficients ⁇ -0.0761025, 0.3535534, 0.8593118, 0.3535534, -0.0761025 ⁇ and coefficients ⁇ -0.0761025, -0.3535534, 0.8593118, -0.3535534, -0.0761025 ⁇ for H and G, respectively.
- the histogram is preprocessed and subsampled to a vector of size 64. Then, the wavelet decomposition of three levels are performed on the vector. The eight coefficients corresponding to the coarsest level are used as the wavelet histogram features.
- KL transform also commonly referred to as the principal component analysis (PCA)
- PCA principal component analysis
- KL transform is very efficient in data compression. It is described by R. C. Gonzalez and P. Wintz in "Digital Image Processing", 2nd Ed., Addison-Wesley Pub., 1987. It is based on the statistical analysis of the input data set to construct a set of orthogonal bases, i.e. the principal components, associated with the eigenvalues meaning the average magnitude of all the input data along these principal components. Since these principal components are orthogonal, they are uncorrelated from a statistical perspective. By ordering the associated eigenvalues, the most dominant principal components to represent the input vector compactly can be found. In the implementation of the present invention, usually eight most dominant principal components are used for the projection of the preprocessed histogram vector.
- a correlation matrix C of these vectors is defined as ##EQU1## Since the matrix C is symmetric positive definite as described by G. H. Golub and C. F.
- the window width and center reference values are computed for the display window from the histogram as input to the bi-modal linear networks, which will be explained later.
- each component of the original histogram vector is thresholded by an appropriately chosen value.
- the reference window center is set to be a mean gray level with the thresholded histogram vector as the weighting, and the reference window width is chosen to be the number of non-zero entries in the thresholded histogram vector.
- These window width and center reference values will be fed into the width and center bi-modal linear networks, respectively.
- the window width and center reference values are denoted by w 0 and c 0 , respectively.
- FIG. 4 depicts an example of two different MR images with very similar histograms but very different window width/center settings. The two completely different MR images are shown in FIG. 4(a) and FIG. 4(b) with very similar histograms but very different window width/center settings shown in FIG. 4(c).
- the whole image is first partitioned into 4-by-4 blocks. Then the mean and standard deviation of each individual block is used to form the spatial statistical features.
- the values for each block in the central 2-by-2 region and the average values for the upper two, lower two, left two and right two blocks, are used respectively. This arrangement is illustrated in FIG. 5.
- the means and standard deviations in the marked block regions are combined to be the spatial statistical features.
- outer blocks there are the following linear combinations of block means and block standard deviations m 12 +m 13 , ⁇ 12 + ⁇ 13 , m 21 +M 31 , ⁇ 21 + ⁇ 31 , m 24 +m 34 , ⁇ 24 + ⁇ 34 , m 42 +m 43 , and ⁇ 42 + ⁇ 43 as the statistical features.
- the concatenation of all the above features in the central 2-by-2 blocks as well as the outer blocks constitute the spatial statistical features.
- the feature vector which is the input to the neural networks is chosen to be the concatenation of the wavelet or KL histogram features discussed above and the spatial statistical features. This combined feature vector is denoted by v.
- a cross talk map is introduced for determining the discrimination power of the features for estimation (function approximation).
- the cross talk map indicates the degree of complexity for the function to be approximated.
- a cross talk measure C is defined between two normalized feature vectors u and v with window center and width values given by (c u ,w u ) and (c v ,w v ), respectively, as follows:
- the symbol ⁇ stands for the Euclidean distance.
- the feature vectors and the window width and center values have to be appropriately normalized in the above definition, i.e. the same as the input and output of the function approximation neural networks.
- a relative difference minimum norm is used for the difference between the window width and center settings in the numerator of the cross talk measure definition. This norm is designed especially for the window width and center adjustment problem.
- the cross talk measure C(u,c u ,w u ;v,c v ,w v ) is large, it means that the two feature vectors are similar but that their window width and center settings are very different, thus making the window width/center adjustment function to be approximated complicated. Therefore, it would be desirable to choose the features such that the entire cross talk measures are as small as possible.
- FIG. 6 illustrates the cross talk maps for more than eight hundred diverse MR images with the wavelet histogram features only as shown in FIG. 6(a) as well as with the wavelet histogram features plus the spatial statistical features shown in FIG. 6(b). Comparing these two cross talk maps, it can clearly be seen that the inclusion of spatial statistical features significantly reduces the cross talk measures, thus making the function approximation problem easier for the neural network solution. In addition, it also improves the robustness of the present invention since the complexity of the function to be approximated is reduced with the addition of the spatial statistical features.
- the present invention includes new hierarchical neural networks (13 of FIG. 1) for window width and center estimation.
- the hierarchical neural networks contain a classifier (clustering network) and estimation networks.
- the clustering network is used to classify the input feature vector into multiple classes which are most closest to it, instead of just one class. This concept is similar to the "soft" splits of data used in the hierarchical mixtures of experts M. I. Jordan and R. A. Jacobs, in "Hierarchical Mixtures Of Experts And The EM Algorithm", MIT A.I. Memo, No. 1440, 1993.
- the competitive network is employed with the modification that a fixed number of closest classes are chosen, instead of just one.
- estimation networks are associated to produce the window width and center estimation. Two types of estimation networks are employed here. One is the RBF (radial basis function) network and the other is the bi-modal linear network. The details of the aforementioned networks are described below.
- the competitive layer network has been modified to classify the input vector v into multiple clusters instead of just one single cluster.
- N is empirically set to be 90 in the implementation of the present invention.
- Each cluster is represented by a centroid u i , where i is the cluster index.
- the input vector is assigned to m clusters which are closest to it, where m is chosen to be 8 in the implementation of the present invention. This can be accomplished by computing the distances between the input feature vector and all the centroids. Then the m clusters with the shortest distances to the input vector are the results of the clustering.
- the structure of the modified competitive layer network for clustering is shown in FIG. 7.
- the symbol ⁇ in the figure stands for the Euclidean norm.
- estimation networks After the input feature vector is classified into m clusters after the clustering network, it is fed into the corresponding estimation networks, which consist of RBF networks and bi-modal linear networks.
- the inclusion of the pre-clustering process has the advantage of reducing the complexity of the problem, i.e. it can divide a very complex function approximation problem in a big space to a number of simpler function approximation problems in smaller spaces.
- Each simpler function approximation problem is tackled by the RBF network as well as by the bi-modal linear network separately. A brief description of these networks is given below.
- the input vector to the radial basis function (RBF) networks is the same as the input vector to the competitive layer clustering network, i.e. the feature vector v discussed above.
- the outputs are the estimated window width w i and center c i , where the subscript i denotes the index of the RBF network.
- the structure for an individual RBF network for function approximation is shown in FIG. 8.
- the RBF network has one hidden layer, which consists of M nodes in FIG. 8. Each node is represented by a centroid x j , where the subscript j denotes index of the node.
- the input to each node is the feature vector v.
- the output of each node is a radial basis function of the distance between the input feature vector and the associated centroid, i.e. G(v;x j ).
- G(v;x j ) the multivariate Gaussian function
- the window width or center estimate from the RBF network has the following form ##EQU2##
- each node The contribution of each node to the estimate is given by the weight W j .
- the centroids and the weights are obtained through the RBF network training from a large image data set with the associated window width and center values adjusted by human experts.
- the total number of nodes used in each RBF network depends on the complexity of the training data points classified into this cluster. This is usually determined during the training process.
- the basic idea behind the use of the bi-modal linear networks here is the observation that the distribution of the ratios between the window width or center values adjusted by human experts and the corresponding window width or center reference values discussed above in each cluster can be roughly approximated by a mixture of two Gaussian functions.
- the bi-modal linear networks for each cluster are designed to produce two window width or center estimates corresponding to the means of the two Gaussian distributions. One of these two estimates is a robust indicator to the goodness of the estimates obtained by the RBF networks.
- the outputs of the bi-modal linear networks will be used to define confidence measures for the estimates from the RBF networks and then these estimates will be combined based on the associated confidence measures to obtain the final window width and center estimates.
- the following will describe the structure of the bi-modal linear network for each cluster.
- FIG. 9(a) shows the structure of the width
- FIG. 9(b) shows the structure of the center bi-modal linear networks.
- the input is the window width or center reference value.
- the network generates two outputs which are the scaled values of the input.
- the weights, i.e. the scaling factors, required in the networks are obtained via training, which will be discussed later.
- the fusion system of the present invention that is used to intelligently combine the estimates obtained from the RBF networks and the bi-modal linear networks.
- one image is classified to multiple clusters and there are window width and center estimates from the corresponding RBF networks and bi-modal linear networks for each cluster.
- the same image data set and the same clustering results are used to train these networks.
- the window width and center estimates for a new image produced by these two different networks should be consistent with each other if the input image is similar to one of the images in the training data set.
- the philosophy of fusing all different estimates to obtain the final window width and center estimate is to take the weighted average of the estimates from the RBF networks with each weight determined by the degree of consistency between the estimate from the RBF network and the corresponding estimate from the bi-modal network for the same cluster. This is because the RBF network can give more accurate estimation when the input image is correctly classified into the cluster, while the estimates produced by the bi-modal linear network are more rough but more robust. Therefore, the estimates from the bi-modal linear networks are used as the reference values for the RBF network estimation.
- the consistency between the estimates from the two different networks for the same cluster indicates how well the input image falls into this cluster.
- a consistency measure based on the relative distance between the estimates from these two different networks can be defined the estimates from the RBF networks of the chosen clusters can be combined with the weighting given by the consistency measure. The details are given below.
- the smaller value of the cosine function of the relative errors between the RBF network estimate and each of the two linear network estimates is taken and the measure is set to zero when the both relative errors are greater than a threshold ⁇ , which is chosen to be 0.9 in the present implementation.
- This thresholding procedure simply means that the RBF network estimate in this cluster is totally inconsistent with the estimates from the bi-modal linear network when both of the relative errors are greater than the threshold, thus these estimates will not be used in the final fusion of the estimates from different clusters.
- the above definition is based on the observation that the distribution of window width/center values adjusted by human experts for a large set of various images can be well approximated by a mixture of two Gaussian functions.
- each estimate from the RBF network should be close to either one of the centers of the corresponding two Gaussian functions for each cluster when the input image is appropriately classified into this cluster.
- the cosine function is chosen in the definition of the consistency measure since it is non-negative, symmetric around zero and decreases smoothly away from zero to ⁇ /2.
- an appropriate exponential function such as a Gaussian function, can also be used to achieve similar purposes.
- the hierarchical neural networks consist of the competitive layer clustering networks, RBF estimation networks and bi-modal linear estimation networks.
- the training of these networks require a large set of various MR images with the window width and center values adjusted by the human experts to be the training data.
- the feature vectors are extracted from the MR images to be the input vectors to the neural networks, and the window width and center values are normalized to be the anticipated outputs for the estimation networks.
- the training for these different networks used in the present implementation are basically accomplished by standard training algorithms in neural networks.
- the competitive layer clustering networks is trained via an unsupervised Kohonen learning rule. Since it is an unsupervised training, it is only necessary to use the input feature vectors for the training. After the training, N vectors u 1 , u 2 , u 3 , . . . ,u N , are obtained which are the centers of the clusters. For a new input MR image, the m clusters whose centers are closest to its feature vector are found to be the clustering results. Note that the training of the clustering networks has to be completed before the training of the estimation networks for each cluster.
- the training of the RBF and bi-modal linear estimation networks not only are the computed input feature vectors needed but also the normalized window width and center values as the anticipated outputs of the networks.
- the training of these estimation networks requires clustering results.
- the training algorithm is to minimize the maximum of the relative errors between the anticipated output and the network output by incrementally adding nodes into the networks.
- the training of the bi-modal linear networks is based on roughly classifying the data into two groups for each cluster, then the weight for each group can be easily computed by averaging the ratios of the anticipated outputs to the corresponding inputs.
- more than two thousand and four hundred MR images of various types and studies with their window width and center values adjusted by human experts for the training of the neural networks have been used.
- four hundred and sixty various MR images of diverse types were used as the testing data set and the corresponding window width and center values adjusted by human experts were taken as the ground truth values. Note that the testing MR images along with their window width and center settings could be very different from those in the training data set center when the testing and training data sets are the same.
- the performance of the hierarchical neural network of the present invention using the wavelet histogram features is similar to that using the KL histogram features.
- the experimental results reported here are obtained by using the wavelet histogram features.
- the total number of clusters N is empirically set to 90, and the total number of assigned clusters for each input image m is chosen to be 8.
- the present invention provides very accurate estimation for the window width and center when the testing and training data sets are the same.
- the training of estimation networks is the same as function fitting to the training data. Perfect fitting to the training data can be achieved by increasing the total number of clusters in the hierarchical networks or the nodes in the RBF networks. However, it may fall into the over-training (or over-fitting) problem and degrade the generalization power of the networks.
- the generalization of neural networks is the ability to give reasonable outputs, i.e. window width/center estimates, which are close to the target values (human adjusted values) for MR images not in the training data set. In most cases including the window width/center estimation problem, there is more interest in the generalization power of the networks. Therefore, a testing data set containing 460 diverse MR images, which are totally different from the images in the training data set, is used for testing the generalization power of the networks.
- Table 1 depicts the training results of the networks for the percentages of the width and center estimates of the training data set with the relative error below 15%, 20%, 25%, 30%, 35%, 40%, 45% and 50%.
- the average relative errors are 7.06% for the width estimation and 6.97% for the center estimation.
- the average absolute errors are 45.7 and 76.4 for the center and width estimates, respectively.
- the relative error is more useful than the absolute error in the accuracy assessment of the window width/center adjustment problem, since the ranges of the intensity values (or window width/center values) for MR images can be very different from images to images.
- the absolute error is just given for reference.
- These trained networks will be used to test the 460 diverse MR images in the testing data set, which is exclusive from the training data set.
- the human adjusted window width and center values for these images are used as the ground truth for assessing the accuracy of the hierarchical neural network estimation.
- Table 1 below is a summary of the training results on a wide range of 2436 MR images for the hierarchical neural network method. Note that the training results can be further improved by increasing the total number of clusters in the hierarchical networks or the nodes in the RBF networks, which may lead to the over-training problem. Therefore, a comprised setting for the training to avoid the over-training problem and provide good generalization capability has been chosen.
- Table 2 is a summary of the results of the experiment on the testing data set containing 460 diverse MR images, which are completely different from those in the training data set, by using the hierarchical neural network method.
- the generalization power of the hierarchical neural networks (with the training results given in Table 1) is tested on a totally different data set containing 460 diverse MR images.
- the human adjusted window width and center values for these images are used as the ground truth for assessing the accuracy of the hierarchical neural network estimation.
- the results of applying the present invention on this testing data set are reported in Table 2.
- the average relative errors for the center and width estimates are 15.07% and 18.01%, respectively.
- the absolute errors for the center and width estimates are 90.8 and 218.9, respectively.
- some MR images with the largest estimation errors from the hierarchical neural network system can be depicted to show the robustness of the present invention in FIG. 11.
- These MR images are shown with the window width and center values adjusted by human experts and by the neural network system of the present invention.
- the present invention gives more than 50% errors either in window width or center estimates. Note that the present invention fails to provide the window width/center estimates within 50% errors for only less than 5% of the images in the testing data set.
- the displays of the images with the worst estimation results depicted in FIG. 11 show that the estimates provided by the present invention with largest relative deviations from the settings by human experts are still reasonable, although they may not be the optimal settings for each individual.
- this high-level knowledge also relates to personal preference and it could vary greatly from person to person. This could lead to very different window width and center adjustment for the same MR image by different human experts. It is very possible the display window parameter settings for the training data set and testing data set are not very consistent, since they were adjusted by different human experts at different time and at different conditions. Therefore, the window width/center estimation obtained from the neural networks occasionally lead to large deviations for some images possibly due to the fact that their display window parameters were adjusted by different human experts with different tastes, in different environmental conditions, or on different display monitors. Therefore, the on-line training capability will be necessary to adapt the window width and center estimation to personal preference, different environmental conditions and different settings of display monitors.
- FIG. 11 illustrates the MR images with the largest errors in the window width/center estimation from the neural network system of the present invention. These images are shown with the window width and center values adjusted by human experts and by the neural network system shown in the left and right columns, respectively. For these images among the worst estimation results, the displays with the window width/center values provided by the system are still reasonable as shown in the figure, although they may not be the optimal settings.
- the present invention is a robust and accurate display window width/center estimation system for MR images based on hierarchical neural networks.
- the wavelet histogram features and the spatial statistical features are extracted from the images and used as the input feature vector to the neural networks.
- the hierarchical neural networks of the present invention consist of a competitive layer neural network for clustering, 180 RBF networks and 180 bi-modal linear networks for estimation.
- the clustering network classifies an image into multiple clusters. Then the estimates from the associated estimation networks of these clusters are combined to provide the final estimation. The fusion of these estimates is accomplished by weighted averaging with the weight determined by consistency measure between the two estimates from the RBF network and bi-modal network in the same cluster.
- the hierarchical neural network of the present invention was trained using a training data set containing more than 2400 MR images. After the training, the system was tested on 460 diverse MR images which are completely exclusive from those in the training data set. The testing results show that the system can provide window width/center estimation within 20%-30% errors for approximately 85% of all the testing images. In most cases, there is no significant differences in the image display with the display window parameter settings within 20%-30% relative differences.
- the window width/center estimation using the hierarchical neural network system occasionally lead to large deviations for some images that require high-level knowledge, such as anatomical structure or purpose of examination, to adjust the display window to display only the regions of interest optimally while scarifying the rest of the image.
- the display window setting of these images may be strongly dependent on personal preference and environmental conditions. Therefore, the on-line training capability will be necessary to adapt the window width and center estimation to personal preference and different environmental conditions.
Abstract
Description
V.sub.j ⊕W.sub.j ⊕W.sub.j-1 ⊕ . . . ⊕W.sub.1 =V.sub.0
C(u,c.sub.u,w.sub.u ;v,c.sub.v,w.sub.v)=(min(∥((c.sub.u -c.sub.v)/c.sub.u, (w.sub.u -w.sub.v)/w.sub.u)∥, ∥((c.sub.u -c.sub.v)/c.sub.v, (w.sub.u -w.sub.v)/w.sub.v)∥))/(∥u-v∥)
G(v;x.sub.j)=e.sup.-∥v-xj∥
______________________________________
           Percentage of Width
                        Percentage of Center
Error Bound
           Estimates    Estimates
______________________________________
15%        89.29%       88.38%
20%        93.86%       93.97%
25%        96.37%       97.21%
30%        97.95%       98.52%
35%        98.56%       99.22%
40%        98.93%       99.59%
45%        99.18%       99.63%
50%        99.26%       99.71%
______________________________________
______________________________________
           Percentage of Width
                        Percentage of Center
Error Bound
           Estimates    Estimates
______________________________________
15%        48.04%       64.35%
20%        63.48%       78.59%
25%        78.04%       83.91%
30%        84.13%       88.04%
35%        89.78%       92.61%
40%        93.26%       94.57%
45%        95.00%       96.09%
50%        96.74%       96.74%
______________________________________
Claims (21)
Priority Applications (1)
| Application Number | Priority Date | Filing Date | Title |
|---|---|---|---|
| US08/885,080 US5995644A (en) | 1997-06-30 | 1997-06-30 | Robust and automatic adjustment of display window width and center for MR images |
Applications Claiming Priority (1)
| Application Number | Priority Date | Filing Date | Title |
|---|---|---|---|
| US08/885,080 US5995644A (en) | 1997-06-30 | 1997-06-30 | Robust and automatic adjustment of display window width and center for MR images |
Publications (1)
| Publication Number | Publication Date |
|---|---|
| US5995644A true US5995644A (en) | 1999-11-30 |
Family
ID=25386090
Family Applications (1)
| Application Number | Title | Priority Date | Filing Date |
|---|---|---|---|
| US08/885,080 Expired - Lifetime US5995644A (en) | 1997-06-30 | 1997-06-30 | Robust and automatic adjustment of display window width and center for MR images |
Country Status (1)
| Country | Link |
|---|---|
| US (1) | US5995644A (en) |
Cited By (41)
| Publication number | Priority date | Publication date | Assignee | Title |
|---|---|---|---|---|
| US6175643B1 (en) * | 1997-12-18 | 2001-01-16 | Siemens Corporate Research, Inc. | Neural network based auto-windowing system for MR images |
| US20020076088A1 (en) * | 2000-12-15 | 2002-06-20 | Kun-Cheng Tsai | Method of multi-level facial image recognition and system using the same |
| US6434261B1 (en) * | 1998-02-23 | 2002-08-13 | Board Of Regents, The University Of Texas System | Method for automatic detection of targets within a digital image |
| US20030002731A1 (en) * | 2001-05-28 | 2003-01-02 | Heiko Wersing | Pattern recognition with hierarchical networks |
| US20030021472A1 (en) * | 2001-07-10 | 2003-01-30 | Mutsuko Nichogi | Image compression device and image uncompression apparatus utilizing the same |
| US20030115165A1 (en) * | 2001-09-25 | 2003-06-19 | Tetsuya Hoya | Memory system for use of modeling psychological functions of the brain |
| US6591405B1 (en) * | 2000-11-28 | 2003-07-08 | Timbre Technologies, Inc. | Clustering for data compression |
| US20030179917A1 (en) * | 2002-03-25 | 2003-09-25 | Siemens Aktiengesellschaft | Method for image presentation in medical imaging |
| US20030204384A1 (en) * | 2002-04-24 | 2003-10-30 | Yuri Owechko | High-performance sensor fusion architecture |
| US20040170308A1 (en) * | 2003-02-27 | 2004-09-02 | Igor Belykh | Method for automated window-level settings for magnetic resonance images |
| US20040252909A1 (en) * | 2003-06-11 | 2004-12-16 | Canon Kabushiki Kaisha | Image processing method, image processing apparatus, program, and computer storage medium |
| US20050201591A1 (en) * | 2004-03-10 | 2005-09-15 | Kiselewich Stephen J. | Method and apparatus for recognizing the position of an occupant in a vehicle |
| US20050207631A1 (en) * | 2002-02-15 | 2005-09-22 | Harald Martens | Method of image analysis |
| WO2006017233A1 (en) * | 2004-07-12 | 2006-02-16 | Lehigh University | Image fusion methods and apparatus |
| US20060093207A1 (en) * | 2004-11-04 | 2006-05-04 | Reicher Murray A | Systems and methods for viewing medical images |
| US20060093199A1 (en) * | 2004-11-04 | 2006-05-04 | Fram Evan K | Systems and methods for viewing medical 3D imaging volumes |
| US20060098887A1 (en) * | 2004-05-19 | 2006-05-11 | Hazem El-Bakry | Mehthod for image conversion |
| US20060106642A1 (en) * | 2004-11-04 | 2006-05-18 | Reicher Murray A | Systems and methods for matching, naming, and displaying medical images |
| US7095907B1 (en) * | 2002-01-10 | 2006-08-22 | Ricoh Co., Ltd. | Content and display device dependent creation of smaller representation of images |
| US20060239541A1 (en) * | 2005-03-23 | 2006-10-26 | Charles Florin | System and method for vascular segmentation by Monte-Carlo sampling |
| US20080285831A1 (en) * | 2007-05-18 | 2008-11-20 | Siemens Corporate Research, Inc. | Automatically updating a geometric model |
| US20090171211A1 (en) * | 2003-01-15 | 2009-07-02 | Takeshi Matsumura | Ultrasonographic device |
| US7561732B1 (en) * | 2005-02-04 | 2009-07-14 | Hrl Laboratories, Llc | Method and apparatus for three-dimensional shape estimation using constrained disparity propagation |
| US7885440B2 (en) | 2004-11-04 | 2011-02-08 | Dr Systems, Inc. | Systems and methods for interleaving series of medical images |
| US7953614B1 (en) | 2006-11-22 | 2011-05-31 | Dr Systems, Inc. | Smart placement rules |
| US7970625B2 (en) | 2004-11-04 | 2011-06-28 | Dr Systems, Inc. | Systems and methods for retrieval of medical data |
| US20120201344A1 (en) * | 2011-02-09 | 2012-08-09 | Ute Feuerlein | Method and x-ray device for adapting greyscale windowing |
| US8380533B2 (en) | 2008-11-19 | 2013-02-19 | DR Systems Inc. | System and method of providing dynamic and customizable medical examination forms |
| CN103310227A (en) * | 2012-03-16 | 2013-09-18 | 上海联影医疗科技有限公司 | Automatic window width and window level extraction method based on neural network |
| US8712120B1 (en) | 2009-09-28 | 2014-04-29 | Dr Systems, Inc. | Rules-based approach to transferring and/or viewing medical images |
| US8798351B2 (en) * | 2008-04-17 | 2014-08-05 | The Ohio State University Research Foundation | System and method for improved real-time cine imaging |
| WO2014199266A1 (en) * | 2013-06-12 | 2014-12-18 | Koninklijke Philips N.V. | Displaying mri images with clinical context-based automatic window width and level setting |
| US9092727B1 (en) | 2011-08-11 | 2015-07-28 | D.R. Systems, Inc. | Exam type mapping |
| CN105005976A (en) * | 2015-03-30 | 2015-10-28 | 成都中昊英孚科技有限公司 | Fusion based infrared image enhancement method |
| US20160019680A1 (en) * | 2013-03-29 | 2016-01-21 | Koninklijke Philips N.V. | Image registration |
| CN108334733A (en) * | 2017-09-01 | 2018-07-27 | 上海联影医疗科技有限公司 | Medical image display method, display system and computer readable storage medium |
| US10387751B2 (en) * | 2017-01-12 | 2019-08-20 | Arizona Board Of Regents On Behalf Of Arizona State University | Methods, apparatuses, and systems for reconstruction-free image recognition from compressive sensors |
| US10665342B2 (en) | 2013-01-09 | 2020-05-26 | Merge Healthcare Solutions Inc. | Intelligent management of computerized advanced processing |
| US10909168B2 (en) | 2015-04-30 | 2021-02-02 | Merge Healthcare Solutions Inc. | Database systems and interactive user interfaces for dynamic interaction with, and review of, digital medical image data |
| US20210393216A1 (en) * | 2020-06-23 | 2021-12-23 | GE Precision Healthcare LLC | Magnetic resonance system, image display method therefor, and computer-readable storage medium |
| US11328174B2 (en) * | 2018-09-28 | 2022-05-10 | Daikin Industries, Ltd. | Cluster classification device, environment generation device, and environment generation system |
Citations (3)
| Publication number | Priority date | Publication date | Assignee | Title |
|---|---|---|---|---|
| US5305204A (en) * | 1989-07-19 | 1994-04-19 | Kabushiki Kaisha Toshiba | Digital image display apparatus with automatic window level and window width adjustment |
| US5825936A (en) * | 1994-09-22 | 1998-10-20 | University Of South Florida | Image analyzing device using adaptive criteria |
| US5835618A (en) * | 1996-09-27 | 1998-11-10 | Siemens Corporate Research, Inc. | Uniform and non-uniform dynamic range remapping for optimum image display |
-
1997
- 1997-06-30 US US08/885,080 patent/US5995644A/en not_active Expired - Lifetime
Patent Citations (3)
| Publication number | Priority date | Publication date | Assignee | Title |
|---|---|---|---|---|
| US5305204A (en) * | 1989-07-19 | 1994-04-19 | Kabushiki Kaisha Toshiba | Digital image display apparatus with automatic window level and window width adjustment |
| US5825936A (en) * | 1994-09-22 | 1998-10-20 | University Of South Florida | Image analyzing device using adaptive criteria |
| US5835618A (en) * | 1996-09-27 | 1998-11-10 | Siemens Corporate Research, Inc. | Uniform and non-uniform dynamic range remapping for optimum image display |
Cited By (100)
| Publication number | Priority date | Publication date | Assignee | Title |
|---|---|---|---|---|
| US6175643B1 (en) * | 1997-12-18 | 2001-01-16 | Siemens Corporate Research, Inc. | Neural network based auto-windowing system for MR images |
| US6434261B1 (en) * | 1998-02-23 | 2002-08-13 | Board Of Regents, The University Of Texas System | Method for automatic detection of targets within a digital image |
| US6591405B1 (en) * | 2000-11-28 | 2003-07-08 | Timbre Technologies, Inc. | Clustering for data compression |
| CN100405241C (en) * | 2000-11-28 | 2008-07-23 | 音质技术公司 | Clustering for data compression |
| US20020076088A1 (en) * | 2000-12-15 | 2002-06-20 | Kun-Cheng Tsai | Method of multi-level facial image recognition and system using the same |
| US6697504B2 (en) * | 2000-12-15 | 2004-02-24 | Institute For Information Industry | Method of multi-level facial image recognition and system using the same |
| US20030002731A1 (en) * | 2001-05-28 | 2003-01-02 | Heiko Wersing | Pattern recognition with hierarchical networks |
| US7308134B2 (en) * | 2001-05-28 | 2007-12-11 | Honda Research Institute Europe Gmbh | Pattern recognition with hierarchical networks |
| US7035472B2 (en) * | 2001-07-10 | 2006-04-25 | Matsushita Electric Industrial Co., Ltd. | Image compression device and image uncompression apparatus utilizing the same |
| US20030021472A1 (en) * | 2001-07-10 | 2003-01-30 | Mutsuko Nichogi | Image compression device and image uncompression apparatus utilizing the same |
| US7747549B2 (en) * | 2001-09-25 | 2010-06-29 | Rikan | Long-term memory neural network modeling memory-chaining functions of the brain wherein a pointer holds information about mutually related neurons and neurons are classified hierarchically by degree of activation |
| US20030115165A1 (en) * | 2001-09-25 | 2003-06-19 | Tetsuya Hoya | Memory system for use of modeling psychological functions of the brain |
| US7095907B1 (en) * | 2002-01-10 | 2006-08-22 | Ricoh Co., Ltd. | Content and display device dependent creation of smaller representation of images |
| US20050207631A1 (en) * | 2002-02-15 | 2005-09-22 | Harald Martens | Method of image analysis |
| US20030179917A1 (en) * | 2002-03-25 | 2003-09-25 | Siemens Aktiengesellschaft | Method for image presentation in medical imaging |
| US7715591B2 (en) * | 2002-04-24 | 2010-05-11 | Hrl Laboratories, Llc | High-performance sensor fusion architecture |
| US20030204384A1 (en) * | 2002-04-24 | 2003-10-30 | Yuri Owechko | High-performance sensor fusion architecture |
| US20090171211A1 (en) * | 2003-01-15 | 2009-07-02 | Takeshi Matsumura | Ultrasonographic device |
| EP2591730A1 (en) | 2003-01-15 | 2013-05-15 | Hitachi Medical Corporation | Ultrasonographic device for generating and displaying elastic images |
| US8206298B2 (en) | 2003-01-15 | 2012-06-26 | Hitachi Medical Corporation | Ultrasonographic elasticity imaging device |
| EP2387948A1 (en) * | 2003-01-15 | 2011-11-23 | Hitachi Medical Corporation | Ultrasonographic device for generating and displaying elastic images |
| US20040170308A1 (en) * | 2003-02-27 | 2004-09-02 | Igor Belykh | Method for automated window-level settings for magnetic resonance images |
| US7218763B2 (en) | 2003-02-27 | 2007-05-15 | Eastman Kodak Company | Method for automated window-level settings for magnetic resonance images |
| US20040252909A1 (en) * | 2003-06-11 | 2004-12-16 | Canon Kabushiki Kaisha | Image processing method, image processing apparatus, program, and computer storage medium |
| US20050201591A1 (en) * | 2004-03-10 | 2005-09-15 | Kiselewich Stephen J. | Method and apparatus for recognizing the position of an occupant in a vehicle |
| US20060098887A1 (en) * | 2004-05-19 | 2006-05-11 | Hazem El-Bakry | Mehthod for image conversion |
| WO2006017233A1 (en) * | 2004-07-12 | 2006-02-16 | Lehigh University | Image fusion methods and apparatus |
| US7660488B2 (en) | 2004-11-04 | 2010-02-09 | Dr Systems, Inc. | Systems and methods for viewing medical images |
| US8217966B2 (en) | 2004-11-04 | 2012-07-10 | Dr Systems, Inc. | Systems and methods for viewing medical 3D imaging volumes |
| US8879807B2 (en) | 2004-11-04 | 2014-11-04 | Dr Systems, Inc. | Systems and methods for interleaving series of medical images |
| US9471210B1 (en) | 2004-11-04 | 2016-10-18 | D.R. Systems, Inc. | Systems and methods for interleaving series of medical images |
| US11177035B2 (en) | 2004-11-04 | 2021-11-16 | International Business Machines Corporation | Systems and methods for matching, naming, and displaying medical images |
| US7787672B2 (en) | 2004-11-04 | 2010-08-31 | Dr Systems, Inc. | Systems and methods for matching, naming, and displaying medical images |
| US7885440B2 (en) | 2004-11-04 | 2011-02-08 | Dr Systems, Inc. | Systems and methods for interleaving series of medical images |
| US7920152B2 (en) | 2004-11-04 | 2011-04-05 | Dr Systems, Inc. | Systems and methods for viewing medical 3D imaging volumes |
| US10790057B2 (en) | 2004-11-04 | 2020-09-29 | Merge Healthcare Solutions Inc. | Systems and methods for retrieval of medical data |
| US7970625B2 (en) | 2004-11-04 | 2011-06-28 | Dr Systems, Inc. | Systems and methods for retrieval of medical data |
| US8019138B2 (en) | 2004-11-04 | 2011-09-13 | Dr Systems, Inc. | Systems and methods for viewing medical images |
| US9501863B1 (en) | 2004-11-04 | 2016-11-22 | D.R. Systems, Inc. | Systems and methods for viewing medical 3D imaging volumes |
| US8094901B1 (en) | 2004-11-04 | 2012-01-10 | Dr Systems, Inc. | Systems and methods for matching, naming, and displaying medical images |
| US10614615B2 (en) | 2004-11-04 | 2020-04-07 | Merge Healthcare Solutions Inc. | Systems and methods for viewing medical 3D imaging volumes |
| US20060106642A1 (en) * | 2004-11-04 | 2006-05-18 | Reicher Murray A | Systems and methods for matching, naming, and displaying medical images |
| US8913808B2 (en) | 2004-11-04 | 2014-12-16 | Dr Systems, Inc. | Systems and methods for viewing medical images |
| US10540763B2 (en) | 2004-11-04 | 2020-01-21 | Merge Healthcare Solutions Inc. | Systems and methods for matching, naming, and displaying medical images |
| US8244014B2 (en) | 2004-11-04 | 2012-08-14 | Dr Systems, Inc. | Systems and methods for viewing medical images |
| US10437444B2 (en) | 2004-11-04 | 2019-10-08 | Merge Healthcare Soltuions Inc. | Systems and methods for viewing medical images |
| US20060093199A1 (en) * | 2004-11-04 | 2006-05-04 | Fram Evan K | Systems and methods for viewing medical 3D imaging volumes |
| US10096111B2 (en) | 2004-11-04 | 2018-10-09 | D.R. Systems, Inc. | Systems and methods for interleaving series of medical images |
| US9734576B2 (en) | 2004-11-04 | 2017-08-15 | D.R. Systems, Inc. | Systems and methods for interleaving series of medical images |
| US9727938B1 (en) | 2004-11-04 | 2017-08-08 | D.R. Systems, Inc. | Systems and methods for retrieval of medical data |
| US20060093207A1 (en) * | 2004-11-04 | 2006-05-04 | Reicher Murray A | Systems and methods for viewing medical images |
| US8610746B2 (en) | 2004-11-04 | 2013-12-17 | Dr Systems, Inc. | Systems and methods for viewing medical 3D imaging volumes |
| US8626527B1 (en) | 2004-11-04 | 2014-01-07 | Dr Systems, Inc. | Systems and methods for retrieval of medical data |
| US9542082B1 (en) | 2004-11-04 | 2017-01-10 | D.R. Systems, Inc. | Systems and methods for matching, naming, and displaying medical images |
| US8731259B2 (en) | 2004-11-04 | 2014-05-20 | Dr Systems, Inc. | Systems and methods for matching, naming, and displaying medical images |
| US7561732B1 (en) * | 2005-02-04 | 2009-07-14 | Hrl Laboratories, Llc | Method and apparatus for three-dimensional shape estimation using constrained disparity propagation |
| US20060239541A1 (en) * | 2005-03-23 | 2006-10-26 | Charles Florin | System and method for vascular segmentation by Monte-Carlo sampling |
| US7715626B2 (en) * | 2005-03-23 | 2010-05-11 | Siemens Medical Solutions Usa, Inc. | System and method for vascular segmentation by Monte-Carlo sampling |
| US8554576B1 (en) | 2006-11-22 | 2013-10-08 | Dr Systems, Inc. | Automated document filing |
| US8457990B1 (en) | 2006-11-22 | 2013-06-04 | Dr Systems, Inc. | Smart placement rules |
| US10896745B2 (en) | 2006-11-22 | 2021-01-19 | Merge Healthcare Solutions Inc. | Smart placement rules |
| US7953614B1 (en) | 2006-11-22 | 2011-05-31 | Dr Systems, Inc. | Smart placement rules |
| US10157686B1 (en) | 2006-11-22 | 2018-12-18 | D.R. Systems, Inc. | Automated document filing |
| US9754074B1 (en) | 2006-11-22 | 2017-09-05 | D.R. Systems, Inc. | Smart placement rules |
| US9672477B1 (en) | 2006-11-22 | 2017-06-06 | D.R. Systems, Inc. | Exam scheduling with customer configured notifications |
| US8751268B1 (en) | 2006-11-22 | 2014-06-10 | Dr Systems, Inc. | Smart placement rules |
| US8098917B2 (en) * | 2007-05-18 | 2012-01-17 | Siemens Aktiengesellschaft | Automatically updating a geometric model |
| US20080285831A1 (en) * | 2007-05-18 | 2008-11-20 | Siemens Corporate Research, Inc. | Automatically updating a geometric model |
| US8798351B2 (en) * | 2008-04-17 | 2014-08-05 | The Ohio State University Research Foundation | System and method for improved real-time cine imaging |
| US8380533B2 (en) | 2008-11-19 | 2013-02-19 | DR Systems Inc. | System and method of providing dynamic and customizable medical examination forms |
| US10592688B2 (en) | 2008-11-19 | 2020-03-17 | Merge Healthcare Solutions Inc. | System and method of providing dynamic and customizable medical examination forms |
| US9501627B2 (en) | 2008-11-19 | 2016-11-22 | D.R. Systems, Inc. | System and method of providing dynamic and customizable medical examination forms |
| US9892341B2 (en) | 2009-09-28 | 2018-02-13 | D.R. Systems, Inc. | Rendering of medical images using user-defined rules |
| US10607341B2 (en) | 2009-09-28 | 2020-03-31 | Merge Healthcare Solutions Inc. | Rules-based processing and presentation of medical images based on image plane |
| US9042617B1 (en) | 2009-09-28 | 2015-05-26 | Dr Systems, Inc. | Rules-based approach to rendering medical imaging data |
| US9684762B2 (en) | 2009-09-28 | 2017-06-20 | D.R. Systems, Inc. | Rules-based approach to rendering medical imaging data |
| US9386084B1 (en) | 2009-09-28 | 2016-07-05 | D.R. Systems, Inc. | Selective processing of medical images |
| US8712120B1 (en) | 2009-09-28 | 2014-04-29 | Dr Systems, Inc. | Rules-based approach to transferring and/or viewing medical images |
| US9934568B2 (en) | 2009-09-28 | 2018-04-03 | D.R. Systems, Inc. | Computer-aided analysis and rendering of medical images using user-defined rules |
| US9501617B1 (en) | 2009-09-28 | 2016-11-22 | D.R. Systems, Inc. | Selective display of medical images |
| US8509379B2 (en) * | 2011-02-09 | 2013-08-13 | Siemens Aktiengesellschaft | Method and X-ray device for adapting greyscale windowing |
| US20120201344A1 (en) * | 2011-02-09 | 2012-08-09 | Ute Feuerlein | Method and x-ray device for adapting greyscale windowing |
| US9092551B1 (en) | 2011-08-11 | 2015-07-28 | D.R. Systems, Inc. | Dynamic montage reconstruction |
| US9092727B1 (en) | 2011-08-11 | 2015-07-28 | D.R. Systems, Inc. | Exam type mapping |
| US10579903B1 (en) | 2011-08-11 | 2020-03-03 | Merge Healthcare Solutions Inc. | Dynamic montage reconstruction |
| CN103310227A (en) * | 2012-03-16 | 2013-09-18 | 上海联影医疗科技有限公司 | Automatic window width and window level extraction method based on neural network |
| US10672512B2 (en) | 2013-01-09 | 2020-06-02 | Merge Healthcare Solutions Inc. | Intelligent management of computerized advanced processing |
| US11094416B2 (en) | 2013-01-09 | 2021-08-17 | International Business Machines Corporation | Intelligent management of computerized advanced processing |
| US10665342B2 (en) | 2013-01-09 | 2020-05-26 | Merge Healthcare Solutions Inc. | Intelligent management of computerized advanced processing |
| US20160019680A1 (en) * | 2013-03-29 | 2016-01-21 | Koninklijke Philips N.V. | Image registration |
| WO2014199266A1 (en) * | 2013-06-12 | 2014-12-18 | Koninklijke Philips N.V. | Displaying mri images with clinical context-based automatic window width and level setting |
| CN105005976A (en) * | 2015-03-30 | 2015-10-28 | 成都中昊英孚科技有限公司 | Fusion based infrared image enhancement method |
| CN105005976B (en) * | 2015-03-30 | 2019-03-05 | 成都中昊英孚科技有限公司 | A kind of infrared image enhancing method based on fusion |
| US10909168B2 (en) | 2015-04-30 | 2021-02-02 | Merge Healthcare Solutions Inc. | Database systems and interactive user interfaces for dynamic interaction with, and review of, digital medical image data |
| US10929508B2 (en) | 2015-04-30 | 2021-02-23 | Merge Healthcare Solutions Inc. | Database systems and interactive user interfaces for dynamic interaction with, and indications of, digital medical image data |
| US10387751B2 (en) * | 2017-01-12 | 2019-08-20 | Arizona Board Of Regents On Behalf Of Arizona State University | Methods, apparatuses, and systems for reconstruction-free image recognition from compressive sensors |
| CN108334733A (en) * | 2017-09-01 | 2018-07-27 | 上海联影医疗科技有限公司 | Medical image display method, display system and computer readable storage medium |
| CN108334733B (en) * | 2017-09-01 | 2021-03-16 | 上海联影医疗科技股份有限公司 | Medical image display method, display system and computer-readable storage medium |
| US11328174B2 (en) * | 2018-09-28 | 2022-05-10 | Daikin Industries, Ltd. | Cluster classification device, environment generation device, and environment generation system |
| US20210393216A1 (en) * | 2020-06-23 | 2021-12-23 | GE Precision Healthcare LLC | Magnetic resonance system, image display method therefor, and computer-readable storage medium |
Similar Documents
| Publication | Publication Date | Title |
|---|---|---|
| US5995644A (en) | Robust and automatic adjustment of display window width and center for MR images | |
| US11449751B2 (en) | Training method for generative adversarial network, image processing method, device and storage medium | |
| Zheng et al. | A new metric based on extended spatial frequency and its application to DWT based fusion algorithms | |
| Li et al. | Content-partitioned structural similarity index for image quality assessment | |
| US6535632B1 (en) | Image processing in HSI color space using adaptive noise filtering | |
| Zheng et al. | An advanced image fusion algorithm based on wavelet transform: incorporation with PCA and morphological processing | |
| Kolesnik et al. | Multi-dimensional color histograms for segmentation of wounds in images | |
| US20080144891A1 (en) | Method and apparatus for calculating similarity of face image, method and apparatus for retrieving face image, and method of synthesizing face image | |
| US20020126891A1 (en) | Visual attention model | |
| US9589323B1 (en) | Super resolution image enhancement technique | |
| Yang | Multimodal medical image fusion through a new DWT based technique | |
| Dugas-Phocion et al. | Improved EM-based tissue segmentation and partial volume effect quantification in multi-sequence brain MRI | |
| JPH11250234A (en) | Method and device for adjusting display window parameter for displayed magnetic resonant image, and method for adjusting width and center of displayed magnetic resonant image | |
| Ramella | Evaluation of quality measures for color quantization | |
| Wang et al. | An improved enhancement algorithm based on CNN applicable for weak contrast images | |
| Rodriguez-Carranza et al. | Weighted and deterministic entropy measure for image registration using mutual information | |
| US6608915B2 (en) | Image processing method and apparatus | |
| CN107944497A (en) | Image block method for measuring similarity based on principal component analysis | |
| Pistonesi et al. | Structural similarity metrics for quality image fusion assessment: Algorithms | |
| Dahyot et al. | Robust visual recognition of colour images | |
| Lai et al. | A hierarchical neural network algorithm for robust and automatic windowing of MR images | |
| Trung et al. | Low-dose CT image denoising using image decomposition and sparse representation | |
| Hashmi et al. | Contrast Enhancement in Mammograms Using Convolution Neural Networks for Edge Computing Systems | |
| Lai et al. | Robust and automatic adjustment of display-window width and center for MR images | |
| CN113781375A (en) | Vehicle-mounted vision enhancement method based on multi-exposure fusion |
Legal Events
| Date | Code | Title | Description |
|---|---|---|---|
| AS | Assignment |
Owner name: SIEMENS CORPORATE RESEARCH, INC., NEW JERSEY Free format text: ASSIGNMENT OF ASSIGNORS INTEREST;ASSIGNORS:LAI, SHANG-HONG;FANG, MING;REEL/FRAME:008624/0666 Effective date: 19970627 |
|
| STCF | Information on status: patent grant |
Free format text: PATENTED CASE |
|
| FEPP | Fee payment procedure |
Free format text: PAYOR NUMBER ASSIGNED (ORIGINAL EVENT CODE: ASPN); ENTITY STATUS OF PATENT OWNER: LARGE ENTITY |
|
| FPAY | Fee payment |
Year of fee payment: 4 |
|
| FPAY | Fee payment |
Year of fee payment: 8 |
|
| AS | Assignment |
Owner name: SIEMENS CORPORATION,NEW JERSEY Free format text: MERGER;ASSIGNOR:SIEMENS CORPORATE RESEARCH, INC.;REEL/FRAME:024185/0042 Effective date: 20090902 |
|
| FPAY | Fee payment |
Year of fee payment: 12 |
|
| AS | Assignment |
Owner name: SIEMENS MEDICAL SOLUTIONS USA, INC., PENNSYLVANIA Free format text: ASSIGNMENT OF ASSIGNORS INTEREST;ASSIGNOR:SIEMENS CORPORATION;REEL/FRAME:037974/0022 Effective date: 20150801 |