US6278890B1 - Non-invasive turbulent blood flow imaging system - Google Patents

Non-invasive turbulent blood flow imaging system Download PDF

Info

Publication number
US6278890B1
US6278890B1 US09/188,510 US18851098A US6278890B1 US 6278890 B1 US6278890 B1 US 6278890B1 US 18851098 A US18851098 A US 18851098A US 6278890 B1 US6278890 B1 US 6278890B1
Authority
US
United States
Prior art keywords
patient
data
sensors
intervention
acoustic
Prior art date
Legal status (The legal status is an assumption and is not a legal conclusion. Google has not performed a legal analysis and makes no representation as to the accuracy of the status listed.)
Expired - Fee Related
Application number
US09/188,510
Inventor
Charles E. Chassaing
Scott Donaldson Stearns
Mark Harold Van Horn
Carl Ashley Ryden
Current Assignee (The listed assignees may be inaccurate. Google has not performed a legal analysis and makes no representation or warranty as to the accuracy of the list.)
MCG International Inc
Original Assignee
MedAcoustics Inc
Priority date (The priority date is an assumption and is not a legal conclusion. Google has not performed a legal analysis and makes no representation as to the accuracy of the date listed.)
Filing date
Publication date
Application filed by MedAcoustics Inc filed Critical MedAcoustics Inc
Priority to US09/188,510 priority Critical patent/US6278890B1/en
Assigned to MEDACOUSTICS, INC. reassignment MEDACOUSTICS, INC. ASSIGNMENT OF ASSIGNORS INTEREST (SEE DOCUMENT FOR DETAILS). Assignors: RYDEN, CARL ASHLEY, CHASSAING, CHARLES E., STEARNS, SCOTT DONALDSON, VAN HORN, MARK HAROLD
Priority to US09/293,199 priority patent/US6243599B1/en
Priority to US09/828,565 priority patent/US6574494B2/en
Application granted granted Critical
Publication of US6278890B1 publication Critical patent/US6278890B1/en
Assigned to HARRIS CORPORATION reassignment HARRIS CORPORATION ASSIGNMENT OF PATENTS Assignors: MEDACOUSTICS, INC.
Assigned to MCG INTERNATIONAL INC. reassignment MCG INTERNATIONAL INC. ASSIGNMENT OF ASSIGNORS INTEREST (SEE DOCUMENT FOR DETAILS). Assignors: HARRIS CORPORATION
Anticipated expiration legal-status Critical
Expired - Fee Related legal-status Critical Current

Links

Images

Classifications

    • AHUMAN NECESSITIES
    • A61MEDICAL OR VETERINARY SCIENCE; HYGIENE
    • A61BDIAGNOSIS; SURGERY; IDENTIFICATION
    • A61B8/00Diagnosis using ultrasonic, sonic or infrasonic waves
    • A61B8/06Measuring blood flow
    • AHUMAN NECESSITIES
    • A61MEDICAL OR VETERINARY SCIENCE; HYGIENE
    • A61BDIAGNOSIS; SURGERY; IDENTIFICATION
    • A61B34/00Computer-aided surgery; Manipulators or robots specially adapted for use in surgery
    • A61B34/20Surgical navigation systems; Devices for tracking or guiding surgical instruments, e.g. for frameless stereotaxis
    • AHUMAN NECESSITIES
    • A61MEDICAL OR VETERINARY SCIENCE; HYGIENE
    • A61BDIAGNOSIS; SURGERY; IDENTIFICATION
    • A61B7/00Instruments for auscultation
    • GPHYSICS
    • G01MEASURING; TESTING
    • G01SRADIO DIRECTION-FINDING; RADIO NAVIGATION; DETERMINING DISTANCE OR VELOCITY BY USE OF RADIO WAVES; LOCATING OR PRESENCE-DETECTING BY USE OF THE REFLECTION OR RERADIATION OF RADIO WAVES; ANALOGOUS ARRANGEMENTS USING OTHER WAVES
    • G01S15/00Systems using the reflection or reradiation of acoustic waves, e.g. sonar systems
    • G01S15/88Sonar systems specially adapted for specific applications
    • G01S15/89Sonar systems specially adapted for specific applications for mapping or imaging
    • G01S15/8906Short-range imaging systems; Acoustic microscope systems using pulse-echo techniques
    • G01S15/8979Combined Doppler and pulse-echo imaging systems
    • GPHYSICS
    • G01MEASURING; TESTING
    • G01SRADIO DIRECTION-FINDING; RADIO NAVIGATION; DETERMINING DISTANCE OR VELOCITY BY USE OF RADIO WAVES; LOCATING OR PRESENCE-DETECTING BY USE OF THE REFLECTION OR RERADIATION OF RADIO WAVES; ANALOGOUS ARRANGEMENTS USING OTHER WAVES
    • G01S7/00Details of systems according to groups G01S13/00, G01S15/00, G01S17/00
    • G01S7/52Details of systems according to groups G01S13/00, G01S15/00, G01S17/00 of systems according to group G01S15/00
    • G01S7/52017Details of systems according to groups G01S13/00, G01S15/00, G01S17/00 of systems according to group G01S15/00 particularly adapted to short-range imaging
    • G01S7/52023Details of receivers
    • G01S7/52036Details of receivers using analysis of echo signal for target characterisation
    • AHUMAN NECESSITIES
    • A61MEDICAL OR VETERINARY SCIENCE; HYGIENE
    • A61BDIAGNOSIS; SURGERY; IDENTIFICATION
    • A61B34/00Computer-aided surgery; Manipulators or robots specially adapted for use in surgery
    • A61B34/20Surgical navigation systems; Devices for tracking or guiding surgical instruments, e.g. for frameless stereotaxis
    • A61B2034/2046Tracking techniques
    • A61B2034/2055Optical tracking systems
    • AHUMAN NECESSITIES
    • A61MEDICAL OR VETERINARY SCIENCE; HYGIENE
    • A61BDIAGNOSIS; SURGERY; IDENTIFICATION
    • A61B34/00Computer-aided surgery; Manipulators or robots specially adapted for use in surgery
    • A61B34/20Surgical navigation systems; Devices for tracking or guiding surgical instruments, e.g. for frameless stereotaxis
    • A61B2034/2046Tracking techniques
    • A61B2034/2063Acoustic tracking systems, e.g. using ultrasound
    • AHUMAN NECESSITIES
    • A61MEDICAL OR VETERINARY SCIENCE; HYGIENE
    • A61BDIAGNOSIS; SURGERY; IDENTIFICATION
    • A61B90/00Instruments, implements or accessories specially adapted for surgery or diagnosis and not covered by any of the groups A61B1/00 - A61B50/00, e.g. for luxation treatment or for protecting wound edges
    • A61B90/39Markers, e.g. radio-opaque or breast lesions markers
    • A61B2090/3983Reference marker arrangements for use with image guided surgery
    • AHUMAN NECESSITIES
    • A61MEDICAL OR VETERINARY SCIENCE; HYGIENE
    • A61BDIAGNOSIS; SURGERY; IDENTIFICATION
    • A61B5/00Measuring for diagnostic purposes; Identification of persons
    • A61B5/08Detecting, measuring or recording devices for evaluating the respiratory organs
    • AHUMAN NECESSITIES
    • A61MEDICAL OR VETERINARY SCIENCE; HYGIENE
    • A61BDIAGNOSIS; SURGERY; IDENTIFICATION
    • A61B5/00Measuring for diagnostic purposes; Identification of persons
    • A61B5/24Detecting, measuring or recording bioelectric or biomagnetic signals of the body or parts thereof
    • A61B5/316Modalities, i.e. specific diagnostic methods
    • A61B5/318Heart-related electrical modalities, e.g. electrocardiography [ECG]
    • AHUMAN NECESSITIES
    • A61MEDICAL OR VETERINARY SCIENCE; HYGIENE
    • A61BDIAGNOSIS; SURGERY; IDENTIFICATION
    • A61B8/00Diagnosis using ultrasonic, sonic or infrasonic waves
    • A61B8/44Constructional features of the ultrasonic, sonic or infrasonic diagnostic device
    • A61B8/4405Device being mounted on a trolley
    • GPHYSICS
    • G01MEASURING; TESTING
    • G01SRADIO DIRECTION-FINDING; RADIO NAVIGATION; DETERMINING DISTANCE OR VELOCITY BY USE OF RADIO WAVES; LOCATING OR PRESENCE-DETECTING BY USE OF THE REFLECTION OR RERADIATION OF RADIO WAVES; ANALOGOUS ARRANGEMENTS USING OTHER WAVES
    • G01S15/00Systems using the reflection or reradiation of acoustic waves, e.g. sonar systems
    • G01S15/02Systems using the reflection or reradiation of acoustic waves, e.g. sonar systems using reflection of acoustic waves
    • G01S15/50Systems of measurement, based on relative movement of the target
    • G01S15/52Discriminating between fixed and moving objects or between objects moving at different speeds
    • GPHYSICS
    • G01MEASURING; TESTING
    • G01SRADIO DIRECTION-FINDING; RADIO NAVIGATION; DETERMINING DISTANCE OR VELOCITY BY USE OF RADIO WAVES; LOCATING OR PRESENCE-DETECTING BY USE OF THE REFLECTION OR RERADIATION OF RADIO WAVES; ANALOGOUS ARRANGEMENTS USING OTHER WAVES
    • G01S15/00Systems using the reflection or reradiation of acoustic waves, e.g. sonar systems
    • G01S15/88Sonar systems specially adapted for specific applications
    • G01S15/89Sonar systems specially adapted for specific applications for mapping or imaging
    • G01S15/8906Short-range imaging systems; Acoustic microscope systems using pulse-echo techniques
    • G01S15/899Combination of imaging systems with ancillary equipment
    • GPHYSICS
    • G01MEASURING; TESTING
    • G01SRADIO DIRECTION-FINDING; RADIO NAVIGATION; DETERMINING DISTANCE OR VELOCITY BY USE OF RADIO WAVES; LOCATING OR PRESENCE-DETECTING BY USE OF THE REFLECTION OR RERADIATION OF RADIO WAVES; ANALOGOUS ARRANGEMENTS USING OTHER WAVES
    • G01S15/00Systems using the reflection or reradiation of acoustic waves, e.g. sonar systems
    • G01S15/88Sonar systems specially adapted for specific applications
    • G01S15/89Sonar systems specially adapted for specific applications for mapping or imaging
    • G01S15/8906Short-range imaging systems; Acoustic microscope systems using pulse-echo techniques
    • G01S15/8993Three dimensional imaging systems
    • GPHYSICS
    • G01MEASURING; TESTING
    • G01SRADIO DIRECTION-FINDING; RADIO NAVIGATION; DETERMINING DISTANCE OR VELOCITY BY USE OF RADIO WAVES; LOCATING OR PRESENCE-DETECTING BY USE OF THE REFLECTION OR RERADIATION OF RADIO WAVES; ANALOGOUS ARRANGEMENTS USING OTHER WAVES
    • G01S7/00Details of systems according to groups G01S13/00, G01S15/00, G01S17/00
    • G01S7/52Details of systems according to groups G01S13/00, G01S15/00, G01S17/00 of systems according to group G01S15/00
    • G01S7/52017Details of systems according to groups G01S13/00, G01S15/00, G01S17/00 of systems according to group G01S15/00 particularly adapted to short-range imaging
    • G01S7/5205Means for monitoring or calibrating
    • GPHYSICS
    • G01MEASURING; TESTING
    • G01SRADIO DIRECTION-FINDING; RADIO NAVIGATION; DETERMINING DISTANCE OR VELOCITY BY USE OF RADIO WAVES; LOCATING OR PRESENCE-DETECTING BY USE OF THE REFLECTION OR RERADIATION OF RADIO WAVES; ANALOGOUS ARRANGEMENTS USING OTHER WAVES
    • G01S7/00Details of systems according to groups G01S13/00, G01S15/00, G01S17/00
    • G01S7/52Details of systems according to groups G01S13/00, G01S15/00, G01S17/00 of systems according to group G01S15/00
    • G01S7/52017Details of systems according to groups G01S13/00, G01S15/00, G01S17/00 of systems according to group G01S15/00 particularly adapted to short-range imaging
    • G01S7/52053Display arrangements
    • G01S7/52057Cathode ray tube displays
    • G01S7/52073Production of cursor lines, markers or indicia by electronic means
    • GPHYSICS
    • G01MEASURING; TESTING
    • G01SRADIO DIRECTION-FINDING; RADIO NAVIGATION; DETERMINING DISTANCE OR VELOCITY BY USE OF RADIO WAVES; LOCATING OR PRESENCE-DETECTING BY USE OF THE REFLECTION OR RERADIATION OF RADIO WAVES; ANALOGOUS ARRANGEMENTS USING OTHER WAVES
    • G01S7/00Details of systems according to groups G01S13/00, G01S15/00, G01S17/00
    • G01S7/52Details of systems according to groups G01S13/00, G01S15/00, G01S17/00 of systems according to group G01S15/00
    • G01S7/52017Details of systems according to groups G01S13/00, G01S15/00, G01S17/00 of systems according to group G01S15/00 particularly adapted to short-range imaging
    • G01S7/52077Details of systems according to groups G01S13/00, G01S15/00, G01S17/00 of systems according to group G01S15/00 particularly adapted to short-range imaging with means for elimination of unwanted signals, e.g. noise or interference

Definitions

  • the present invention relates generally to non-invasive blood flow imaging systems and more particularly to systems which are suitable for detecting turbulent blood flow.
  • vibration of the surrounding structures caused by turbulent blood flow in a partially occluded vessel may produce sounds which are significantly attenuated at body surfaces.
  • Turbulent blood flow is evidenced by non-uniform spatial distribution of blood flow sound phase coherence. Absent turbulence, blood flow sound phase coherence is generally uniform.
  • This invention provides reliable, non-invasive methodology and instrumentation for the in vivo detection and localization of abnormal blood flow in a patient.
  • Generic embodiments of the invention entail detection and imaging of non-uniform spatial distribution of phase coherence of blood flow sounds in a volume of a patient's body below a sensor array.
  • the wave signals detected by the sensor array comprise a shear wave component and other components including a compression wave component.
  • the shear wave component is isolated from the compression wave component.
  • the isolated shear wave component is processed to provide a display of the spatial distribution of phase coherence of the blood flow sounds in the volume of the patient's body below the sensor array.
  • An essentially uniform display indicates the absence of an abnormal blood flow.
  • a non-uniform display may indicate the presence of an occlusion and the extent of the turbulent flow in the patient's vessel.
  • the invention may include sensor signal conditioning circuitry and software to implement one or more algorithms.
  • the signal processing circuitry may be combined with a volumetric imager in a mobile clinical workstation operable by a medical technician or a doctor.
  • the invention may include means for enhancement of the signal to noise ratio of the sensor signals.
  • An important aspect of the invention is a novel non-invasive method for detecting and tracking coronary artery stenosis change following percutaneous intervention.
  • the wave front In an isotropic media when a wave front propagates out from a point source, the wave front is spherical in shape.
  • Near Field means a field near the source, where the wave front has high curvature.
  • the delays, or phase shifts between the sensors will be different.
  • the location of the source in relation to the array can be determined. The location would have 3 dimensions either in Cartesian, Polar, or Spherical coordinates. If a volume a plane is considered then the location will have two dimensions.
  • “Far Field” means a field far from the source, where the wave front has low curvature. A wave front very far from the source appears planar with no curvature. When an array of equally spaced sensors detects this plane wave front the delays, or phase shifts between the sensors may be different.
  • a coordinate transformation directions can be found where the delay is constant per distance across the array and in the orthogonal direction the delay is zero per distance across the array. Determination of the direction of the source in relation to the array is possible of the wave velocity in the medium is known. The direction would have two angular dimensions in spherical coordinates. If a plane as exists with a linear array is considered, then the direction will have one dimension, an angle and the delay or phase shifts between sensors will be constant.
  • a signal typically originates at a source and ends at a receiver.
  • a vector derived from a path model used to steer the response lobe (beam) for an array of sensors is derived from a path model used to steer the response lobe (beam) for an array of sensors.
  • Any part of the human circulatory system through which blood flows. Includes arteries, veins, and the heart.
  • Any non-laminar e.g., turbulent blood flow in a vessel.
  • a propagating wave generated by abnormal blood flow usually comprising a compression wave component and a shear wave component.
  • Any current or voltage mode device which generates an electric signal from displacement or a derivative thereof upon detection of a sound wave.
  • the pattern or spaced arrangement of a plurality of sensors on or to be placed on the body surface of a patient may be fixed in a device or pod positionable on the body surface of a patient.
  • phonocardiography also comprises carotid, apex and venous pulse sounds.
  • the vessels that carry blood toward and away from the heart include the aorta and pulmonary artery.
  • the vessels carrying blood toward the heart include the superior and inferior vena cava.
  • E ⁇ • ⁇ denotes the statistical expectation operator
  • H Hermetian or conjugate transpose
  • X(t 1 )and X(t 2 ) are random variables.
  • a series of steps or a method to achieve an information objective e.g., the identification or location of an abnormal blood flow.
  • a wave whose propagated disturbance is a shear displacement in an elastic medium.
  • a concentrated, unidirectional receiver of sound A concentrated, unidirectional receiver of sound.
  • An algorithm that defines or creates a beam is an algorithm that defines or creates a beam.
  • Beamforming is a search through 3-D or 4-D data space to find the coordinates that yield maximum output at each of a plurality of frequencies.
  • null means zero beamformer response at a specific location or angle. See FIG. 21 .
  • Null space is a vector subspace, if present, of a matrix.
  • Controlling the location of a null in the response of a beamformer See FIG. 22 .
  • the goal may be to place the null at the location or angle where the interfering signal, e.g., a jammer, originates.
  • Means for separating wave forms, including shear waves from compression waves as a function of the respective wave speeds in a medium e.g., human tissue.
  • FIGS. 26A, B and C and FIG. 27 illustrate of a three dimensional regularly spaced grid.
  • a 4D optimal grid A which maintains constant beamwidth resolution throughout the volume with a minimum number of points and therefore a minimum amount of computational effort. See FIGS. 28A, 28 B, 28 C and 29 .
  • Each of these figures represents a projection of a four dimensional grid into a three dimensional space.
  • the four dimension is wave speed.
  • Each of the points which can be seen in the three dimensional space of the figures exists at several different speeds. These speeds are spaced according to the beamformer's beamwidth in c (speed) at that point in four space.
  • Analytic photogrammetry refers to the analytic mathematical techniques that permit the inference of geometric relations between points and lines in the two-dimensional perspective projection image space and the three-dimensional object space.
  • Digital photogrammetry refers to the computer processing of perspective projection digital images with analytic photogrammetry techniques as well as other computer techniques for the automatic interpretation of scene or image content.
  • Extraction includes the steps of assembling the features into a vector and assembling multiple observations of the feature vector into a feature matrix.
  • FIG. 1 is a front and side view of one form of a clinical workstation including an acoustic imaging system of the invention.
  • FIG. 2A is a view of a second form of a clinical workstation having a contracted extendable arm support for two cameras to locate sensors by photogrammetry.
  • FIG. 2B is a view of the FIG. 2A form of the clinical workstation in which the arm for supporting cameras is shown extended.
  • FIG. 3 is a schematic that depicts one form of a prior art piezoelectric film sensor useful in the invention.
  • FIG. 3 is a reproduction of FIG. 1 of U.S. Pat. No. 5,365,937.
  • FIG. 4 illustrates a portion of the top surface of the sensor diaphragm of the FIG. 3 sensor.
  • FIG. 4 is a reproduction of FIG. 2 of U.S. Pat. 5,365,937.
  • FIG. 5 depicts a five element preselected sensor array fixed in a device or pod positioned on the chest of a patient.
  • FIG. 6 illustrates a prior art nine sensor array with sensors positioned in two concentric circles. Sensors 1 - 5 are positioned in an outer circle, sensors 6 - 8 are positioned in a second circle and sensor 9 is positioned in the center of both circles.
  • FIG. 7 is a schematic block diagram that depicts an arrangement of the components of one form of the acoustic imaging system of the invention.
  • FIG. 8 is schematic block diagram that depicts an arrangement of the components of the clinical workstation of the invention.
  • FIG. 9 is a schematic block diagram that depicts elements of the analog sub-system block of FIG. 8 .
  • FIGS. 10 and 11 are circuit diagrams for the digital I/O Board shown in FIG. 9 .
  • FIG. 12 is a plot of the beam steering angle 0 to ⁇ of a normalized conventional beamformer, no null steer as a function of output 0 to 1 from 5 sensors one-half wave length apart. Source at ⁇ /2.
  • FIG. 13 is a plot of the beam steering angle 0 to ⁇ of a normalized conventional beamformer, no null steer as a function of output 0 to 1 from 10 sensors one-half wavelength apart. Source at ⁇ /2; ⁇ /3, 0.75 ⁇ , 0.2 ⁇ , and 0.666 ⁇ .
  • FIG. 14 is a plot of the beam steering angle 0 to ⁇ of an adjustable null space beamformer as a function of output from 0 to 1 from five sensors spaced one-half wavelength apart.
  • GN gain
  • Source at ⁇ /2.
  • FIG. 15 is a plot comparing the beam steering angles of a conventional and an adjustable null space beamformer as a function of output from 0 to 1 from five sensors spaced one-half wavelengths apart at GN 1, 10, 106, 1000 and 10,000.
  • FIG. 16 illustrates a frequency number decomposition with only shear waves present in the form of a 2-D transform F(f,k)
  • FIG. 17 illustrates a frequency number decomposition with compressional and shear waves present in the form of a 2-D transform F(f,k).
  • FIG. 18 illustrates a windowed 2-D transform W(f,k) F(f,k) frequency number decomposition for shear and compressional waves.
  • FIG. 19 is a stacked plot that depicts synthetic waveforms at a linear array with compressional and shear wave arrivals.
  • FIG. 20 is a stacked plot that depicts synthetic waveforms at a linear array with compressional and shear wave arrivals after velocity filtering. Comparison with FIG. 19 demonstrates the absence of compressional waves in FIG. 20 .
  • FIG. 21 is a plot of the beam steering angle 0 to n of a conventional beamformer, no null steer as a function of output from 0 to 1 from a linear array of ten sensors one-half wavelength apart. Source at ⁇ /2. First, second, third and fourth nulls at 0.1, 0.3, 0.7 and 0.9 ⁇ are shown.
  • FIG. 22 is similar to FIG. 21 except that a steered null at 0.6 ⁇ is shown preceding the third null at 0.7 ⁇ .
  • FIG. 23 is a plot of the beam steering angle 0 to ⁇ of an adjustable gain null space beamformer, no null steer, as a function of output from 0 to 1 from ten sensors spaced one-half wavelength apart at five gain levels. Source at ⁇ /2, ⁇ /3, 0.75 ⁇ and 0.666 ⁇ .
  • FIG. 24 is similar to FIG. 23 except that a null steer at ⁇ /2 is shown. This figure illustrates “Option 1” discussed at page 74 of this specification.
  • FIG. 25 is similar to FIG. 24, except that it illustrates “Option 2” discussed at page 76 of this specification.
  • FIG. 26A is an x-y background projection of a regularly spaced 3D grid.
  • FIG. 26B is an x-z depth projection of a regularly spaced 3D grid.
  • FIG. 26C is a y-z depth projection of a regularly spaced 3D grid.
  • FIG. 27 displays the 3D grid points in three dimensions.
  • FIG. 28A is an x-y projection of a 4D optimally spaced grid.
  • FIG. 28B is an x-z depth projection of a 4D optimally spaced grid.
  • FIG. 28C is a y-z depth projection of a 4D optimally spaced grid.
  • FIG. 29 is a 3D projection of the 4D grid onto three dimensions.
  • FIG. 30 is the flow diagram or algorithm that illustrates preprocessing of data for use in the detection of change in coronary artery stenosis.
  • FIG. 31 is a flow diagram that illustrates further processing of the data generated pursuant to FIG. 30 .
  • FIG. 32 is a flow diagram that illustrates the steps of combining select frequency band sensor array data from several channels, measured pre- and post-intervention, into a single signal, broadband feature extraction from the single channel data, classification, and comparison of the extracted pre-and post-intervention feature.
  • FIG. 33 shows spectrograms ambient room noise subtracted that illustrate the human cardiac cycle generated by each sensor of a nine sensor array as generally indicated by FIG. 6 .
  • FIG. 34 is a volumetric image of a computer synthesized dispersive data model with added noise illustrating the origin of an acoustic shear wave.
  • FIG. 35 is a volumetric image of data obtained from an in vitro test in a gelatine chest model with embedded silastic tube at six different tension severities (levels of stenosis), i.e., 25%, 50%, 62%, 76%, 82% and 90%.
  • FIGS. 36A and 36B compare a volumetric acoustic image of a patient with 75% stenotic coronary lesion (FIG. 36A) to the angiographic record (FIG. 36B) of the same spatial location.
  • the acoustic image was obtained by use of the non-invasive in vivo technology of this invention.
  • FIGS. 37A and 37B are volumetric images of a patient with 75% stenotic coronary lesion before (FIG. 37A) and after intervention (FIG. 37 B).
  • FIG. 38 depicts a comparison of acoustic features indicative of patient heart beats pre and post intervention extracted at high and low frequency bands.
  • FIG. 39 illustrates the separation and classification of the pre and post intervention beat features extracted at high and low frequency bands as shown in FIG. 38 .
  • FIG. 40 is a flow chart that illustrates operations of one embodiment of the invention.
  • FIG. 41 is a flow chart or logic diagram that illustrates the parsed data averaging process of block 2006 of FIG. 40 according to one embodiment of the invention.
  • FIG. 42 is a flow chart which illustrates the beamforming operations of block 2008 of FIG. 40 .
  • FIGS. 40, 41 and 42 The operation of the present invention is described herein with reference to flowcharts and block diagrams, FIGS. 40, 41 and 42 .
  • FIG. 40 illustrates operations of one embodiment of the present invention.
  • the relative positions of shear wave sensors are determined (block 2000 ). Such relative locations may be determined by any number of methods including photogrammetry.
  • the acoustic sensors may be any form of sensor suitable for obtaining acoustic information, but are preferably sensors with high sensitivity to shear wave patterns in tissue.
  • acoustic information is acquired from the sensor array (block 2002 ).
  • This acoustic information preferably includes information during the second quarter of the diastolic interval of a patient for which acoustic imaging is desired.
  • Also acquired may be ECG information, ambient noise information, patient noise information breath gating information.
  • the acquired information regarding the sensors, the patient and the ambient conditions may then be used to parse and correct the sensor data (block 2004 ).
  • the parsing of the data preferably includes isolating sensor data corresponding to the time period for the second quarter diastolic interval of the patient. Data may also be discarded if, for example, the presence of ambient noise or patient noise is detected which would adversely impact the sensor data. Thus, for example, if a loud noise is detected or if breathing sounds are detected, the data corresponding to those time periods may be discarded. Alternatively, the sensor data could be corrected for such extraneous noise. In either case, the result of the parsing operation is a series of sensor data synchronized to heartbeats of the patient.
  • the parsed data from multiple heartbeats is then averaged to provide a single set of averaged sensor data (block 2006 ). This averaging is preferably carried out so as to maintain phase information from the sensory array.
  • the averaged data is then beamformed (block 2008 ) and the results of that beamforming are imaged (block 2010 ).
  • FIG. 41 illustrates the averaging process of block 2006 according to one embodiment of the present invention.
  • the sensor data is first windowed (block 2020 ) and an FFT of the windowed data performed (block 2022 ).
  • An interchannel phase difference matrix is then determined for each frequency of interest (block 2024 ).
  • the interchannel phase difference matrix may be determined as described above.
  • the interchannel phase difference matrices are averaged (block 2028 ). This averaging results in a single interchannel phase difference matrix for each frequency of interest.
  • the average interchannel phase difference matrices are then decomposed into their eigen values and eigen vectors (block 2030 ) and utilized in beamforming as described elsewhere herein.
  • an optimal grid 4D beamforming is first obtained (block 2040 ).
  • This optimal grid provides search through a four dimensional volume utilizing the minimum beamformers as is described herein.
  • the grid is determined based on the beamwidth in four dimensions of the beamformer to be used.
  • the optimal grid may be computed for each session or may be precomputed.
  • the 4D grid is then used to beamform through the test volume (block 2042 ), however, the beamforming operation is not a conventional beamforming operation but utilizes a 4D beamformer in x,y,z and c space.
  • This 4D beamforming is accomplished by expanding the optimal grid from 3D to 4D space such that beamforming may cover the desired range of c values with the minimum number of beamformers.
  • the speed of propagation through the patient need not be known but may be obtained from the 4D beamformer output.
  • a new region or regions of interest may be determined based on the results of the first beamforming operation.
  • This new region of interest is preferably regions corresponding to maxima (potential sources) of the first beamforming operation.
  • the region of interest is also preferably a region including one beamwidth from the estimated sources of the first beamforming operation.
  • a new optimal grid is obtained for a higher resolution beamformer, such as an adjustable gain beamformer (block 2046 ).
  • the adjustable gain grid may be precomputed or computed for each use.
  • the adjustable gain grid is also preferably a 4D grid.
  • a 4D adjustable gain beamforming operation is carried out for the new search region (block 2048 ). From this higher resolution beamforming operation a dispersion characteristic is determined (block 2050 ). This dispersion characteristic may be obtained from the beamformer results because the beamformer is a 4D beamformer and, therefore, has available sufficient information to determine speed versus frequency for the region of interest.
  • a subsequent 3D beamforming operation is carried out in the region of interest utilizing a regularly spaced grid (block 2052 ). This subsequent beamforming operation is carried out so as to make imaging easier.
  • each block of the flowchart illustrations, and combinations of blocks in the flowchart illustrations can be implemented by computer program instructions.
  • These program instructions may be provided to a processor to produce a machine, such that the instructions which execute on the processor create means for implementing the functions specified in the flowchart block or blocks.
  • the computer program instructions may be executed by a processor to cause a series of operational steps to be performed by the processor to produce a computer implemented process such that the instructions which execute on the processor provide steps for implementing the functions specified in the flowchart block or blocks.
  • blocks of the flowchart illustration support combinations of means for performing the specified functions, combinations of steps for performing the specified functions and program instruction means for performing the specified functions. It will also be understood that each block of the flowchart illustrations and combinations of blocks in the flowchart illustrations, can be implemented by special purpose hardware-based systems which perform the specified functions or steps, or combinations of special purpose hardware and computer instructions.
  • a specific aspect of the invention provides instrumentation and methodologies for detecting coronary artery stenosis change following successful percutaneous intervention. This aspect of the invention permits serial noninvasive post intervention assessments of a stenotic lesion.
  • FIG. 1 illustrates a preferred clinical workstation configuration 110 which may include a computer monitor 111 , a keyboard 112 , five soft switches 113 and one rotary push dial 114 to permit an operator to enter patient information, control the system operations and select and review the data displayed.
  • the rotating push dial 114 has no physical stop points. It will transmit LEFT, RIGHT and PUSHED, RELEASED status information.
  • Each of the soft switches 113 is a two-state (ON-OFF) device.
  • the software interface to the soft switch panel occurs through low-level drivers (not shown) that communicate directly with the workstation 110 .
  • the data may be stored on a removable storage device (not shown) and printed on a graphics printer (not shown).
  • the preferred operating system is a 32-bit Microsoft NT workstation version 4.0 or higher.
  • FIGS. 2A and 2B are schematics that show a form of the workstation 110 having a fold-away extension arm 115 to support two cameras for the location of sensors by photogrammetry.
  • a support member 116 for the extension arm 115 is stored in the cabinet of the workstation 110 when the arm is not extended.
  • the extendable arm 115 includes three elements 117 , 118 and 119 .
  • Element 117 is pivotably connected to the support 116 at one end and to the element 118 at the other end.
  • the terminal element 119 is pivotably connected at the distal end to the element 118 .
  • the element 119 has arms 120 foldable into recess 121 in the element 119 .
  • Each of the distal ends of the foldable arms 120 includes means 122 for the attachment of cameras to permit photogrammetric determination of sensor positions.
  • the acoustic imaging system processes signals transmitted by a plurality of acoustic sensors positioned in an array on or adjacent a patient's body surface to detect or localize abnormal blood flow.
  • the sensors measure body surface response to abnormal blood flow sound signals.
  • An electrical signal of broad frequency response, high sensitivity, and high signal to noise ratio (S/N) is provided.
  • An ECG monitor signal may also be included to provide a reference for the cardiac cycle.
  • the sensors may be charge or voltage mode accelerometers or piezo film transducers. Sensors having substantially the performance characteristics set forth in Table 1 are preferred. However, other suitable sensors may be used.
  • Preferred individual sensors comprise a stretched piezoelectric film transducer.
  • the transducer is a stretched polyvinylidene fluoride film.
  • FIGS. 3 and 4 are reproductions of FIGS. 1 and 2 of U.S. Pat. No. 5,365,937 with the associated element numerals.
  • the sensor dimension width is less than one-half wavelength for the wavelengths (frequencies) of interest. This requirement provides a sensor dimension of less than one (1.0) centimeter in the direction of interest.
  • the best mode includes contact pressure on the face of the sensor effective to cause a static deflection of the film of about one millimeter.
  • the best mode further entails use of multiples of such sensors in an array configuration of nine or more elements or use of a preferred array configuration to enhance performance, the configuration including: (i) no three elements are along the same straight line (non-colinear); (ii) all elements are along the same straight line (colinear); or (iii) use of sub-arrays, in which the total number of sensors in an array is made up by use of a plurality of smaller arrays or pods.
  • FIG. 5 illustrates a device 130 in which five sensors 131 (one of five sensors) are fixed in a preselected array in a device placed on the chest of the patient.
  • the array includes a centrally positioned sensor 132 and four sensors illustrated generally by the single sensor 131 spaced from the central sensor 132 .
  • the device 130 is operatively connected to a prototype acoustic imaging system of the invention including a computer monitor 133 and keyboard 134 .
  • FIG. 6 Another useful prior art nine sensor array 140 as shown by FIG. 6 comprises eight equally spaced sensors in concentric circles 141 , 142 having prime numbers of sensors in each circle. Specifically, five sensors are shown in circle 141 and three sensors are shown in circle 142 . A ninth sensor is at the center of the circles. In FIG. 6 “R” means the radius of the relevant circle. Alternatively, the sensors may be positioned in a linear array.
  • An embodiment of the invention is a clinical workstation having an acoustic imaging system.
  • the acoustic imaging system may amplify the signals from the sensors, convert the sensor data from analog to digital format and may store the information and process the data to enhance vascular sounds and display the information to the operator.
  • FIGS. 7, 8 and 9 show only those specific details that are pertinent to the present invention.
  • the block diagrams are used to avoid obscuring the disclosure with details readily apparent to those skilled in the art.
  • the block diagram illustrations and the image processing diagrams of the figures are primarily intended to illustrate the major components of the system in a convenient functional grouping.
  • the MUX box may include a standard channel to channel multiplexer.
  • the ECG sensor interface may be an analog interface circuit suitable for the industry standard ECG sensor (three sensor inputs: plus, minus, ground) with one output.
  • the output of the ECG sensor interface is provided as a channel input to the multiplexer such that when selected, the ECG sensor output may be converted by the analog to digital converter from an analog signal to a digital signal.
  • respiration sensor input is provided to a breath gating circuit which may be used to synchronize acquisition of acoustic and ECG data.
  • the control logic may include circuitry for (i) gain control (four stages), (ii) filter control (four stages), and (iii) calibration control (on/off). As is also illustrated in FIG. 7, additional channels may be provided to the multiplexer for input such as background noise or other analog inputs.
  • an analog interface circuit selectively receives input from the acoustic sensors and from a calibration test input.
  • the interface circuit provides the information to a filter which may be multiple pole high pass filter such as a Butterworth or other suitable filter.
  • the output of the filter is amplified by amplifier and provided to an anti-alias filter which provides its output to a sample and hold circuit.
  • the output of the sample and hold circuit is then provided to a channel to channel multiplexer the output of which is provided to an analog to digital converter.
  • the output of the analog to digital converter is buffered and provided to a digital I/O board resident in the computer so as to allow for transmission of the digital data from the analog sub-system to the computer.
  • the FIG. 8 sensor locating sub-system supplies data to the computer to locate the center point of each of the acoustic sensors preferably to within ⁇ 1 mm in x, y, and z axes relative to one of the sensors designated as a reference point. This is preferably done automatically after the sensors have been placed on the patient's body surface and just before data acquisition.
  • This sub-system may provide 16-bit A/D readings to the system. The reading will represent the acoustical and any ambient sensors (not shown) as well as feed back from the ECG leads.
  • the software interface of this sub-system may be through low level device drivers (not shown) that communicate directly with the acoustic imaging device.
  • the workstation of FIG. 8 also includes an analog sub-system which receives the output of the acoustic sensors, the ECG sensors and the respiration sensor.
  • the analog sub-system may process this information in analog format and provide the results to the personal computer or other data processing system.
  • the analog sub-system shown in FIG. 8 includes a digital I/O interface on the board to reduce noise.
  • the digital I/O board may be a PC-DIO-24 board available from National Instruments Corporation, 6504 Bridge Point Parkway, Austin, Tex. 78730 or the STUDI/O board available from Sonorus, 111 East 12th Street, New York, N.Y. 10003.
  • the power sub-system illustrated in FIG. 8 may provide power to each of the components of the workstation. Also shown in FIG. 8 are a CRT display and optional printer for providing output to a user. Input devices such as a keyboard, rotary dial and soft switches may also be provided for receiving input from a user. A removable media file or other storage device may be utilized by the personal computer to store data as well as transfer data to other workstations.
  • the FIG. 8 power sub-system may be industry standard. Appropriate input power characteristics are:
  • the computer including the CRT display and keyboard, preferably is an industry standard, e.g., IBM PC 365, Dell Optiplex GX Pro, Compaq, Desk Pro 6000.
  • FIG. 9 illustrates the interconnection of the external sensors, the analog subsystem, the power supply for the analog subsystem and the digital I/O board.
  • the sensors may be connected to the analog subsystem by a an external cable.
  • the analog sub-system which may output digital data representative of the analog information presented to the analog sub-system, may be separate from the computer system and may be connected by an external cable to the digital I/O board in the computer which provides access to the data by the processor of the computer.
  • the analog sub-system may be incorporated in a computer or processing system utilized in a workstation according to the present invention.
  • the analog to digital board shown in FIG. 9 preferably has the characteristics set forth in Table 2:
  • FIGS. 10 and 11 are circuit diagrams for the digital I/O Board shown in FIGS. 8 and 9.
  • FIG. 10 depicts one of the 32 analog channels that condition the array signals prior to digital conversion.
  • FIG. 11 shows the termination of each of these analog channels as input along the top of the figure as ‘ANAxx’, into sample-and-hold buffers.
  • FIG. 11 are the seven digital input “data request” lines 11 A from the FIG. 8 computer.
  • the analog data from each channel is routed from the sample-and-hold buffer to the analog-to-digital converter (A/D Converter of ADC), which is the large chip 113 at the bottom center of FIG. 11 .
  • A/D Converter of ADC analog-to-digital converter
  • the final two chips 11 C and 11 D at bottom right of FIG. 11 are digital buffers for output to the PC.
  • the power switch (not shown) is located on the front of the Clinical Workstation along with a light (color as required by standards) to indicate that the unit is turned on.
  • the power switch turns on/off the entire system. It may be covered or recessed to prevent inadvertent operation.
  • the system may execute a self-test each time it is powered on. The self-test sequence completes with an indication that the system is ready to use.
  • User controls may include a computer keyboard, rotary dial with push button action and “soft keys” that can be “labeled” by information on the display screen.
  • the user access may be limited to only the menus and modes of operation that are part of the acoustic imaging system operation. Except in special modes that are restricted to authorized persons, the operator may not be able to access the operating system, alter system files or perform any other computer operations.
  • Patient information such as name, ID number, date of birth, study number, referring physician's name and user's name, is entered. Additionally, a fixed length comment can be provided. All of the entered information appears on the screen to be verified by the user.
  • the acoustic imaging system software may provide a template to guide the operator through the process of entering patient information. These templates may be field adjustable for each institution.
  • This step requires positioning the patient, preparing the chest or other body surface, placing the sensor array and connecting the ECG leads, and verifying the signals.
  • the patient may be instructed on protocols for breathing during the test, including exhaling and holding their breath in cooperation with the operator.
  • the operator may have the capability to enter an acquisition comment such as the reason for the test (pre-intervention, post-intervention, office exam, etc.).
  • the system may record the time and date of each acquisition automatically.
  • the instrument may provide feedback to guide the operator in each step, such as determining sensor array placement, indicators for sensor contact, and gain settings.
  • Preferred embodiments may provide real-time feedback for the operator during the data acquisition interval to ensure proper system function.
  • the instrument may store acquired data over a defined interval, e.g., a 30-second to 15-minute interval. Any aberrant system condition is also stored.
  • the data stored may contain a record which can be mapped to the system's time base.
  • the instrument preferably includes means to internally retain patient records.
  • the system may maintain a master log of summary information (date, time, patient identification, operator identification of all tests run and all error conditions) in a file that is password protected and can be accessed, copied and deleted only by authorized persons.
  • the workstation may apply a fast executing (less than three minutes) algorithm which demonstrates the integrity of the collected signal.
  • the system may automatically process patient data in the order collected unless prioritized by the operator.
  • the workstation may execute the analysis based on a predefined protocol, providing a graphical progress (completion time) indicator while the processing is underway.
  • a copy of the patient's record may be archived to a removable storage medium by the operator, and the software may mark that record as archived.
  • the system may indicate if the storage medium is full and also warn the operator of an attempt to delete a record that has not been previously archived.
  • the workstation may provide the capacity to display and interact with the data in the following ways, among others:
  • Print the images including patient information (system option).
  • the invention includes a novel adjustable gain/resolution beamformer to provide a more focused beam steering angle.
  • Vector formulation and matrix formulation are the two main types of procedures applicable to image flows using conventional beamformers in visco-elastic media. Both types of procedures may be used to implement a Bartlett beamformer. Vector formulation may also be used to implement a simple advance and sum beamformer.
  • the given dispersion relation (frequency/velocity relationship) and the array geometry are used to compute a set of inverse path models at each location in three dimensional space.
  • the origin and orientation of the coordinate system used is arbitrary.
  • the coordinate system is normalized to be a right handed coordinate system with the location of the receiver closest to the center of the array used as the origin and with the positive x axis in the direction of the patients head and the positive z axis into the body.
  • IPM ⁇ ( ⁇ ⁇ x ⁇ ⁇ ) [ ⁇ I start_freq ⁇ _bin , 1 ⁇ ( x ⁇ , ⁇ ) ⁇ I start_freq ⁇ _bin , num_receivers ⁇ ( x ⁇ , ⁇ ) ⁇ ⁇ ⁇ I end_freq ⁇ _bin , 1 ⁇ ( x ⁇ , ⁇ ) ⁇ I end_freq ⁇ _bin , num_receivers ⁇ ( x ⁇ , ) ]
  • ⁇ : I bin , rec ⁇ ( x ⁇ , ⁇ ) cos ⁇ ⁇ ( ⁇ x ⁇ - r ⁇ rec ⁇ ⁇ ⁇ ⁇ c ⁇ ( ⁇ ) ) + i ⁇ sin ⁇ ⁇ ( ⁇ x ⁇ - r
  • C( ⁇ ) is the dispersion relationship
  • ⁇ right arrow over (r) ⁇ rec is the position of a particular receiver.
  • the beamformer output is computed by summing the scalar product of the ensemble averaged receiver signals matrix and the inverse path model matrix across channels thereby producing a row vector with as many complex elements as there were frequency bins. The complex magnitude of the elements is then summed across frequency bins yielding the beamformer output at the specified location. This is shown by Equation 4. First compute the scalar product of the inverse path model and the signal matrix:
  • IPM in Equation 2 becomes a function of both position and speed.
  • IPM is a function of speed as well as position:
  • R M ⁇ ( ⁇ ) [ B 1 , 1 ⁇ B 1 , num_receivers ⁇ ⁇ ⁇ B num_receivers , 1 ⁇ B num_receivers , ⁇ num_receivers ]
  • the matrix formulated must have inverse path model information.
  • the inverse path model information is contained in steering vectors. Steering vectors are computed for each frequency and position in three dimensional space just as the inverse path models were in the vector formulation. However, steering vectors are computed across channels whereas the inverse path models in the vector formulation were computed across frequencies. The difference is merely a matter of when the values are computed and how they are organized. The actual value for any given position, array geometry, speed, and frequency are the same in either formulation. Equation 8 shows this different arrangement:
  • I n ⁇ ( x ⁇ , ⁇ ) cos ⁇ ⁇ ( ⁇ x ⁇ - r ⁇ n ⁇ ⁇ ⁇ ⁇ c ⁇ ( ⁇ ) ) + i ⁇ sin ⁇ ⁇ ( ⁇ x ⁇ - r ⁇ n ⁇ ⁇ ⁇ c ⁇ ( ⁇ ) )
  • speed (c) becomes fourth dimensional as shown below by Equation 10:
  • Either vector or matrix formulation beamforming may be used according to the present invention.
  • Vector formulation requires fewer operations and is preferred.
  • To compute the same frequency in using the matrix formulation requires one hundred ninety nine floating point operations (FLOPS).
  • FLOPS floating point operations
  • the FLOPS go up linearly with the number of array elements.
  • the number of FLOPS goes up as the square of the number of array elements.
  • FIGS. 12 and 13 are plots of a normalized conventional beamformer steering angle, at indicated source locations, as a function of the output from 0 to 1 of five (FIG. 12) and 10 (FIG. 13) sensors spaced one-half wave length apart. As FIGS. 12 and 13 indicate, conventional beamformers provide a relatively wide beam or broadly focused steering angle.
  • Adjustable gain resolution null space beamformer beam steering angles are more focused or acute. See the FIG. 14 plot of the beam steering angle of an adjustable null space beamformer and the FIG. 15 comparison of the beam steering angle of a conventional and adjustable beamformer.
  • One set of operations using an adjustable gain/resolution null space beamformer to acquire and process abnormal blood flow noise and image turbulent blood flow may include:
  • the uniformly spaced three dimensional grid is generated by evenly dividing a three dimensional region of space into Nx, Ny, and Nz points along and perpendicular to the Cartesian axes X, Y and Z respectively.
  • This space has dimensions in X, Y and Z of delx, dely, and delz, respectively and is offset below the array by a vector O.
  • O By varying O, delx, dely and delz, the size, shape and location of the volume of interest and the density of points in physical space can be adjusted.
  • FIGS. 2A and 2B depict means 120 and 122 for mounting two charge coupled device (CCD) cameras.
  • CCD charge coupled device
  • the cameras are rigidly mounted 18 inches apart with a convergence angle of 45 degrees. The spacing of the cameras and the convergence angle may be varied by the operator. Images of the sensor array are simultaneously acquired by each camera, processed, and analyzed to provide an n-by-3 matrix of sensor positions on the patient's chest.
  • Retro-reflective tape is affixed to the sensor tops and illuminated with infrared (IR) light emitting diodes (LEDs) mounted around each camera's lens.
  • IR infrared
  • LEDs light emitting diodes
  • an infrared filter is mounted in front of the camera lens. The filter allows the reflected IR light to pass through to the camera sensor while reducing the amount of visible light entering the lens.
  • features corresponding to sensors in each image are analyzed using a connected component labeling algorithm. See Connected Component Labeling”, Haralick, Robert M. and Shapiro, Linda G., Computer and Robot Vision , Addison-Wesley Publishing Co., New York, N.Y., pp. 31-40. From the labeled image, the area, first moments, and second moments are derived for each connected component. Sensor feature area and first moments are used to determine location. The sensor feature area and second moments are used to determine orientation. After the position of each sensor feature has been determined, correspondence between said features in each image is established.
  • z 1 - b ⁇ ( x r ′ f r ⁇ sin ⁇ ⁇ ⁇ + cos ⁇ ⁇ ⁇ ) ( x r ′ f r - x 1 ′ f 1 ) ⁇ cos ⁇ ⁇ ⁇ - ( 1 + x r ′ ⁇ x 1 ′ f r ⁇ f 1 ⁇ sin ⁇ ⁇ ⁇ )
  • X′ i is the x-coordinate in the left image
  • x′ r is the
  • y′ i is the x-coordinate in the left image
  • y′ r is the
  • X t is the x-coordinate of the sensor
  • y t is the y-coordinate of the sensor
  • ⁇ i is the left focal length
  • ⁇ r is the right focal length
  • b is the distance between cameras
  • is the convergence angle, and ⁇ is ⁇ /2.
  • each sensor top is assumed to be circular
  • the image of each sensor is an ellipse. Using the position of the ellipse, the orientation and the area, sensor positions on the patient's body surface are determined.
  • step (5) Parsing the concurrently acquired step (5) data into three time periods, i.e., S 1 and S 2 heart sounds and a quiet interval where blood flow through the artery is at its peak.
  • the phase angle shift may be determined from a priori knowledge of shear wave speed in the body as a function of the frequency. See, Verburg, J., Transmission of Vibrations of the Heart to the Chest Wall. Advanced Cardiovascular Physics, Vol. 5 (Part III), pp. 84-103 (1983).
  • phase angle shift may be determined de novo by methods such as those described in Oestreicher, H. L., Field and timpedance of an Oscillating Sphere in a Viscoelastic Medium with an Application to Biophysics, J. Acoust. Soc. Am . (1951) 23:707-714; von Glerke, H., et al., Physics of Vibrations in Living Tissues, J. Appld. Physiology (1952), 886-900.
  • phase angle shift determined in step (7) is assigned a complex weight of magnitude one.
  • the inverse path model matrix comprises a plurality of steering vectors in which
  • each vector is composed of the scalar inverse path models from each sensor to a grid point
  • the number of vectors in the matrix is the number of interior points on the 3-D grid of step (3).
  • Interchannel phase difference matrices are formed at each frequency by creating a vector v, of the complex FFT outputs across all channels at that particular frequency.
  • the entire vector (each element) is divided by the element which is being used as the reference channel, v o .
  • the selection of the reference channel is made easier by choosing the channel which has the highest variance. Choosing the channel with the highest variance and therefore the highest combined signal and noise increases the likelihood that the reference channel is the channel with the highest signal to noise ratio.
  • all phase values represent the interchannel phase difference between each channel and the reference channel.
  • V icd ( ⁇ ) V icd *V icd
  • V ref ( ⁇ ) is the scalar complex value of the reference channel FFT
  • V icd ( ⁇ ) is the interchannel difference matrix at this frequency.
  • step (12) Decomposing the step (11) interchannel phase different R matrix into its eigenvalues and eigenvectors. This step is accomplished in known manner. See, e.g., Galoub and Van Loan, Matrix Computations (1989), Johns Hopkins University Press.
  • R ⁇ v 11 v 12 v 13 v 21 v 22 v 23 v 31 v 32 v 33 ⁇ H ⁇ ⁇ ⁇ 1 0 0 0 ⁇ 2 0 0 0 ⁇ 3 ⁇ ⁇ ⁇ ⁇ v 11 v 12 v 13 v 21 v 22 v 23 v 31 v 32 v 33 ⁇
  • R - 1 ⁇ v 11 v 12 v 13 v 21 v 22 v 23 v 31 v 32 v 33 ⁇ ⁇ ⁇ 1 ⁇ 1 0 0 0 1 ⁇ 2 0 0 0 1 ⁇ 3 ⁇ ⁇ ⁇ ⁇ v 11 v 12 v 13 v 21 v 22 v 23 v 31 v 32 v 33 ⁇ H
  • R - 1 ⁇ v 11 v 21 v 31 ⁇ ⁇ ⁇ 1 ⁇ 1 ⁇ ⁇ ⁇ ⁇ v 11 v 21 v 31 ⁇ H + GN ⁇ ⁇ ⁇ V 12 v 13 v 22 v 23 v 32 v 33 ⁇ ⁇ ⁇ 1 0 0 1 ⁇ ⁇ ⁇ ⁇ V 12 v 13 v 22 v 23 v 32 v 33 ⁇ H
  • GN is an arbitrary number that controls the effect of the null space on the inverse.
  • the two parts to the inverse can be defined for a N ⁇ N matrix with k dominant eigenvalues. See equations 22 and 23.
  • R S ⁇ ev 1 ⁇ ev k ⁇ ⁇ ⁇ 1 ⁇ 1 0 0 0 O 0 0 0 1 ⁇ 3 ⁇ ⁇ ⁇ ev 1 ⁇ ev k ⁇ H
  • R N ⁇ ev k + 1 ⁇ ev n ⁇ ⁇ ⁇ 1 0 0 0 O 0 0 0 1 ⁇ ⁇ ⁇ ev k + 1 ⁇ ev n ⁇ H
  • step (14) The value of the step (14) beamformer output is associated with the 3-D location and the results displayed with a volumetric imager.
  • volumetric imager Any commercially available volumetric imager may be used.
  • step (15) Inspecting the step (15) image to determine the need for compression energy suppression. Absent such need, the image is complete.
  • acoustic images of turbulent blood flow signals may be enhanced by elimination or reduction of the effects of compressional waves relative to shear waves or any other waves arriving at the sensor array.
  • Compression energy may be suppressed by velocity filtering which does not require a priori knowledge of shear to compression energy ratio or by steering a null at the compression wave component of the signal detected by the sensor array which does require such a priori knowledge.
  • Velocity filtering exploits the differences in apparent wave speeds between the compression waves and other waves including shear waves moving more slowly across the array sensors. Velocity filtering does so by filtering the signals so that waves of very high apparent wave speeds are eliminated by the filter and slower moving waves are allowed to pass through.
  • FIGS. 16 and 17 magnitude plots of the function 101 og 10 show another important property of the transformed data.
  • the dispersion relations that govern the propagation of compressional and shear waves appear as different features of the f-k plane. More specifically, FIG. 16 illustrates frequency-wave number decomposition with only shear waves present. FIG. 17 illustrates frequency-wave number decomposition with compressional and shear waves. A band of energy 143 received at an array is shown.
  • the function f(n,m) used to generate the FIG. 16 image is synthesized by propagating an artificial source to the elements of a linear array. The artificial source contains only a shear component. Shear wave dispersion is illustrated at 144 .
  • FIG. 16 f(n,m) function used to generate the FIG. 17 image is synthesized using an artificial source with shear and compressional waves. Superimposed on both images (FIGS. 16 and 17) is the dispersion curve 145 for shear waves predicted by Verburg, J.: Transmission of Vibrations of the Heat to the Chest Wall . Advanced Cardiovascular Physics, (1983) 5(Part III):84-103.
  • FIGS. 16 and 17 show, the different waves produce distinct linear features in the f-k plane.
  • the slope of a line in the f-k plane has dimensions of velocity. The steeper the slope, the higher the wave speed. Curved lines correspond to dispersive waves since the velocity changes with frequency. Note that the shear wave speed increases with frequency as predicted by Verburg's curve.
  • the compressional wave dispersion feature is illustrated at 146 (FIG. 17 ). This feature is vertical, corresponding to a nearly infinite apparent wave speed across the array. This is the energy to be filtered out.
  • W ⁇ ( u , v ) ⁇ 0 for ⁇ ⁇ v ⁇ [ M - 1 2 - P , M - 1 2 + P ] , ⁇ u 1 otherwise
  • FIG. 18 illustrates frequency-wave number decomposition with window applied as an example of the product W(u,v)F(u,v) for shear and compressional waves.
  • FIGS. 19 and 20 are stack plots of the signals recorded at each sensor position as a function of time and distance along the array and therefore show the effect on the time series of the velocity filtering.
  • FIG. 19 the compressional arrivals 148 and shear arrivals 149 can be seen clearly.
  • the compressional wave arrives at each sensor on the linear array at virtually the same time.
  • the shear waves are slower and dispersive.
  • FIG. 20 is a stack plot of the signals after velocity filtering. The elimination by velocity filtering of the compressional waves from the time series is shown at 150 .
  • FIG. 20 shows that the shear wave arrivals at 151 are not affected by elimination of velocity filter.
  • the discrete Fourier transform requires uniformly spaced samples. Because the sensor data f(n,m), from the array are not uniformly sampled in the spatial dimension, the data are spatially interpolated onto a regularly spaced axis. To accomplish this, advantage is taken of the fact that the two-dimensional discrete Fourier transform may be computed by two one-dimensional transforms.
  • a beamformer null exists when the response at a specific location or angle goes to zero. See FIG. 21 which illustrates four labeled nulls in a conventional beamformer beam steering angle under the conditions identified in FIG. 15 .
  • the sensors are in a linear array. Four nulls appear in the response of the beamformer. There are potentially nine null locations. The five null locations not shown are outside the space spanned by the steering vectors for plane waves. The four nulls that appear in this response are not controlled in their locations but appear spontaneously.
  • the invention may include a “null steering” operation to place a null at the location or angle where an interfering signal originates.
  • FIG. 22 illustrates a steered null of 0.6 ⁇ under the same conditions as described and illustrated by FIG. 21 .
  • FIG. 23 is a plot of the beam steering angle, 0 to ⁇ of an adjustable null space beamformer at five gain values as set forth.
  • Two options are available for steering a null at the compression wave component of the signal detected by the sensor array.
  • the two options require a priori knowledge of the shear to compression energy ratio.
  • P SH P COM The ratio of shear to compression power at the source location.
  • GN, R S , R N and B output in power .
  • the first term of the relationship is the previously described beamformer that has only positive values.
  • the second term has value of zero when the first term approaches 1 and a value of ⁇ 1 when compressive steering vector is pointing at a compressive source.
  • the beamformer, described in option 1 is modified by a different second term that produces a null in the response.
  • This different second term does not use the R matrix regardless of how it is generated. Instead, a new second matrix is formed:
  • R COM Correlation matrix for compressive waves.
  • the inverse of this matrix can be expressed in two parts as before by performing an eigenvalue decomposition of the matrix.
  • R ⁇ 1 COM R CS +R CN
  • R CS The inverse rank space of R COM which has only one
  • R CN The inverse null space of R COM .
  • GN SH Gain Null Space Shear Waves
  • the eigenvector associated with the non-zero eigenvalue is a scaled version of the original S COM vector.
  • the problem of finding a set of vectors orthogonal to the first vector S COM can be done by the Modified Gram-Schmidt algorithm [Matrix Computations, Goloub and Van Loan Sec. 6.2] which is faster than finding the eigenvalues and eigenvectors of a matrix. This leads to a new version of option 2.
  • the Modified Gram-Schmidt algorithm is listed in Appendix A.
  • the output of this algorithm is a new matrix and from this and the two parts of the inverse of R, the beamformer output can be found by the second algorithm described in Appendix B.
  • FIGS. 26A, 26 B and 26 C are the projections of the 3D grid.
  • FIG. 27 displays the grid points in three dimensions.
  • FIG. 28 and FIG. 29 are examples of the 4D optimal grid which maintains constant beamwidth resolution throughout the volume with a minimum number of points and therefore a minimum amount of computational effort.
  • FIGS. 28A, B and C are the set of orthogonal projections and FIG. 29 is the 3D projection of the four dimensional grid onto three dimensions.
  • Beamforming can be thought of as a search through data space to find the (x, y, z) coordinates that give the maximum output at each frequency. If the velocity of propagation is unknown, it becomes the fourth unknown “c” in the search. To do this search efficiently, an optimal grid having the minimum number of points that need be tested (beamform to) in the volume should be used.
  • An algorithm useful to generate an optimal grid may include:
  • This 4-D grid is the optimum solution for finding a potential source of unknown location where the potential locations of the source are uniformly dispersed throughout the volume.
  • the use of this grid minimizes the computational effort required to find a source and its associated position in 4 space.
  • a true source location will generate maximal output in the beamformer for the correct values of [x y z c].
  • a conventional beamformer algorithm as described may be used initially to search the four dimensional space for a source.
  • Newton's method can be used.
  • the needed partial derivatives can be estimated with finite differences.
  • the object is to find a point where the gradient is zero and the Hessian matrix of partial derivatives has all negative eigenvalues indicating the location is on a peak.
  • 3-D visualization methods are usually designed to work on uniformly gridded data.
  • each point and frequency can have nearly the same resolution by changing GN to give the same beam widths at different locations within the grid.
  • change in CAD status may be determined by comparison of acoustic images or measurements made at different times.
  • This aspect of the invention may proceed in three steps in which pre-and post-intervention acoustic data in separate channels from a plurality of sensors, e.g., nine sensors, is preprocessed and quality screened, see FIGS. 30 and 31.
  • the preprocessed channel data undergoes further signal processing to extract and classify pre- and post-intervention energy features, and the extracted and classified features are compared to identify post-intervention change in a stenotic lesion. See FIGS. 31 and 32.
  • FIG. 30 illustrates a preprocessing phase in which acoustic data is separately generated by an array of acoustic sensors.
  • the block 1000 indicates nine channels of data from a nine sensor array as shown by FIG. 6 .
  • the array may comprise any desired number of sensors.
  • the acoustic sensor data is calibrated at block 1001 and subjected to heart beat parsing concurrently with EGC data at block 1002 .
  • the parsed acoustic sensor data and EGC data is subjected at block 1003 to visual inspection of the signal corresponding to each heart beat to detect abnormalities such as interference from transient noises or breath sounds.
  • the acoustic sensor data calibrated at block 1001 is also bandpass filtered at block 1004 and subjected to aural screening at block 1005 .
  • the visually screened data from block 1003 and the aurally screened data from block 1005 is accepted or rejected on a per beat basis at block 1006 based on the usual inspection and aural screening.
  • the final screening process at block 1006 compares the analysis window for each beat that passed visual inspection at block 1003 with the segments identified by aural inspection at block 1005 as containing interfering noise. If these analysis windows overlap, the analysis window for that beat is rejected from further processing. Typically all channels for a beat will be accepted or rejected together.
  • the data passes both the aural screening and the visual inspection, then the data is provided as preliminary processed signals for further evaluation as is seen in FIG. 31 .
  • the screened beats produced at block 1006 comprise pre-intervention beats, nine channels per beat and post-intervention beats, nine channels per beat.
  • the screened, pre-intervention beat data is subjected to band-limited cross-correlation at block 1007 .
  • the signal generated at block 1007 is further processed as shown. Specifically, the block 1007 signal is assigned optimal lags at box 1008 and optimal weights at block 1009 .
  • All of the nine pre-intervention signal channels with the optimal lags from box 1008 are time aligned at block 1010 and at block 1111 with the nine channels of post intervention beat data.
  • the optimally weighted block 1009 pre-intervention beat data is combined at block 1112 (x) with the time aligned data from block 1110 and summed at block 1113 .
  • the data from block 1111 which comprises time aligned optimally lagged pre-intervention data and post-intervention beat data is combined at block 1114 with the optimally weighted block 1009 pre-intervention beat data and summed at block 1115 .
  • FIG. 32 illustrates one method for comparing pre-intervention with post-intervention data features to identify changes in the degree or extent of a coronary artery stentoci lesion.
  • blocks 1000 indicate nine channels of acoustic sensor array data.
  • Blocks 1020 indicate data preprocessing as shown by FIGS. 30 and 31.
  • Block 1021 illustrates use of a time domain beamformer to convert the nine beat channels to one channel.
  • the single channel per beat output of blocks 1021 is subjected to broadband frequency feature extraction at blocks 1022 .
  • One energy feature is extracted at a first low frequency, e.g., 200 to 600 Hz and at a second higher frequency, e.g., 600-1800 Hz.
  • the extracted features are classified per beat into a pre-intervention subclass and a post intervention subclass.
  • Any classifier means may be used.
  • An optimal linear classifier is preferred.
  • the pre-intervention feature data subclass and the post-intervention feature data subclass are averaged across beats at blocks 1024 .
  • the averages are compared at block 1025 .
  • the comparison is accomplished by plots which separate the number of pre-intervention and post-intervention beats at the high and low frequencies used for feature extraction and by plots of classified pre-and post-intervention beat data. See FIGS. 38 and 39 discussed in Example 6, infra.
  • a difference between the averaged pre-intervention and post-intervention classifier outputs indicates a stenosis change in a coronary artery of the patient.
  • coronary artery stenosis change may be tracked prior to or post intervention by a comparison of time series of acoustic images produced as described before or after intervention.
  • the invention also provides standard or a plurality of standard plots typified generally by FIGS. 38 and 39 for use in making diagnostic comparisons of stenotic lesion change with time.
  • a specific aspect of the invention comprises any plot of the number of beats of a patient's heart at a first time and at a second time against a high frequency feature and a low frequency feature and any plot of a beat classifier output against heart beat numbers before and after percutaneous intervention.
  • This invention may be used to detect change in coronary artery stenosis after any type of percutaneous revascularization.
  • Algorithms for data acquisition and preliminary data processing, according to one embodiment of the present invention, shown in FIG. 30 may comprise:
  • the data pre-processing may involve calibrating the sensor output for each channel. These calibrated outputs are bandpass filtered and then screened for aural abnormalities, such as the presence of background noise, etc.
  • the calibrated outputs may also be synchronized with ECG data from a patient so as to window the data for the maximum blood flow period. This windowed data may then be visually inspected for each beat to detect abnormalities in the data, such as breath sounds or the like. For example, analysis windows (85 msec in mid-diastole of each beat identified by parsing algorithm) are visually inspected and are accepted unless there exists visually apparent interference from transients, breath sounds or other heart sounds such as S 3 or S 4 .
  • Aural screening of the recorded acoustic data identifies segments of interference from undesired noises including breath sounds, cable noises, bowel sounds, room noises, speech and various transients. Data may be accepted or rejected on a per beat basis based on the aural screening and visual inspection.
  • a non-invasive method for the detection of changes in CAD using the preliminarily processed signals is diagramed in FIG. 31 and comprises:
  • step (v) separating said feature data provided in step (iv) using an optimal linear discriminant function or other feature classifier to produce a classifier output for each pre-intervention beat and each post-intervention beat derived from said patient;
  • the preprocessed data is converted from multiple channels by a beamforming process.
  • a beamforming process Such an operation may also include the enhancements to signal to noise ratio discussed below.
  • the output of the beamformer is converted to the frequency domain for energy feature extraction, preferably, by an FFT method.
  • the beamforming may be carried out in the frequency domain.
  • the energy feature extraction is performed over two separate frequency bands by computing the energiews in high frequency band and a low frequency band.
  • These features are assembled into a feature vector of length two. Multiple observation of the feature vector corresponding to different heart beats, are typically assembled into a feature matrix. Each row of the matrix contains a single feature vector and has length two and corresponds to a single observation or beat. The columns of the feature matrix are as long as the number of observations.
  • These energies are then classified by a linear classifier which performs a least squares analysis of the data to linearly combine the two energies for a beat so as to provide a single output for each beat.
  • pre-intervention and post-intervention are then averaged to provide a single result for pre-intervention and a single result for post-intervention. Finally, these single pre-intervention and post-intervention results are compared to determine if a change has resulted from the intervention.
  • pre-intervention data could be analyzed as described above and this single output could be compared against a standard to determine the presence of CAD in a patient.
  • the present invention may be utilized for both predicting and tracking CAD in patients.
  • One method for enhancing the S/N of a signal comprises:
  • FIG. 33 shows spectrograms generated by a nine sensor array as shown in FIG. 6 .
  • the array was approximately centered at the third intercostal space at the left sternal border of the patient.
  • the sensors were affixed to the patient's chest with double-sided adhesive pads.
  • a computer-based clinical work station as generally described in the specification was used to digitize and record the acoustic signals from multiple cardiac cycles. The recorded signals of each sensor were described by the workstation signal conditioning circuitry with overlapping time windows and fast Fourier transformed to produce spectrograms of each heart.
  • FIG. 33 displays the results of a single beat for each of the nine sensors.
  • FIG. 34 is a computer-generated illustration of the volumetric beamformer output indicating the origin of an acoustic shear-wave viewed in three dimensions using multiple cutting planes along the Z-axis.
  • the acoustic image is obtained from the inverse path model of a nine-element array of sensors as shown by FIG. 6 using the conventional beamformer as described herein.
  • Acoustic data for each of the nine sensor locations was generated by delaying the signal from the source location in the volume under the array to each sensor, according to the path length from source to sensor, and the wave speed dispersion as a function of frequency, as known for shear wave propagation in the visco-elastic material having properties of human tissue.
  • Incoherent noise at a level equal to that of the acoustic data signal was added to the signal at each sensor, thus creating a signal-to-noise ratio of 0 dB.
  • the conventional beamformer algorithm was applied to the array signals to produce a value of spatial coherence at each location in the volume beneath the array.
  • the magnitude of coherence was mapped to a color scale along planes arranged in the volume to create a three-dimensional display predicting source location.
  • FIG. 35 shows volumetric acoustic images of data obtained from in vitro tests in a gelatin volume.
  • the figures illustrate the effect of six different degrees of occlusion, 25% to 90%, at steady anatomical flow.
  • a nine sensor array similar to that shown by FIG. 6 was used.
  • FIGS. 36A and 36B are a side-by-side comparison of the acoustic and radiographic images in the region of a 75% coronary lesion in a patient having coronary artery disease.
  • the non-invasive, in vivo acoustic image, FIG. 36A was obtained in substantially the same manner as in Example 1. Specifically:
  • the computer-based clinical workstation with appropriate signal conditioning circuitry was used to digitize and record the acoustic signals during an interval of several seconds.
  • the conventional beamformer algorithm was applied to the array signals to produce a value of spatial coherence at each location in the volume beneath the array.
  • the magnitude of coherence was mapped to a color scale along planes arranged in the volume to create a three-dimensional display predicting source location.
  • a radiographic image, FIG. 36B, of the coronary tree of a patient was produced using the known methods of coronary angiography, and aligned to the spatial reference of the acoustic image using radiopaque markers placed at the locations of the nine sensors of the acoustic array.
  • FIG. 36A The acoustic image, FIG. 36A, and angiographic image, FIG. 37B, were compared at the location of the lesion.
  • the radiographic and acoustic images were two-dimensional, anterior-posterior views.
  • the acoustic image correctly indicates the origin of a turbulent shear source just downstream from the 75% coronary occlusion.
  • FIGS. 37A and 37B are three-dimensional in vivo volumetric acoustic images at the location of two coronary lesions separated by a few centimeters in the left anterior descending coronary artery of a patient having coronary artery disease.
  • the left image in FIG. 37A is produced in substantially the same manner as in Example 1.
  • An intervention was performed whereby the patient receives treatment by placement of two stents to repair the stenoses.
  • a second volumetric acoustic image, FIG. 37B produced post-intervention in like manner.
  • the volumetric acoustic images, FIGS. 37A and 37B were compared.
  • FIG. 37A shows the turbulent sources prior to surgical intervention.
  • FIG. 37B shows the same cardiac region seventeen hours after two stents were placed in the artery to correct the stenoses.
  • the images measure five centimeters on each edge of the volumetric cube, and were created using the conventional beamformer described herein.
  • FIGS. 38 and 39 illustrate an example of non-invasive, in vivo detection of change in a patient's acoustic features obtained using the nine-element sensor array described in FIG. 6 and time-alignment signal processing, referring to FIG. 38A, acoustic energy at high and low frequencies for a patient having coronary artery stenosis is shown by the points scattered in the upper section of the plot. Following surgical intervention to repair the coronary lesion, the acoustic energy appears clustered at the lower left.
  • FIG. 39 is a plot of beat number against classifier output.
  • the pre-intervention beats subclass appears in the upper left quadrant of FIG. 39, wherein the post-intervention beats appear in the lower right quadrant of FIG. 39 .
  • Patient acoustic signals were acquired using steps 1 and 2 of Example 2.
  • Diastolic interval data from each channel and each beat are extracted.
  • the combined (summed) data from each beat was transformed into the frequency domain using FFT methods.
  • the frequency domain data was summed over low and high feature bands for frequency bands of approximately 200 Hz-600 Hz to produce a low frequency estimator, and over frequency bands of approximately 600 Hz to 1,800 Hz to produce a high frequency estimator.
  • the methods for non-invasive detection of changes in CAD as described in the specification were applied to patients taking part in a controlled study conducted at two research hospitals.
  • a passive acoustic sensor array was used to acquire data from 44 patients before (pre) and after (post) percutaneous coronary intervention.
  • Acoustic features were extracted from the mid-diastolic sounds measured from multiple cardiac cycles in each patient.
  • a training sample, using data from half of the cardiac cycles was used in a feature separation algorithm to separate the pre and post acoustic features for each patient. The remaining acoustic features were used to validate the separation algorithm.
  • Non-invasively detected acoustic feature changes after successful percutaneous intervention indicate changes in CAD.
  • the acoustic features differentiated the status of the patient (pre vs. post) in 41 of 44 patients (93%). See Table A.
  • Table A data shows that the method of optimally combining the signals from multiple sensors, described previously, ensures the highest performance of the non-invasive methods of detecting changes in coronary artery stenosis as described.
  • Table A also illustrates the method of the invention for enhancing the signal to noise ratio of acoustic abnormal blood flow signals. No single channel produces better results than this method.
  • S/N ratio enhancement achieved by optimally combining the sensor data from the array
  • the technique used for non-invasive detection of stenosis change has been applied to patient data as described in Example 7 using three different approaches.
  • the first approach uses features extracted from the optimally combined channels.
  • the second and third approaches used features extracted from single channel data. In the second approach, the channel with the maximum energy was used.
  • the channel with the minimum energy was used. All other aspects of the method for detecting changes in stenosis were kept the same.
  • the channel with the highest S/N ratio is deemed to have the highest total energy also.
  • the method does not perform as well using the single sensor with the highest S/N ratio compared to the enhancement achieved by optimally combining the signals from the array sensors. Clearly, the performance is much worse for a poorly placed sensor with relatively low S/N ratio.

Abstract

A non-invasive methodology and instrumentation for the detection and localization of abnormal blood flow in a vessel of a patient is described. An array of sensors are positioned on an area of a patient's body above a volume in which blood flow may be abnormal. Signals detected by the sensor array are processed to display an image which may indicate the presence or absence of abnormal blood flow.

Description

TABLE OF CONTENTS
FIELD OF THE INVENTION
BACKGROUND OF THE INVENTION
SUMMARY OF THE INVENTION
DEFINITIONS
DESCRIPTION OF THE FIGURES
DETAILED DESCRIPTION OF THE INVENTION
1. The Clinical Workstation
2. The Sensors and Sensor Arrays
3. The Acoustic Imaging System
4. Procedure for Use of The Clinical Workstation
5. Data Acquisition and Processing Beamformers
(a) Near Field Conventional Beamformer
1. Vector Formulation
2. Matrix Formulation
3. Summary Regarding Vector and Matrix Formulation
(b) Adjustable Gain/Resolution Null Space Beamformer
6. Compression Energy Suppression Beamformers
(a) Velocity Filtering
(i) Linear Arrays—Uniform Sensor Spacing
(ii) Non-Linear Arrays
(b) Steering a Null at the Compression Wave
(i) Option 1—See FIG. 24
(ii) Option 2—See FIG. 25
(c) Beamforming Methods When Wave Speed (c) as a Function of Frequency is Unknown
(i) Optimal Gridding
(ii) Non-Linear Unconstrained Optimization
(iii) Display of Source Location
7. Non-invasive Detection of Change in Coronary Artery Stenosis
8. Signal to Noise Ratio Enhancement
EXEMPLIFICATION OF THE INVENTION
Claims
ABSTRACT
FIELD OF THE INVENTION
The present invention relates generally to non-invasive blood flow imaging systems and more particularly to systems which are suitable for detecting turbulent blood flow.
BACKGROUND OF THE INVENTION
It is known that vibration of the surrounding structures caused by turbulent blood flow in a partially occluded vessel may produce sounds which are significantly attenuated at body surfaces.
Turbulent blood flow is evidenced by non-uniform spatial distribution of blood flow sound phase coherence. Absent turbulence, blood flow sound phase coherence is generally uniform.
Various techniques for acoustic detection of turbulent blood flow are known. See, e.g., Lees, et al., (1970) Proceedings of the National Academy of Sciences 67(2):935-942; Semmlow, et al., (1982) “Non-Invasive Diagnosis of Coronary Artery Disease by Enhanced Coronary Phonocardiography”, Abstract, IEEE Frontiers of Engineering in Health Care, pp. 181-185; Semmlow, et al., (1983) IEEE Transactions on Biomedical Engineering, BME-30(2):136-139; Wang, et al., (1990) IEEE Transactions on Biomedical Engineering, 37(11):1087-1094; Semmlow, et al., (1990) IEEE Engineering in Medicine and Biology Magazine, pp. 33-36; Akay, et al., (1992(1)) IEEE Transactions on Biomedical Engineering, 39(2):176-183; Akay, et al., (1992(2)) Medical & Biological Engineering & Computing, 30:147-154; Akay, et al., (1993(1)) IEEE Transactions on Biomedical Engineering, 40(6):571-578; Akay, et al., (1993(2)) Annals of Biomedical Engineering, 21:9-17; Verburg, J. (1983) Adv. Cardiovasc. Phys. 5(Part III):84-103.
SUMMARY OF THE INVENTION
This invention provides reliable, non-invasive methodology and instrumentation for the in vivo detection and localization of abnormal blood flow in a patient.
Generic embodiments of the invention entail detection and imaging of non-uniform spatial distribution of phase coherence of blood flow sounds in a volume of a patient's body below a sensor array.
The wave signals detected by the sensor array comprise a shear wave component and other components including a compression wave component. In the preferred practice of the invention, the shear wave component is isolated from the compression wave component. The isolated shear wave component is processed to provide a display of the spatial distribution of phase coherence of the blood flow sounds in the volume of the patient's body below the sensor array. An essentially uniform display indicates the absence of an abnormal blood flow. A non-uniform display may indicate the presence of an occlusion and the extent of the turbulent flow in the patient's vessel.
The invention may include sensor signal conditioning circuitry and software to implement one or more algorithms. The signal processing circuitry may be combined with a volumetric imager in a mobile clinical workstation operable by a medical technician or a doctor. The invention may include means for enhancement of the signal to noise ratio of the sensor signals.
An important aspect of the invention is a novel non-invasive method for detecting and tracking coronary artery stenosis change following percutaneous intervention.
DEFINITIONS
In this specification, the following words or expressions have the meanings set forth.
Field
An area or volume of space where certain physical laws govern. Typically, those laws are concerned with action at a distance. Examples: a gravitational field, an electromagnetic field or an acoustical field. In this specification, unless otherwise indicated, field refers to a volume of space where the laws governing wave propagation in a visco-elastic media are true.
Near Field
In an isotropic media when a wave front propagates out from a point source, the wave front is spherical in shape. In this specification, “Near Field” means a field near the source, where the wave front has high curvature. When an array of equally spaced sensors detects this curved wave front the delays, or phase shifts between the sensors will be different. If the wave velocity in the media is known, the location of the source in relation to the array can be determined. The location would have 3 dimensions either in Cartesian, Polar, or Spherical coordinates. If a volume a plane is considered then the location will have two dimensions.
Far Field
In this specification “Far Field” means a field far from the source, where the wave front has low curvature. A wave front very far from the source appears planar with no curvature. When an array of equally spaced sensors detects this plane wave front the delays, or phase shifts between the sensors may be different. By a coordinate transformation, directions can be found where the delay is constant per distance across the array and in the orthogonal direction the delay is zero per distance across the array. Determination of the direction of the source in relation to the array is possible of the wave velocity in the medium is known. The direction would have two angular dimensions in spherical coordinates. If a plane as exists with a linear array is considered, then the direction will have one dimension, an angle and the delay or phase shifts between sensors will be constant.
Advance and Sum Beamformer or Bartlett Beamformer or Conventional Beamformer
An algorithm which combines data acquired from a multichannel array of sensors by time shifting the time histories and then summing the signal. If the time histories are shifted negatively with respect to time (advanced) then the algorithm is typically called an advance and sum beamformer. If the time histories are shifted positively with respect to time (delayed) then the algorithm is typically called a delay and sum beamformer.
Path Model
A mathematical representation of the net transformation undergone by a signal as it propagates through a medium or through a circuit. A signal typically originates at a source and ends at a receiver.
Steering Vector
A vector derived from a path model used to steer the response lobe (beam) for an array of sensors.
Vessel
Any part of the human circulatory system through which blood flows. Includes arteries, veins, and the heart.
Abnormal Blood Flow
Any non-laminar, e.g., turbulent blood flow in a vessel.
Stenosis
Any artifact which reduces the effective cross-section of a vessel with consequent blood flow abnormality.
Abnormal Blood Flow Signal
A propagating wave generated by abnormal blood flow usually comprising a compression wave component and a shear wave component.
Sensor or Accelerometer
Any current or voltage mode device which generates an electric signal from displacement or a derivative thereof upon detection of a sound wave.
Sensor Array
The pattern or spaced arrangement of a plurality of sensors on or to be placed on the body surface of a patient. The array of sensors may be fixed in a device or pod positionable on the body surface of a patient.
Phonocardiography
The graphic representation of the sounds that originate in the heart and great vessels. As commonly used, the term phonocardiography also comprises carotid, apex and venous pulse sounds.
Great Vessels
The vessels that carry blood toward and away from the heart. The vessels carrying blood away from the heart include the aorta and pulmonary artery. The vessels carrying blood toward the heart include the superior and inferior vena cava.
Coherence
For a stochastic process x(t), the coherence function is defined as:
C(t1,t2)=E{X(t1)XH(t2)}−E{X(t1)}E{XH(t2)}
where E{•} denotes the statistical expectation operator, H is Hermetian or conjugate transpose, and X(t1)and X(t2) are random variables.
Phase Coherence
The coherence of the phase angle associated with a complex random process.
Algorithm
A series of steps or a method to achieve an information objective, e.g., the identification or location of an abnormal blood flow.
Compression Wave
A wave which compresses the medium through which it passes; the disturbance mechanism acts in the direction of the wave propagation.
Shear Wave
A wave whose propagated disturbance is a shear displacement in an elastic medium.
Beam
A concentrated, unidirectional receiver of sound.
Beamformer
An algorithm that defines or creates a beam.
Beamforming
The process of selectively controlling the response of a sensor array to increase sensitivity to a source location. Beamforming is a search through 3-D or 4-D data space to find the coordinates that yield maximum output at each of a plurality of frequencies.
Null
In the context of this invention, null means zero beamformer response at a specific location or angle. See FIG. 21.
Null Space
Null space is a vector subspace, if present, of a matrix.
Steering a Null
Controlling the location of a null in the response of a beamformer. See FIG. 22. For example, the goal may be to place the null at the location or angle where the interfering signal, e.g., a jammer, originates.
Velocity Filtering
Means for separating wave forms, including shear waves from compression waves as a function of the respective wave speeds in a medium, e.g., human tissue.
4-D Space or 4-Space or (x,y,z,c) Space
Four-dimension space in which the fourth dimension, “c”, is the velocity of shear wave propagation.
Three Dimensional Regularly Spaced Grid
FIGS. 26A, B and C and FIG. 27 illustrate of a three dimensional regularly spaced grid.
Four Dimensional Optimal Grid
A 4D optimal grid A which maintains constant beamwidth resolution throughout the volume with a minimum number of points and therefore a minimum amount of computational effort. See FIGS. 28A, 28B, 28C and 29.
Each of these figures represents a projection of a four dimensional grid into a three dimensional space. The four dimension is wave speed. Each of the points which can be seen in the three dimensional space of the figures exists at several different speeds. These speeds are spaced according to the beamformer's beamwidth in c (speed) at that point in four space.
Photogrammetry
Analytic photogrammetry refers to the analytic mathematical techniques that permit the inference of geometric relations between points and lines in the two-dimensional perspective projection image space and the three-dimensional object space. Digital photogrammetry refers to the computer processing of perspective projection digital images with analytic photogrammetry techniques as well as other computer techniques for the automatic interpretation of scene or image content.
Feature
Prominent part or characteristic that distinguishes data, a signal or an image as a member of one class distinct from another.
Feature Vector
An assembled plurality of individual features.
Feature Extraction
The process or procedure or algorithm by which a feature or features are generated or computed from the data. Extraction includes the steps of assembling the features into a vector and assembling multiple observations of the feature vector into a feature matrix.
DESCRIPTION OF THE FIGURES
FIG. 1 is a front and side view of one form of a clinical workstation including an acoustic imaging system of the invention.
FIG. 2A is a view of a second form of a clinical workstation having a contracted extendable arm support for two cameras to locate sensors by photogrammetry.
FIG. 2B is a view of the FIG. 2A form of the clinical workstation in which the arm for supporting cameras is shown extended.
FIG. 3 is a schematic that depicts one form of a prior art piezoelectric film sensor useful in the invention. FIG. 3 is a reproduction of FIG. 1 of U.S. Pat. No. 5,365,937.
FIG. 4 illustrates a portion of the top surface of the sensor diaphragm of the FIG. 3 sensor. FIG. 4 is a reproduction of FIG. 2 of U.S. Pat. 5,365,937.
FIG. 5 depicts a five element preselected sensor array fixed in a device or pod positioned on the chest of a patient.
FIG. 6 illustrates a prior art nine sensor array with sensors positioned in two concentric circles. Sensors 1-5 are positioned in an outer circle, sensors 6-8 are positioned in a second circle and sensor 9 is positioned in the center of both circles.
FIG. 7 is a schematic block diagram that depicts an arrangement of the components of one form of the acoustic imaging system of the invention.
FIG. 8 is schematic block diagram that depicts an arrangement of the components of the clinical workstation of the invention.
FIG. 9 is a schematic block diagram that depicts elements of the analog sub-system block of FIG. 8.
FIGS. 10 and 11 are circuit diagrams for the digital I/O Board shown in FIG. 9.
FIG. 12 is a plot of the beam steering angle 0 to π of a normalized conventional beamformer, no null steer as a function of output 0 to 1 from 5 sensors one-half wave length apart. Source at π/2.
FIG. 13 is a plot of the beam steering angle 0 to π of a normalized conventional beamformer, no null steer as a function of output 0 to 1 from 10 sensors one-half wavelength apart. Source at π/2; π/3, 0.75π, 0.2π, and 0.666π.
FIG. 14 is a plot of the beam steering angle 0 to π of an adjustable null space beamformer as a function of output from 0 to 1 from five sensors spaced one-half wavelength apart. GN (gain) 1, 10,100, 1000 and 10,000. Source at π/2.
FIG. 15 is a plot comparing the beam steering angles of a conventional and an adjustable null space beamformer as a function of output from 0 to 1 from five sensors spaced one-half wavelengths apart at GN 1, 10, 106, 1000 and 10,000.
FIG. 16 illustrates a frequency number decomposition with only shear waves present in the form of a 2-D transform F(f,k)
FIG. 17 illustrates a frequency number decomposition with compressional and shear waves present in the form of a 2-D transform F(f,k).
FIG. 18 illustrates a windowed 2-D transform W(f,k) F(f,k) frequency number decomposition for shear and compressional waves.
FIG. 19 is a stacked plot that depicts synthetic waveforms at a linear array with compressional and shear wave arrivals.
FIG. 20 is a stacked plot that depicts synthetic waveforms at a linear array with compressional and shear wave arrivals after velocity filtering. Comparison with FIG. 19 demonstrates the absence of compressional waves in FIG. 20.
FIG. 21 is a plot of the beam steering angle 0 to n of a conventional beamformer, no null steer as a function of output from 0 to 1 from a linear array of ten sensors one-half wavelength apart. Source at π/2. First, second, third and fourth nulls at 0.1, 0.3, 0.7 and 0.9π are shown.
FIG. 22 is similar to FIG. 21 except that a steered null at 0.6π is shown preceding the third null at 0.7π.
FIG. 23 is a plot of the beam steering angle 0 to π of an adjustable gain null space beamformer, no null steer, as a function of output from 0 to 1 from ten sensors spaced one-half wavelength apart at five gain levels. Source at π/2, π/3, 0.75π and 0.666 π.
FIG. 24 is similar to FIG. 23 except that a null steer at π/2 is shown. This figure illustrates “Option 1” discussed at page 74 of this specification.
FIG. 25 is similar to FIG. 24, except that it illustrates “Option 2” discussed at page 76 of this specification.
FIG. 26A is an x-y background projection of a regularly spaced 3D grid.
FIG. 26B is an x-z depth projection of a regularly spaced 3D grid.
FIG. 26C is a y-z depth projection of a regularly spaced 3D grid.
FIG. 27 displays the 3D grid points in three dimensions.
FIG. 28A is an x-y projection of a 4D optimally spaced grid.
FIG. 28B is an x-z depth projection of a 4D optimally spaced grid.
FIG. 28C is a y-z depth projection of a 4D optimally spaced grid.
FIG. 29 is a 3D projection of the 4D grid onto three dimensions.
FIG. 30 is the flow diagram or algorithm that illustrates preprocessing of data for use in the detection of change in coronary artery stenosis.
FIG. 31 is a flow diagram that illustrates further processing of the data generated pursuant to FIG. 30.
FIG. 32 is a flow diagram that illustrates the steps of combining select frequency band sensor array data from several channels, measured pre- and post-intervention, into a single signal, broadband feature extraction from the single channel data, classification, and comparison of the extracted pre-and post-intervention feature.
FIG. 33 shows spectrograms ambient room noise subtracted that illustrate the human cardiac cycle generated by each sensor of a nine sensor array as generally indicated by FIG. 6.
FIG. 34 is a volumetric image of a computer synthesized dispersive data model with added noise illustrating the origin of an acoustic shear wave.
FIG. 35 is a volumetric image of data obtained from an in vitro test in a gelatine chest model with embedded silastic tube at six different tension severities (levels of stenosis), i.e., 25%, 50%, 62%, 76%, 82% and 90%.
FIGS. 36A and 36B compare a volumetric acoustic image of a patient with 75% stenotic coronary lesion (FIG. 36A) to the angiographic record (FIG. 36B) of the same spatial location. The acoustic image was obtained by use of the non-invasive in vivo technology of this invention.
FIGS. 37A and 37B are volumetric images of a patient with 75% stenotic coronary lesion before (FIG. 37A) and after intervention (FIG. 37B).
FIG. 38 depicts a comparison of acoustic features indicative of patient heart beats pre and post intervention extracted at high and low frequency bands.
FIG. 39 illustrates the separation and classification of the pre and post intervention beat features extracted at high and low frequency bands as shown in FIG. 38.
FIG. 40 is a flow chart that illustrates operations of one embodiment of the invention.
FIG. 41 is a flow chart or logic diagram that illustrates the parsed data averaging process of block 2006 of FIG. 40 according to one embodiment of the invention.
FIG. 42 is a flow chart which illustrates the beamforming operations of block 2008 of FIG. 40.
DETAILED DESCRIPTION OF THE INVENTION
The present invention now will be described more fully hereinafter with reference to the accompanying figures, in which preferred embodiments of the invention are shown. This invention may, however, be embodied in many different forms and should not be construed as limited to the embodiments set forth herein; rather, these embodiments are provided so that this disclosure will be thorough and complete, and will fully convey the scope of the invention to those skilled in the art. Like numbers refer to like elements throughout. Some embodiments of the present invention may be embodied as methods and systems of computer program products. As will be appreciated by those of skill in the art, the various embodiments of the present invention may take the form of an entirely hardware embodiment, an entirely software embodiment or a combination of hardware and software.
The operation of the present invention is described herein with reference to flowcharts and block diagrams, FIGS. 40, 41 and 42.
FIG. 40 illustrates operations of one embodiment of the present invention. As seen in FIG. 40, the relative positions of shear wave sensors are determined (block 2000). Such relative locations may be determined by any number of methods including photogrammetry. The acoustic sensors may be any form of sensor suitable for obtaining acoustic information, but are preferably sensors with high sensitivity to shear wave patterns in tissue.
In addition to acquiring location information, acoustic information, preferentially shear wave information, is acquired from the sensor array (block 2002). This acoustic information preferably includes information during the second quarter of the diastolic interval of a patient for which acoustic imaging is desired. Also acquired may be ECG information, ambient noise information, patient noise information breath gating information.
The acquired information regarding the sensors, the patient and the ambient conditions may then be used to parse and correct the sensor data (block 2004). The parsing of the data preferably includes isolating sensor data corresponding to the time period for the second quarter diastolic interval of the patient. Data may also be discarded if, for example, the presence of ambient noise or patient noise is detected which would adversely impact the sensor data. Thus, for example, if a loud noise is detected or if breathing sounds are detected, the data corresponding to those time periods may be discarded. Alternatively, the sensor data could be corrected for such extraneous noise. In either case, the result of the parsing operation is a series of sensor data synchronized to heartbeats of the patient.
The parsed data from multiple heartbeats is then averaged to provide a single set of averaged sensor data (block 2006). This averaging is preferably carried out so as to maintain phase information from the sensory array. The averaged data is then beamformed (block 2008) and the results of that beamforming are imaged (block 2010).
FIG. 41 illustrates the averaging process of block 2006 according to one embodiment of the present invention. In performing the averaging, the sensor data is first windowed (block 2020) and an FFT of the windowed data performed (block 2022). An interchannel phase difference matrix is then determined for each frequency of interest (block 2024). The interchannel phase difference matrix may be determined as described above.
When all of the interchannel phase difference matrices have been determined for each set of sensory data (block 2026), the interchannel phase difference matrices are averaged (block 2028). This averaging results in a single interchannel phase difference matrix for each frequency of interest. The average interchannel phase difference matrices are then decomposed into their eigen values and eigen vectors (block 2030) and utilized in beamforming as described elsewhere herein.
The beamforming operations of block 2008 are illustrated in FIG. 42. As seen in FIG. 42, an optimal grid 4D beamforming is first obtained (block 2040). This optimal grid provides search through a four dimensional volume utilizing the minimum beamformers as is described herein. The grid is determined based on the beamwidth in four dimensions of the beamformer to be used. The optimal grid may be computed for each session or may be precomputed.
The 4D grid is then used to beamform through the test volume (block 2042), however, the beamforming operation is not a conventional beamforming operation but utilizes a 4D beamformer in x,y,z and c space. This 4D beamforming is accomplished by expanding the optimal grid from 3D to 4D space such that beamforming may cover the desired range of c values with the minimum number of beamformers. Thus, the speed of propagation through the patient need not be known but may be obtained from the 4D beamformer output.
The results of the 4D beamforming are then utilized to narrow the field of search for an optional subsequent higher resolution beamforming operation. Thus, as seen in block 2044, a new region or regions of interest may be determined based on the results of the first beamforming operation. This new region of interest is preferably regions corresponding to maxima (potential sources) of the first beamforming operation. The region of interest is also preferably a region including one beamwidth from the estimated sources of the first beamforming operation.
After determining a narrower search region, a new optimal grid is obtained for a higher resolution beamformer, such as an adjustable gain beamformer (block 2046). As with the previous grid, the adjustable gain grid may be precomputed or computed for each use. Furthermore, the adjustable gain grid is also preferably a 4D grid.
Using the optimal grid, a 4D adjustable gain beamforming operation, as described above, is carried out for the new search region (block 2048). From this higher resolution beamforming operation a dispersion characteristic is determined (block 2050). This dispersion characteristic may be obtained from the beamformer results because the beamformer is a 4D beamformer and, therefore, has available sufficient information to determine speed versus frequency for the region of interest.
Utilizing the dispersion characteristics obtained from the 4D beamforming, a subsequent 3D beamforming operation is carried out in the region of interest utilizing a regularly spaced grid (block 2052). This subsequent beamforming operation is carried out so as to make imaging easier.
It will be understood that each block of the flowchart illustrations, and combinations of blocks in the flowchart illustrations, can be implemented by computer program instructions. These program instructions may be provided to a processor to produce a machine, such that the instructions which execute on the processor create means for implementing the functions specified in the flowchart block or blocks. The computer program instructions may be executed by a processor to cause a series of operational steps to be performed by the processor to produce a computer implemented process such that the instructions which execute on the processor provide steps for implementing the functions specified in the flowchart block or blocks.
Accordingly, blocks of the flowchart illustration support combinations of means for performing the specified functions, combinations of steps for performing the specified functions and program instruction means for performing the specified functions. It will also be understood that each block of the flowchart illustrations and combinations of blocks in the flowchart illustrations, can be implemented by special purpose hardware-based systems which perform the specified functions or steps, or combinations of special purpose hardware and computer instructions.
A specific aspect of the invention provides instrumentation and methodologies for detecting coronary artery stenosis change following successful percutaneous intervention. This aspect of the invention permits serial noninvasive post intervention assessments of a stenotic lesion.
1. The Clinical Workstation
FIG. 1 illustrates a preferred clinical workstation configuration 110 which may include a computer monitor 111, a keyboard 112, five soft switches 113 and one rotary push dial 114 to permit an operator to enter patient information, control the system operations and select and review the data displayed.
The rotating push dial 114, as shown, has no physical stop points. It will transmit LEFT, RIGHT and PUSHED, RELEASED status information. Each of the soft switches 113, as shown, is a two-state (ON-OFF) device. The software interface to the soft switch panel occurs through low-level drivers (not shown) that communicate directly with the workstation 110. The data may be stored on a removable storage device (not shown) and printed on a graphics printer (not shown). The preferred operating system is a 32-bit Microsoft NT workstation version 4.0 or higher.
FIGS. 2A and 2B are schematics that show a form of the workstation 110 having a fold-away extension arm 115 to support two cameras for the location of sensors by photogrammetry. A support member 116 for the extension arm 115 is stored in the cabinet of the workstation 110 when the arm is not extended. The extendable arm 115 includes three elements 117, 118 and 119. Element 117 is pivotably connected to the support 116 at one end and to the element 118 at the other end. The terminal element 119 is pivotably connected at the distal end to the element 118.
The element 119 has arms 120 foldable into recess 121 in the element 119. Each of the distal ends of the foldable arms 120 includes means 122 for the attachment of cameras to permit photogrammetric determination of sensor positions.
2. The Sensors and Sensor Arrays
The acoustic imaging system processes signals transmitted by a plurality of acoustic sensors positioned in an array on or adjacent a patient's body surface to detect or localize abnormal blood flow.
The sensors measure body surface response to abnormal blood flow sound signals. An electrical signal of broad frequency response, high sensitivity, and high signal to noise ratio (S/N) is provided. An ECG monitor signal may also be included to provide a reference for the cardiac cycle.
The sensors may be charge or voltage mode accelerometers or piezo film transducers. Sensors having substantially the performance characteristics set forth in Table 1 are preferred. However, other suitable sensors may be used.
TABLE 1
Sensitivity 5 V/g
Acceleration Range 1 g (peak)
Amplitude Nonlinearity 1%
Frequency Response
20 Hz.-2,000 Hz.
Dynamic Range 120 dB
Power Requirement
Current Mode 18-30 VDC, 4-10 mA
Voltage Mode ±12 VDC, 4-10 mA
Electrical Noise
Broadband <1 micro 9
Spectral (20 Hz) −150 dB re. g/✓Hz
Spectral (100 Hz) −158 dB re. g/✓Hz
Spectral (1000 Hz) −163 dB re. g/✓Hz
Physical Dimensions
Diameter <1.6 cm
Height <1.9 cm
Connector - Type: 4 Pins
Preferred individual sensors comprise a stretched piezoelectric film transducer. Typically, the transducer is a stretched polyvinylidene fluoride film.
One sensor of that type is illustrated by FIGS. 3 and 4 which are reproductions of FIGS. 1 and 2 of U.S. Pat. No. 5,365,937 with the associated element numerals. In the best mode embodiment of the invention, the sensor dimension width is less than one-half wavelength for the wavelengths (frequencies) of interest. This requirement provides a sensor dimension of less than one (1.0) centimeter in the direction of interest. The best mode includes contact pressure on the face of the sensor effective to cause a static deflection of the film of about one millimeter. The best mode further entails use of multiples of such sensors in an array configuration of nine or more elements or use of a preferred array configuration to enhance performance, the configuration including: (i) no three elements are along the same straight line (non-colinear); (ii) all elements are along the same straight line (colinear); or (iii) use of sub-arrays, in which the total number of sensors in an array is made up by use of a plurality of smaller arrays or pods.
FIG. 5 illustrates a device 130 in which five sensors 131 (one of five sensors) are fixed in a preselected array in a device placed on the chest of the patient. The array includes a centrally positioned sensor 132 and four sensors illustrated generally by the single sensor 131 spaced from the central sensor 132. As shown in FIG. 5, the device 130 is operatively connected to a prototype acoustic imaging system of the invention including a computer monitor 133 and keyboard 134.
Another useful prior art nine sensor array 140 as shown by FIG. 6 comprises eight equally spaced sensors in concentric circles 141, 142 having prime numbers of sensors in each circle. Specifically, five sensors are shown in circle 141 and three sensors are shown in circle 142. A ninth sensor is at the center of the circles. In FIG. 6 “R” means the radius of the relevant circle. Alternatively, the sensors may be positioned in a linear array.
3. The Acoustic Imaging System
An embodiment of the invention is a clinical workstation having an acoustic imaging system. The acoustic imaging system may amplify the signals from the sensors, convert the sensor data from analog to digital format and may store the information and process the data to enhance vascular sounds and display the information to the operator.
One configuration of the acoustic imaging system and the manner in which it is interfaced with the clinical workstation is illustrated in the block diagram FIGS. 7, 8 and 9, which show only those specific details that are pertinent to the present invention. The block diagrams are used to avoid obscuring the disclosure with details readily apparent to those skilled in the art. The block diagram illustrations and the image processing diagrams of the figures are primarily intended to illustrate the major components of the system in a convenient functional grouping.
Referring to FIG. 7, a conventional interface circuit and conventional filters, amplifiers, anti-alias filters, sample and hold and calibration/test input components are represented. The MUX box may include a standard channel to channel multiplexer. The ECG sensor interface may be an analog interface circuit suitable for the industry standard ECG sensor (three sensor inputs: plus, minus, ground) with one output. The output of the ECG sensor interface is provided as a channel input to the multiplexer such that when selected, the ECG sensor output may be converted by the analog to digital converter from an analog signal to a digital signal. As is further illustrated in FIG. 7, respiration sensor input is provided to a breath gating circuit which may be used to synchronize acquisition of acoustic and ECG data.
The control logic may include circuitry for (i) gain control (four stages), (ii) filter control (four stages), and (iii) calibration control (on/off). As is also illustrated in FIG. 7, additional channels may be provided to the multiplexer for input such as background noise or other analog inputs.
As seen in FIG. 7, an analog interface circuit selectively receives input from the acoustic sensors and from a calibration test input. The interface circuit provides the information to a filter which may be multiple pole high pass filter such as a Butterworth or other suitable filter. The output of the filter is amplified by amplifier and provided to an anti-alias filter which provides its output to a sample and hold circuit. The output of the sample and hold circuit is then provided to a channel to channel multiplexer the output of which is provided to an analog to digital converter. The output of the analog to digital converter is buffered and provided to a digital I/O board resident in the computer so as to allow for transmission of the digital data from the analog sub-system to the computer.
The FIG. 8 sensor locating sub-system supplies data to the computer to locate the center point of each of the acoustic sensors preferably to within ±1 mm in x, y, and z axes relative to one of the sensors designated as a reference point. This is preferably done automatically after the sensors have been placed on the patient's body surface and just before data acquisition. This sub-system may provide 16-bit A/D readings to the system. The reading will represent the acoustical and any ambient sensors (not shown) as well as feed back from the ECG leads. The software interface of this sub-system may be through low level device drivers (not shown) that communicate directly with the acoustic imaging device.
The workstation of FIG. 8 also includes an analog sub-system which receives the output of the acoustic sensors, the ECG sensors and the respiration sensor. The analog sub-system may process this information in analog format and provide the results to the personal computer or other data processing system.
The analog sub-system shown in FIG. 8 includes a digital I/O interface on the board to reduce noise. The digital I/O board may be a PC-DIO-24 board available from National Instruments Corporation, 6504 Bridge Point Parkway, Austin, Tex. 78730 or the STUDI/O board available from Sonorus, 111 East 12th Street, New York, N.Y. 10003.
The power sub-system illustrated in FIG. 8 may provide power to each of the components of the workstation. Also shown in FIG. 8 are a CRT display and optional printer for providing output to a user. Input devices such as a keyboard, rotary dial and soft switches may also be provided for receiving input from a user. A removable media file or other storage device may be utilized by the personal computer to store data as well as transfer data to other workstations.
The FIG. 8 power sub-system may be industry standard. Appropriate input power characteristics are:
Voltage −15 to +15 DC
Current 4 to 6 amps
Appropriate output power characteristics are:
Voltage 18 to 30 V
Current 2 Ma to 10 Ma
Ripple Less than one MV
The computer, including the CRT display and keyboard, preferably is an industry standard, e.g., IBM PC 365, Dell Optiplex GX Pro, Compaq, Desk Pro 6000.
FIG. 9 illustrates the interconnection of the external sensors, the analog subsystem, the power supply for the analog subsystem and the digital I/O board. As seen in FIG. 9, the sensors may be connected to the analog subsystem by a an external cable. Similarly, the analog sub-system, which may output digital data representative of the analog information presented to the analog sub-system, may be separate from the computer system and may be connected by an external cable to the digital I/O board in the computer which provides access to the data by the processor of the computer. Alternatively, the analog sub-system may be incorporated in a computer or processing system utilized in a workstation according to the present invention.
The analog to digital board shown in FIG. 9 preferably has the characteristics set forth in Table 2:
TABLE 2
Analog Inputs
Acoustic Channels 31
ECG Channels 1 (3 inputs)
Digital Inputs (24 Bits) Max    Min
Input logic high voltage
Input logic low voltage
Input Current
Digital Outputs (24 Bits) Max    Min
Output high voltage (lout = −2.5 mA)
Output low voltage (lout = +2.5 mA)
Output current (Vol = 0.5 V)
Output current (Voh = 2.7 V)
Power
Typical
Maximum
Physical
Size
Construction
2 signal layers
Power plane
Ground plane
FIGS. 10 and 11 are circuit diagrams for the digital I/O Board shown in FIGS. 8 and 9.
FIG. 10 depicts one of the 32 analog channels that condition the array signals prior to digital conversion. FIG. 11 shows the termination of each of these analog channels as input along the top of the figure as ‘ANAxx’, into sample-and-hold buffers. Along the left side of FIG. 11 are the seven digital input “data request” lines 11A from the FIG. 8 computer.
Upon request from the PC, the analog data from each channel is routed from the sample-and-hold buffer to the analog-to-digital converter (A/D Converter of ADC), which is the large chip 113 at the bottom center of FIG. 11.
The final two chips 11C and 11D at bottom right of FIG. 11 are digital buffers for output to the PC.
4. Procedure for Use of The Clinical Workstation
This section of this specification provides an overview of how the acoustic imaging system may be used. Although these steps may not always be performed according to the stated sequence, this order is presently preferred.
(a) Power on the System
The power switch (not shown) is located on the front of the Clinical Workstation along with a light (color as required by standards) to indicate that the unit is turned on. The power switch turns on/off the entire system. It may be covered or recessed to prevent inadvertent operation. The system may execute a self-test each time it is powered on. The self-test sequence completes with an indication that the system is ready to use.
(b) User Controls
User controls may include a computer keyboard, rotary dial with push button action and “soft keys” that can be “labeled” by information on the display screen. The user access may be limited to only the menus and modes of operation that are part of the acoustic imaging system operation. Except in special modes that are restricted to authorized persons, the operator may not be able to access the operating system, alter system files or perform any other computer operations.
(c) Enter Patient Information
Patient information, such as name, ID number, date of birth, study number, referring physician's name and user's name, is entered. Additionally, a fixed length comment can be provided. All of the entered information appears on the screen to be verified by the user. The acoustic imaging system software may provide a template to guide the operator through the process of entering patient information. These templates may be field adjustable for each institution.
(d) Patient Preparation
This step requires positioning the patient, preparing the chest or other body surface, placing the sensor array and connecting the ECG leads, and verifying the signals. The patient may be instructed on protocols for breathing during the test, including exhaling and holding their breath in cooperation with the operator.
(e) Acquire Patient Test Data
The operator may have the capability to enter an acquisition comment such as the reason for the test (pre-intervention, post-intervention, office exam, etc.). The system may record the time and date of each acquisition automatically.
The instrument may provide feedback to guide the operator in each step, such as determining sensor array placement, indicators for sensor contact, and gain settings. Preferred embodiments may provide real-time feedback for the operator during the data acquisition interval to ensure proper system function.
The instrument may store acquired data over a defined interval, e.g., a 30-second to 15-minute interval. Any aberrant system condition is also stored. The data stored may contain a record which can be mapped to the system's time base. The instrument preferably includes means to internally retain patient records.
In addition to the patient data, the system may maintain a master log of summary information (date, time, patient identification, operator identification of all tests run and all error conditions) in a file that is password protected and can be accessed, copied and deleted only by authorized persons.
(f) Display Pre-Processed Data
Prior to releasing the patient and immediately after data acquisition, the workstation may apply a fast executing (less than three minutes) algorithm which demonstrates the integrity of the collected signal.
(g) Process Data
The system may automatically process patient data in the order collected unless prioritized by the operator. The workstation may execute the analysis based on a predefined protocol, providing a graphical progress (completion time) indicator while the processing is underway. At the conclusion of the processing, a copy of the patient's record may be archived to a removable storage medium by the operator, and the software may mark that record as archived. The system may indicate if the storage medium is full and also warn the operator of an attempt to delete a record that has not been previously archived.
(h) Display Output
The workstation may provide the capacity to display and interact with the data in the following ways, among others:
Display 2-D sliced views through the data volume with a goal to display 3-D volumetric rendering with sectional planes
Display 3-D volumetric data rendered using an alpha-curves to control voxel translucency
Zoom a slice (reprocess the data to gain better spatial resolution)
Annotate the images
Display raw sensor and ECG data
Display phonocardiographic data
Select a specific interval/frame
Change the color map
Select a frequency-domain filter (band selection)
Save the generated image plus the accompanying analysis
Print the images including patient information (system option).
4. Data Acquisition and Processing Beamformers
Near field conventional beamformers may be used in the practice of the invention. However, the invention includes a novel adjustable gain/resolution beamformer to provide a more focused beam steering angle.
(a) Near Field Conventional Beamformer
Vector formulation and matrix formulation are the two main types of procedures applicable to image flows using conventional beamformers in visco-elastic media. Both types of procedures may be used to implement a Bartlett beamformer. Vector formulation may also be used to implement a simple advance and sum beamformer.
1. Vector Formulation:
A matrix with as many columns as channels and as many rows as there are frequency bins within the desired frequency range is provided by ensemble averaging the sensor signals in the frequency domain with the spectra truncated to contain only the frequencies of interest. This matrix is shown by Equation 1: FFT v = [ B start_freq _bin , 1 B start_freq _bin , num_receivers B end_freq _bin , 1 B end_freq _bin , num_receivers ]
Figure US06278890-20010821-M00001
Equation 1
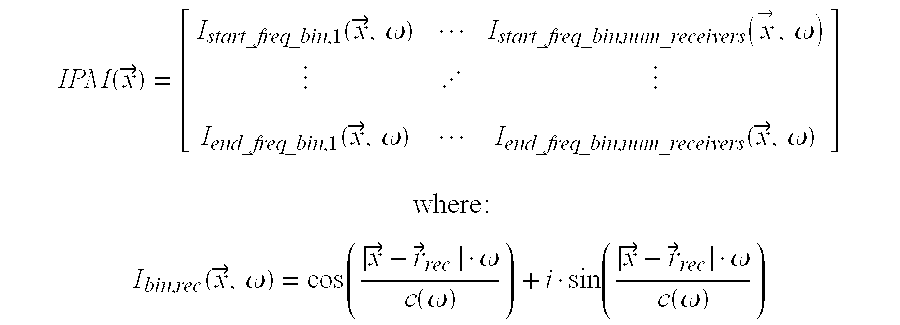
Next, for every point on a three dimensional grid, the given dispersion relation (frequency/velocity relationship) and the array geometry are used to compute a set of inverse path models at each location in three dimensional space. The origin and orientation of the coordinate system used is arbitrary. Typically, the coordinate system is normalized to be a right handed coordinate system with the location of the receiver closest to the center of the array used as the origin and with the positive x axis in the direction of the patients head and the positive z axis into the body. The inverse path model matrix (IPM) is shown by Equation 2: IPM ( x ) = [ I start_freq _bin , 1 ( x , ω ) I start_freq _bin , num_receivers ( x , ω ) I end_freq _bin , 1 ( x , ω ) I end_freq _bin , num_receivers ( x , ω ) ] where : I bin , rec ( x , ω ) = cos ( x - r rec · ω c ( ω ) ) + i · sin ( x - r rec · ω c ( ω ) )
Figure US06278890-20010821-M00002
and C(ω) is the dispersion relationship, and {right arrow over (r)}rec is the position of a particular receiver.
Equation 2
Finally, the beamformer output is computed by summing the scalar product of the ensemble averaged receiver signals matrix and the inverse path model matrix across channels thereby producing a row vector with as many complex elements as there were frequency bins. The complex magnitude of the elements is then summed across frequency bins yielding the beamformer output at the specified location. This is shown by Equation 4. First compute the scalar product of the inverse path model and the signal matrix:
M({right arrow over (x)})=FFTV·IPM({right arrow over (x)})
Equation 3
Now compute the beamformer output: B output ( x ) = bin = start_freq _bin end_freq _bin rec = 1 num_receivers M bin , rec ( x )
Figure US06278890-20010821-M00003
Equation 4
Using the conventional beamformer in four dimensions with the fourth dimension being speed, c, is exactly the same except that the c is no longer assumed to simply have a known functional relationship to frequency. Hence, IPM in Equation 2 becomes a function of both position and speed. In four dimensions, IPM is a function of speed as well as position:
M({right arrow over (x)}, c)=FFTv·IPM({right arrow over (x)}, c)
Equation 5
This functional relationship propagates through the equations as shown by Equation 6. Now compute the beamformer output: B output ( x , c ) = bin = start_freq _bin end_freq _bin rec = 1 num_receivers M bin , rec ( x , c )
Figure US06278890-20010821-M00004
Equation 6
2. Matrix Formulation:
For the matrix formulation of the conventional beamformer the receiver signals are first ensembled to form an R matrix at each frequency. The R matrix may be the cross spectral density matrix. Alternatively, interchannel phase difference matrices may be produced. No matter which method is used to form the matrices, the beamforming process remains the same. As with the vector formulation, these matrices are only formed at the frequencies of interest. The general form of the set of R matrices is given by Equation 7: R M ( ω ) = [ B 1 , 1 B 1 , num_receivers B num_receivers , 1 B num_receivers , num_receivers ]
Figure US06278890-20010821-M00005
Equation 7
Just as in the vector formulation, to beamform, the matrix formulated must have inverse path model information. For the matrix formulation, the inverse path model information is contained in steering vectors. Steering vectors are computed for each frequency and position in three dimensional space just as the inverse path models were in the vector formulation. However, steering vectors are computed across channels whereas the inverse path models in the vector formulation were computed across frequencies. The difference is merely a matter of when the values are computed and how they are organized. The actual value for any given position, array geometry, speed, and frequency are the same in either formulation. Equation 8 shows this different arrangement:
S({right arrow over (x)},ω)=[I1({right arrow over (x)},ω) . . . Inum—receivers({right arrow over (x)},ω)]
where: I n ( x , ω ) = cos ( x - r n · ω c ( ω ) ) + i · sin ( x - r n · ω c ( ω ) )
Figure US06278890-20010821-M00006
and where C(ω) is the dispersion relationship and {right arrow over (r)}n is the location of the nth receiver.
Equation 8
Once the R matrices and the steering vectors have been computed, the beamformer output can be computed. This is the sum across all of the frequencies of interest of the beamformer output for the given position in three dimensional space. This is shown by Equation 9: B output ( x ) = bin = start_freq _bin end_freq _bin S ( x , ω bin ) H R M ( ω bin ) S ( x , ω bin ) S ( x , ω bin ) H S ( x , ω bin )
Figure US06278890-20010821-M00007
Equation 9
Following the exact same logic used in vector formulation, moving to four dimension in the matrix formulation means that no particular functional relationship between speed and frequency is assumed. Thus, speed (c) becomes fourth dimensional as shown below by Equation 10: B output ( x , c ) = bin = start_freq _bin end_freq _bin S ( x , ω bin , c ) H R M ( ω bin ) S ( x , ω bin , c ) S ( x , ω bin , c ) H S ( x , ω bin , c )
Figure US06278890-20010821-M00008
Equation 10
3. Summary Regarding Vector and Matrix Formulation:
Either vector or matrix formulation beamforming may be used according to the present invention. Vector formulation requires fewer operations and is preferred. To compute the same frequency in using the matrix formulation requires one hundred ninety nine floating point operations (FLOPS). For the vector formulation, the FLOPS go up linearly with the number of array elements. For the matrix case, the number of FLOPS goes up as the square of the number of array elements.
FIGS. 12 and 13 are plots of a normalized conventional beamformer steering angle, at indicated source locations, as a function of the output from 0 to 1 of five (FIG. 12) and 10 (FIG. 13) sensors spaced one-half wave length apart. As FIGS. 12 and 13 indicate, conventional beamformers provide a relatively wide beam or broadly focused steering angle.
(b) Adjustable Gain/Resolution Null Space Beamformer
Adjustable gain resolution null space beamformer beam steering angles are more focused or acute. See the FIG. 14 plot of the beam steering angle of an adjustable null space beamformer and the FIG. 15 comparison of the beam steering angle of a conventional and adjustable beamformer.
One set of operations using an adjustable gain/resolution null space beamformer to acquire and process abnormal blood flow noise and image turbulent blood flow may include:
(1) Positioning an array of sensors on an area above a volume of space in a patient's body which may include a stenosis.
(2) Generating a three dimensional (x,y,z) grid as defined above of potential stenosis locations in the volume of the patient's body space below the sensor array.
The uniformly spaced three dimensional grid is generated by evenly dividing a three dimensional region of space into Nx, Ny, and Nz points along and perpendicular to the Cartesian axes X, Y and Z respectively. This space has dimensions in X, Y and Z of delx, dely, and delz, respectively and is offset below the array by a vector O. By varying O, delx, dely and delz, the size, shape and location of the volume of interest and the density of points in physical space can be adjusted.
(3) Determining the location on the x,y,z grid of the centers of contact on the patient's body of each of the sensors in the array. The location of the x, y z grid of the centers of contact on the patient's body for each of the sensors may be determined using stereo photogrammetry. See Horn, Berthold, Klaus, Paul, Robot Vision, Cambridge, Mass., MIT Press, 1986, pp. 311, 312. See, e.g., FIGS. 2A and 2B which depict means 120 and 122 for mounting two charge coupled device (CCD) cameras. Preferably the cameras are rigidly mounted 18 inches apart with a convergence angle of 45 degrees. The spacing of the cameras and the convergence angle may be varied by the operator. Images of the sensor array are simultaneously acquired by each camera, processed, and analyzed to provide an n-by-3 matrix of sensor positions on the patient's chest.
Retro-reflective tape is affixed to the sensor tops and illuminated with infrared (IR) light emitting diodes (LEDs) mounted around each camera's lens. To facilitate segmentation by increasing the image contrast, an infrared filter is mounted in front of the camera lens. The filter allows the reflected IR light to pass through to the camera sensor while reducing the amount of visible light entering the lens.
After segmentation, features corresponding to sensors in each image are analyzed using a connected component labeling algorithm. See Connected Component Labeling”, Haralick, Robert M. and Shapiro, Linda G., Computer and Robot Vision, Addison-Wesley Publishing Co., New York, N.Y., pp. 31-40. From the labeled image, the area, first moments, and second moments are derived for each connected component. Sensor feature area and first moments are used to determine location. The sensor feature area and second moments are used to determine orientation. After the position of each sensor feature has been determined, correspondence between said features in each image is established. Then using the coordinates of each sensor feature in both the left and right images, the x, y, z positions of the sensor tops are calculated with respect to the left camera with the following equations 11 and 12: z 1 = - b ( x r f r sin θ + cos θ ) ( x r f r - x 1 f 1 ) cos φ - ( 1 + x r x 1 f r f 1 sin φ )
Figure US06278890-20010821-M00009
Equation 11
[ x 1 y 1 z 1 ] = z 1 [ x 1 f 1 y 1 f 1 1 ]
Figure US06278890-20010821-M00010
where:
X′i is the x-coordinate in the left image, x′r is the
x-coordinate in the right image,
y′i is the x-coordinate in the left image, y′r is the
y-coordinate in the right image,
Xt is the x-coordinate of the sensor, yt is the y-coordinate of the sensor,
i is the left focal length, ∫r is the right focal length, b is the distance between cameras
θ is the convergence angle, and φ is θ/2.
Equation 12
Because each sensor top is assumed to be circular, the image of each sensor is an ellipse. Using the position of the ellipse, the orientation and the area, sensor positions on the patient's body surface are determined.
(4) Determining the distance to each location point on said grid from the center of contact of each sensor on the body surface of the patient. The distances are determined by computing the Pythagorean distances from each sensor location to each grid location. The resulting distances are stored in a matrix with as many rows as there are grid locations (Nx+Ny+Nz) and as many columns as there are sensor elements. The equation is given below:
Dg,r={square root over ((xg+L −xr+L )2+L +(yg+L −yr+L )2+L +(zg+L −zr+L )2+L ))}
where:
g={1,2,3, . . . (Number of Grid Points)}
r={1,2,3, . . . (Number of Sensors)}
Equation 13
(5) Concurrently acquiring data in one pass from the positioned sensors and from ECG over several heart beats. Specifically:
(i) first pass broad band low gain for S1 and S2 heart sounds;
(ii) second pass high pass filtered high gain data for turbulent blood flow signals.
(6) Parsing the concurrently acquired step (5) data into three time periods, i.e., S1 and S2 heart sounds and a quiet interval where blood flow through the artery is at its peak.
(7) Determining the shear wave phase angle shift from each sensor contact center to each location on the three dimensional grid of step (2).
The phase angle shift may be determined from a priori knowledge of shear wave speed in the body as a function of the frequency. See, Verburg, J., Transmission of Vibrations of the Heart to the Chest Wall. Advanced Cardiovascular Physics, Vol. 5 (Part III), pp. 84-103 (1983).
Alternatively, the phase angle shift may be determined de novo by methods such as those described in Oestreicher, H. L., Field and timpedance of an Oscillating Sphere in a Viscoelastic Medium with an Application to Biophysics, J. Acoust. Soc. Am. (1951) 23:707-714; von Glerke, H., et al., Physics of Vibrations in Living Tissues, J. Appld. Physiology (1952), 886-900.
(8) Determining an inverse path model (as one steering vector parameter) from each sensor contact center to each location point on the three dimensional grid. Given the distance from the center of contact for each sensor to each grid location and the shear wave speed in the medium, an inverse path model can be computed from each sensor to each grid point. The equation describing this inverse path model is given below: p ~ g , r - 1 ( ω ) = cos ( D g , r ω c ( ω ) ) + i sin ( D g , r ω c ( ω ) )
Figure US06278890-20010821-M00011
where:
g={1,2,3, . . . (Number of Grid Points)}
r={1,2,3, . . . (Number of Receivers)}
Equation 14
The phase angle shift determined in step (7) is assigned a complex weight of magnitude one.
(9) Forming an inverse path model (steering vector) matrix for each frequency of interest and for each location of interest.
The inverse path model matrix comprises a plurality of steering vectors in which
(i) each vector is composed of the scalar inverse path models from each sensor to a grid point;
(ii) the length of each vector is the number of sensors in the array; and
(iii) the number of vectors in the matrix is the number of interior points on the 3-D grid of step (3).
(10) At each peak arterial blood flow period as determined above
(i) taking sliding windows across all sensor data channels; and
(ii) taking a FFT of the windowed data in known manner.
(11) Computing an interchannel phase difference matrix (R matrix) for each frequency of interest corresponding to those used when forming the steering vectors in step (9) and for each sliding window of data taken in step (10). These matrices, as computed at each frequency of interest and for each data window from step (10) are averaged to form an ensemble interchannel phase difference matrix for each frequency.
Interchannel phase difference matrices are formed at each frequency by creating a vector v, of the complex FFT outputs across all channels at that particular frequency. Next, instead of forming the outer product as is done when forming the Cross Spectral Density matrices, the entire vector (each element) is divided by the element which is being used as the reference channel, vo. The selection of the reference channel is made easier by choosing the channel which has the highest variance. Choosing the channel with the highest variance and therefore the highest combined signal and noise increases the likelihood that the reference channel is the channel with the highest signal to noise ratio. Once the entire vector has been divided by the reference channel, all phase values represent the interchannel phase difference between each channel and the reference channel. The entire vector is multiplied by the magnitude of the reference channel to form the outer product of the vector which is the interchannel phase difference matrix for that frequency. The relevant Equations 15 and 16 are shown below: v icd ( ω ) = v ref ( ω ) v _ ( ω ) v ref ( ω )
Figure US06278890-20010821-M00012
Equation 15
Vicd(ω)=Vicd*Vicd
where:
is the interchannel difference vector at this frequency,
Vref(ω) is the scalar complex value of the reference channel FFT, and
Vicd(ω) is the interchannel difference matrix at this frequency.
Equation 16
(12) Decomposing the step (11) interchannel phase different R matrix into its eigenvalues and eigenvectors. This step is accomplished in known manner. See, e.g., Galoub and Van Loan, Matrix Computations (1989), Johns Hopkins University Press.
(13) The previous step decomposed the R matrix into its eigenvalues and eigenvectors, which can be expressed as shown below for a 3×3 matrix. R = v 11 v 12 v 13 v 21 v 22 v 23 v 31 v 32 v 33 H σ 1 0 0 0 σ 2 0 0 0 σ 3 v 11 v 12 v 13 v 21 v 22 v 23 v 31 v 32 v 33
Figure US06278890-20010821-M00013
Equation 17
The eigen values of the 3×3 R matrix are: σ1≧σ2≧σ3. Equation 18 associates the eigen values with their respective eigen vectors: ev 1 = v 11 v 21 v 31 , ev 2 = v 12 v 22 v 32 , ev 3 = v 13 v 23 v 33
Figure US06278890-20010821-M00014
Equation 18
The classical definition of the inverse R expressed by its eigenvalues and eigenvectors is shown below. Note that the superscript H denotes the conjugate transpose. R - 1 = v 11 v 12 v 13 v 21 v 22 v 23 v 31 v 32 v 33 1 σ 1 0 0 0 1 σ 2 0 0 0 1 σ 3 v 11 v 12 v 13 v 21 v 22 v 23 v 31 v 32 v 33 H
Figure US06278890-20010821-M00015
Equation 19
A problem may arise if any of the eigenvalues are equal to or close to zero because this causes the corresponding diagonal elements to go to infinity. The usual solution is not to include that eigenvector and eigenvalue in the R inverse formulation. This creates another problem if R inverse is used in a reciprocated form such as a beamformer because beamformer has the form: B Output in power = 1 S H R - 1 S ,
Figure US06278890-20010821-M00016
Equation 20
Thus, if the steering vector S to the desired location is identical to one of the deleted eigenvectors, then the beamformer output goes to infinity. This is not the right answer.
One method to avoid these problems is to partition the R inverse into two parts. One part uses the dominant eigenvalues and eigenvectors the other part represents the null space of the matrix R. As an example, for the 3×3 R matrix with one dominant eigenvalue, the following would be an estimate to the inverse: R - 1 = v 11 v 21 v 31 1 σ 1 v 11 v 21 v 31 H + GN V 12 v 13 v 22 v 23 v 32 v 33 1 0 0 1 V 12 v 13 v 22 v 23 v 32 v 33 H
Figure US06278890-20010821-M00017
Equation 21
GN is an arbitrary number that controls the effect of the null space on the inverse. In general, the two parts to the inverse can be defined for a N×N matrix with k dominant eigenvalues. See equations 22 and 23. R S = ev 1 Λ ev k 1 σ 1 0 0 0 O 0 0 0 1 σ 3 ev 1 Λ ev k H
Figure US06278890-20010821-M00018
Equation 22
R N = ev k + 1 Λ ev n 1 0 0 0 O 0 0 0 1 ev k + 1 Λ ev n H
Figure US06278890-20010821-M00019
Equation 23
So the inverse can be expressed as:
R−1=RS+GN·RN
Equation 24
(14) By using the inverse developed above the beamformer output can be written as: B Output in power = 1 S H R S S + GN · S H R N S
Figure US06278890-20010821-M00020
Equation 25
where S is the steering vector and GN is the gain on the null space of the beamformer output. Low GN widens the beam width. High GN narrows the beam width.
(15) The value of the step (14) beamformer output is associated with the 3-D location and the results displayed with a volumetric imager.
Any commercially available volumetric imager may be used.
(16) Inspecting the step (15) image to determine the need for compression energy suppression. Absent such need, the image is complete.
6. Compression Energy Suppression Beamformers
The formation of acoustic images of turbulent blood flow signals may be enhanced by elimination or reduction of the effects of compressional waves relative to shear waves or any other waves arriving at the sensor array. Compression energy may be suppressed by velocity filtering which does not require a priori knowledge of shear to compression energy ratio or by steering a null at the compression wave component of the signal detected by the sensor array which does require such a priori knowledge.
(a) Velocity Filtering
Velocity filtering exploits the differences in apparent wave speeds between the compression waves and other waves including shear waves moving more slowly across the array sensors. Velocity filtering does so by filtering the signals so that waves of very high apparent wave speeds are eliminated by the filter and slower moving waves are allowed to pass through.
(i) Linear Arrays—Uniform Sensor Spacing
One velocity filter algorithm applicable to data from a linear array of equally spaced sensors is summarized below:
1. Compute the two-dimensional discrete Fourier transform of the sensor data, F(u,v) defined in Equation 26, infra. This is a two-dimensional function of temporal frequency and spatial frequency or wavenumber.
2. Window the data in the f-k plane (frequency-wavenumber) by computing W(u,v)F(u,v) where the window function W(u,v) is designed to eliminate features with unwanted velocities and pass others.
3. Compute the inverse two-dimensional Fourier transform to get the velocity filtered time series. See Equation 28, infra. Alternately, if the data are to be processed in the frequency domain, then compute the one-dimensional inverse Fourier transform in the spatial frequency dimension.
The algorithm derives from the fact that with a linear array, the acoustic field is sampled in both time and space. The resulting sensor data are treated as a two-dimensional discrete function (f(n,m)) where n and m are the discrete variables for time and distance from the source. A straightforward implementation of a velocity filter for linear arrays starts with the two-variable discrete Fourier transform of the sensor data: F ( u , v ) = n = 0 N - 1 m = 0 M - 1 f ( n , m ) - 2 π ( un / N + vm / M )
Figure US06278890-20010821-M00021
Equation 26
The forward transform has a unique inverse that is given by: f ( n , m ) = 1 MN u = 0 N - 1 v = 0 M - 1 F ( u , v ) - 2 π ( un / N + vm / M )
Figure US06278890-20010821-M00022
Equation 27
This makes it possible to compute F(u,v), manipulate the data in the transform domain and then compute the inverse transform to get back a filtered version of f(n,m). The forward transform can be obtained by two successive one-dimensional Fourier transforms. First compute the Fourier transform of f(n,m) in the time domain separately for every channel. This yields a complex intermediate function F(u,m). The sensor measurements are real (not complex), and F(u,m) has conjugate symmetry about f=0 in the temporal frequency dimension. Then compute the Fourier transform of F(u,m) in the spatial dimension across all channels for every frequency bin. The final function, F(u,v) does not necessarily have conjugate symmetry about k=0 in the spatial frequency dimension.
The FIGS. 16 and 17 magnitude plots of the function 101og10(|F(u,v)|2) show another important property of the transformed data. The dispersion relations that govern the propagation of compressional and shear waves appear as different features of the f-k plane. More specifically, FIG. 16 illustrates frequency-wave number decomposition with only shear waves present. FIG. 17 illustrates frequency-wave number decomposition with compressional and shear waves. A band of energy 143 received at an array is shown. The function f(n,m) used to generate the FIG. 16 image is synthesized by propagating an artificial source to the elements of a linear array. The artificial source contains only a shear component. Shear wave dispersion is illustrated at 144.
The FIG. 16 f(n,m) function used to generate the FIG. 17 image is synthesized using an artificial source with shear and compressional waves. Superimposed on both images (FIGS. 16 and 17) is the dispersion curve 145 for shear waves predicted by Verburg, J.: Transmission of Vibrations of the Heat to the Chest Wall. Advanced Cardiovascular Physics, (1983) 5(Part III):84-103.
As FIGS. 16 and 17 show, the different waves produce distinct linear features in the f-k plane. The slope of a line in the f-k plane has dimensions of velocity. The steeper the slope, the higher the wave speed. Curved lines correspond to dispersive waves since the velocity changes with frequency. Note that the shear wave speed increases with frequency as predicted by Verburg's curve. The compressional wave dispersion feature is illustrated at 146 (FIG. 17). This feature is vertical, corresponding to a nearly infinite apparent wave speed across the array. This is the energy to be filtered out.
To implement the velocity filtering, apply a two-dimensional window, W(u,v) to F(u,v), designed to remove the vertical feature near k=0 and then compute the inverse transform as follows: f ~ ( n , m ) = 1 MN u = 0 N - 1 v = 0 M - 1 W ( u , v ) · F ( u , v ) 2 π ( un / N + vm / M )
Figure US06278890-20010821-M00023
Equation 28
An example window function is a two-dimensional boxcar that is zero for P wavenumber bins on either side of k=0 and all frequency bins, and one for all other values of f and k. W ( u , v ) = { 0 for v [ M - 1 2 - P , M - 1 2 + P ] , u 1 otherwise
Figure US06278890-20010821-M00024
Equation 29
FIG. 18 illustrates frequency-wave number decomposition with window applied as an example of the product W(u,v)F(u,v) for shear and compressional waves. Here the window function has a 12% cosine taper that provides a more gentle roll-off near k=0. The vertical feature 147 near k=0 from the compressional wave has been eliminated by the window function.
FIGS. 19 and 20 are stack plots of the signals recorded at each sensor position as a function of time and distance along the array and therefore show the effect on the time series of the velocity filtering. In FIG. 19 the compressional arrivals 148 and shear arrivals 149 can be seen clearly. The compressional wave arrives at each sensor on the linear array at virtually the same time. The shear waves are slower and dispersive. FIG. 20 is a stack plot of the signals after velocity filtering. The elimination by velocity filtering of the compressional waves from the time series is shown at 150. FIG. 20 shows that the shear wave arrivals at 151 are not affected by elimination of velocity filter.
(ii) Non-linear Arrays
The discrete Fourier transform requires uniformly spaced samples. Because the sensor data f(n,m), from the array are not uniformly sampled in the spatial dimension, the data are spatially interpolated onto a regularly spaced axis. To accomplish this, advantage is taken of the fact that the two-dimensional discrete Fourier transform may be computed by two one-dimensional transforms. An algorithm for velocity filtering data from other than linear arrays with uniformly spaced sensors follows.
1. Compute the distances from a potential source location (i.e. a point in the volume for beamforming) to each of the array sensors. Sort the receivers in ascending order according to their distance from the potential source. This leads to the two-dimensional function f(n,m) where m are irregularly spaced, increasing distances.
2. Compute the Fourier transform of the sensor data, f(n,m) along the time dimension. This yields the complex function F(u,m), with irregularly spaced samples in m.
3. At each frequency bin, perform a complex interpolation of F(u,m) onto a regularly spaced coordinate axis, mi. This yields the function F(u,mi) which has uniformly spaced samples in the spatial dimension.
4. Compute the Fourier transform of F(u,mi) along the spatial dimension. This results in the two-dimensional function F(u,v) where v is a discrete radial wavenumber variable.
5. Window the data in the f-k plane by computing the product W(u,v) F(u,v) where the window function is designed to eliminate features with unwanted wave speeds and pass others.
6. Compute the inverse two-dimensional Fourier transform to get the velocity filtered time series, f(n,mi). Resample f(n,mi) at the original sensor distances, to get back the filtered version of f(n,m).
(b) Steering a Null at the Compression Wave
A beamformer null exists when the response at a specific location or angle goes to zero. See FIG. 21 which illustrates four labeled nulls in a conventional beamformer beam steering angle under the conditions identified in FIG. 15. The sensors are in a linear array. Four nulls appear in the response of the beamformer. There are potentially nine null locations. The five null locations not shown are outside the space spanned by the steering vectors for plane waves. The four nulls that appear in this response are not controlled in their locations but appear spontaneously.
The invention may include a “null steering” operation to place a null at the location or angle where an interfering signal originates.
FIG. 22 illustrates a steered null of 0.6 π under the same conditions as described and illustrated by FIG. 21.
FIG. 23 is a plot of the beam steering angle, 0 to π of an adjustable null space beamformer at five gain values as set forth.
Two options are available for steering a null at the compression wave component of the signal detected by the sensor array. The two options require a priori knowledge of the shear to compression energy ratio.
(i) Option 1—See FIG. 24:
First proceed as in Adjustable Gain Null/Resolution Space Beamformer as described. Then generate a second matrix of steering vectors that represents the phase shifts associated with compression waves from potential source locations. At the frequencies of interest, let
SSH=Steering vector for shear waves,
SCOM=Steering vector for compression waves, and
PSHPCOM=The ratio of shear to compression power at the source location.
The following variables have the same meaning as before:
GN, RS, RN and Boutput in power.
Then the beamformer output can be expressed by the relationship below. Only positive values of the output are valid. The beam width is adjustable while the null width is not controlled. B Output in power = 1 S SH H R S S SH + GN · S SH H R N S SH - P SH P COM [ S SH H R S S COM · S COM H R S S SH ] [ S COM H R S S COM + GN · S COM H R N S COM ] - P SH P COM GN · [ [ S SH H R N S COM · S COM H R S S SH ] + [ S SH H R S S COM · S COM H R N S SH ] ] [ S COM H R S S COM + GN · S COM H R N S COM ] - P SH P COM GN 2 · [ S SH H R N S COM · S COM H R N S SH ] [ S COM H R S S COM + GN · S COM H R N S COM ]
Figure US06278890-20010821-M00025
Equation 30
The first term of the relationship is the previously described beamformer that has only positive values. The second term has value of zero when the first term approaches 1 and a value of −1 when compressive steering vector is pointing at a compressive source.
(ii) Option 2—See FIG. 25
The beamformer, described in option 1 is modified by a different second term that produces a null in the response. This different second term does not use the R matrix regardless of how it is generated. Instead, a new second matrix is formed:
RCOM=SH COMSCOM
where:
SCOM=Steering vector for compression waves, and
RCOM=Correlation matrix for compressive waves.
Equation 31
The inverse of this matrix can be expressed in two parts as before by performing an eigenvalue decomposition of the matrix.
R−1 COM=RCS+RCN
where:
RCS=The inverse rank space of RCOM which has only one
eigenvalue, and
RCN=The inverse null space of RCOM.
Equation 32
The beamformer output is now the positive part of the following relationship: B Output in power = 1 S SH H R S S SH + GN SH · S SH H R N S SH - P SH P COM 1 S COM H R CS S COM + GN COM · S COM H R CN S COM -
Figure US06278890-20010821-M00026
where:
GNSH=Gain Null Space Shear Waves
GNCOM=Gain Null Space Compression Waves
Equation 33
Since the RCOM matrix has only one non-zero eigenvalue, and all the other eigenvectors are orthogonal to this eigenvector, the eigenvector associated with the non-zero eigenvalue is a scaled version of the original SCOM vector. The problem of finding a set of vectors orthogonal to the first vector SCOM, can be done by the Modified Gram-Schmidt algorithm [Matrix Computations, Goloub and Van Loan Sec. 6.2] which is faster than finding the eigenvalues and eigenvectors of a matrix. This leads to a new version of option 2.
The Modified Gram-Schmidt algorithm is listed in Appendix A. The output of this algorithm is a new matrix and from this and the two parts of the inverse of R, the beamformer output can be found by the second algorithm described in Appendix B.
(c) Beamforming Methods When Wave Speed (c) as a Function of Frequency is Unknown
Three useful methods are:
(i) Optimal gridding of space for the rapid determination of the source location in (x y z c) beamforming hyper volume;
(ii) Determination of a source location as a non-linear unconstrained optimization problem; and
(iii) Display of source location on a uniformly gridded space (x y z) that has uniform resolution at each point in the space.
(i) Optimal Gridding
FIGS. 26A, 26B and 26C are the projections of the 3D grid. FIG. 27 displays the grid points in three dimensions.
FIG. 28 and FIG. 29 are examples of the 4D optimal grid which maintains constant beamwidth resolution throughout the volume with a minimum number of points and therefore a minimum amount of computational effort. FIGS. 28A, B and C are the set of orthogonal projections and FIG. 29 is the 3D projection of the four dimensional grid onto three dimensions.
Beamforming can be thought of as a search through data space to find the (x, y, z) coordinates that give the maximum output at each frequency. If the velocity of propagation is unknown, it becomes the fourth unknown “c” in the search. To do this search efficiently, an optimal grid having the minimum number of points that need be tested (beamform to) in the volume should be used.
An algorithm useful to generate an optimal grid may include:
(1) Assuming a shear wave speed as a function of frequency.
(2) Generating half-power beam width estimates for each of a high, a low, and a middle frequency.
(3) Generating a synthetic array of sensors.
(4) Generating a three-dimensional grid of potential turbulent flow noise source locations beneath the synthetic sensor array.
(5) Identifying at each potential noise source location on the grid, a synthetic source and propagating waves to the surface from that source.
(6) Determining the beam widths in both plus and minus directions from each synthetic source location by changing the assumed value of x y z and c in sequence for each source location from the correct values until the beam output is one half the correct value, wherein four beam widths are associated with each point in four spaces.
(7) From the information provided by item (5), generating a function that gives beam width in one dimension as a function of the other dimensions.
(8) Constructing a 4-D (x y z c) grid from the information provided by item (6) by:
(a) Generating surfaces of equal Z resolution (beam width).
(b) On these surfaces, generating rings of equal R resolution (beam width).
(c) On these rings, finding points of equal angular resolution (beam width).
(d) On these points in 3 space (cylindrical coordinates), find points in c space that have equal resolution in velocity.
This 4-D grid is the optimum solution for finding a potential source of unknown location where the potential locations of the source are uniformly dispersed throughout the volume. The use of this grid minimizes the computational effort required to find a source and its associated position in 4 space. A true source location will generate maximal output in the beamformer for the correct values of [x y z c]. To speed the search process, a conventional beamformer algorithm as described may be used initially to search the four dimensional space for a source.
(ii) Non-Linear Unconstrained Optimization Problem
To find a source given an estimate of its location in (x y z c), Newton's method can be used. The needed partial derivatives can be estimated with finite differences. The object is to find a point where the gradient is zero and the Hessian matrix of partial derivatives has all negative eigenvalues indicating the location is on a peak.
The gradient of B=Beamformer output in power with respect to the variables x,y,z, and c. Gradient = = B X B Y B Z B C
Figure US06278890-20010821-M00027
where:
B=Beamformer output in power,
X=Potential x location of source,
Y=Potentialy y location of source,
Z=Potential z location of source,
C=Shear velocity of media.
Equation 34
The Hessian of B with respect to the variables x, y, z and c is shown below. Hessian = H = 2 B X 2 2 B X Y 2 B X Z 2 B X C 2 B Y X 2 B Y 2 2 B Y Z 2 B X C 2 B Z X 2 B Z Y 2 B Z 2 2 B Z C 2 B C X 2 B C Y 2 B C Z 2 B C 2
Figure US06278890-20010821-M00028
Equation 35
The update for each new estimate on x, y, z, and c becomes: X Y Z C NEW = X Y Z C OLD - H OLD - 1 · OLD
Figure US06278890-20010821-M00029
Equation 36
Force the eigenvalues of the Hessian to be negative at all iterations lest the method converge to a saddle point or a minimum point. Display the results on a uniformly gridded space.
(iii) Display of Source Location
3-D visualization methods are usually designed to work on uniformly gridded data. With the adjustable gain null space beamformer as described, each point and frequency can have nearly the same resolution by changing GN to give the same beam widths at different locations within the grid.
7. Non-Invasive Detection of Change in Coronary Artery Stenosis
Pursuant to the invention, change in CAD status, specifically, the degree of coronary artery stenosis, may be determined by comparison of acoustic images or measurements made at different times.
This aspect of the invention may proceed in three steps in which pre-and post-intervention acoustic data in separate channels from a plurality of sensors, e.g., nine sensors, is preprocessed and quality screened, see FIGS. 30 and 31. The preprocessed channel data undergoes further signal processing to extract and classify pre- and post-intervention energy features, and the extracted and classified features are compared to identify post-intervention change in a stenotic lesion. See FIGS. 31 and 32.
FIG. 30 illustrates a preprocessing phase in which acoustic data is separately generated by an array of acoustic sensors. In the figure, the block 1000 indicates nine channels of data from a nine sensor array as shown by FIG. 6. However, the array may comprise any desired number of sensors. The acoustic sensor data is calibrated at block 1001 and subjected to heart beat parsing concurrently with EGC data at block 1002.
The parsed acoustic sensor data and EGC data is subjected at block 1003 to visual inspection of the signal corresponding to each heart beat to detect abnormalities such as interference from transient noises or breath sounds.
The acoustic sensor data calibrated at block 1001 is also bandpass filtered at block 1004 and subjected to aural screening at block 1005. The visually screened data from block 1003 and the aurally screened data from block 1005 is accepted or rejected on a per beat basis at block 1006 based on the usual inspection and aural screening. The final screening process at block 1006 compares the analysis window for each beat that passed visual inspection at block 1003 with the segments identified by aural inspection at block 1005 as containing interfering noise. If these analysis windows overlap, the analysis window for that beat is rejected from further processing. Typically all channels for a beat will be accepted or rejected together.
If the data passes both the aural screening and the visual inspection, then the data is provided as preliminary processed signals for further evaluation as is seen in FIG. 31.
Referring to FIG. 31, the screened beats produced at block 1006 comprise pre-intervention beats, nine channels per beat and post-intervention beats, nine channels per beat.
The screened, pre-intervention beat data is subjected to band-limited cross-correlation at block 1007. The signal generated at block 1007 is further processed as shown. Specifically, the block 1007 signal is assigned optimal lags at box 1008 and optimal weights at block 1009.
All of the nine pre-intervention signal channels with the optimal lags from box 1008 are time aligned at block 1010 and at block 1111 with the nine channels of post intervention beat data.
The optimally weighted block 1009 pre-intervention beat data is combined at block 1112 (x) with the time aligned data from block 1110 and summed at block 1113.
The data from block 1111 which comprises time aligned optimally lagged pre-intervention data and post-intervention beat data is combined at block 1114 with the optimally weighted block 1009 pre-intervention beat data and summed at block 1115.
FIG. 32 illustrates one method for comparing pre-intervention with post-intervention data features to identify changes in the degree or extent of a coronary artery stentoci lesion.
Referring to FIG. 32, blocks 1000 indicate nine channels of acoustic sensor array data. Blocks 1020 indicate data preprocessing as shown by FIGS. 30 and 31. Block 1021 illustrates use of a time domain beamformer to convert the nine beat channels to one channel.
The single channel per beat output of blocks 1021 is subjected to broadband frequency feature extraction at blocks 1022.
Two energy features are extracted in known manner. One energy feature is extracted at a first low frequency, e.g., 200 to 600 Hz and at a second higher frequency, e.g., 600-1800 Hz.
At blocks 1023 the extracted features are classified per beat into a pre-intervention subclass and a post intervention subclass. Any classifier means may be used. An optimal linear classifier is preferred.
The pre-intervention feature data subclass and the post-intervention feature data subclass are averaged across beats at blocks 1024. The averages are compared at block 1025. Preferably, the comparison is accomplished by plots which separate the number of pre-intervention and post-intervention beats at the high and low frequencies used for feature extraction and by plots of classified pre-and post-intervention beat data. See FIGS. 38 and 39 discussed in Example 6, infra.
A difference between the averaged pre-intervention and post-intervention classifier outputs indicates a stenosis change in a coronary artery of the patient.
Also pursuant to this invention, coronary artery stenosis change may be tracked prior to or post intervention by a comparison of time series of acoustic images produced as described before or after intervention.
The invention also provides standard or a plurality of standard plots typified generally by FIGS. 38 and 39 for use in making diagnostic comparisons of stenotic lesion change with time.
A specific aspect of the invention comprises any plot of the number of beats of a patient's heart at a first time and at a second time against a high frequency feature and a low frequency feature and any plot of a beat classifier output against heart beat numbers before and after percutaneous intervention.
This invention may be used to detect change in coronary artery stenosis after any type of percutaneous revascularization.
Algorithms for data acquisition and preliminary data processing, according to one embodiment of the present invention, shown in FIG. 30 may comprise:
(i) providing a fixed array of sensors conformable to the chest of a patient;
(ii) placing said array on the chest of said patient in an area above said patient's heart,
wherein the patient's heart beat generates S1, S2, S3, S4 and other cardiac sounds;
(iii) calibrating and converting said sounds into engineering units of acceleration which constitute the signals to be analyzed;
(iv) segmenting said signals into individual beats of said patient's heart;
(v) providing for each individual beat of said patient's heart a time window between said S2 and S1 sounds; and
(vi) providing aural and visual quality inspection of said sounds in each of said time windows;
(vii) rejecting said sounds which do not pass said quality inspection.
More specifically, with respect to FIG. 30, the data pre-processing may involve calibrating the sensor output for each channel. These calibrated outputs are bandpass filtered and then screened for aural abnormalities, such as the presence of background noise, etc. The calibrated outputs may also be synchronized with ECG data from a patient so as to window the data for the maximum blood flow period. This windowed data may then be visually inspected for each beat to detect abnormalities in the data, such as breath sounds or the like. For example, analysis windows (85 msec in mid-diastole of each beat identified by parsing algorithm) are visually inspected and are accepted unless there exists visually apparent interference from transients, breath sounds or other heart sounds such as S3 or S4. Aural screening of the recorded acoustic data identifies segments of interference from undesired noises including breath sounds, cable noises, bowel sounds, room noises, speech and various transients. Data may be accepted or rejected on a per beat basis based on the aural screening and visual inspection.
A non-invasive method for the detection of changes in CAD using the preliminarily processed signals is diagramed in FIG. 31 and comprises:
(i) combining multiple signals from array sensors into a single signal as depicted in FIG. 32;
(ii) providing feature data extracted from a patient before intervention;
(iii) providing feature data extracted from a patient after intervention;
(iv) pooling all feature data from all pre-intervention and all post-intervention heart beats of said patient;
(v) separating said feature data provided in step (iv) using an optimal linear discriminant function or other feature classifier to produce a classifier output for each pre-intervention beat and each post-intervention beat derived from said patient;
(vi) separately averaging across beats the pre-intervention and post-intervention classifier outputs produced in step (v); and
(vii) determining the difference between the averaged pre-intervention and post-intervention classifier outputs obtained in step (vi),
wherein said difference in average output from pre-intervention to post-intervention indicates a change in coronary artery stenosis for this patient.
More specifically, as seen in FIG. 31, the preprocessed data is converted from multiple channels by a beamforming process. Such an operation may also include the enhancements to signal to noise ratio discussed below. After beamforming, the output of the beamformer is converted to the frequency domain for energy feature extraction, preferably, by an FFT method. Alternatively, the beamforming may be carried out in the frequency domain.
In any event, the energy feature extraction is performed over two separate frequency bands by computing the energiews in high frequency band and a low frequency band. These features are assembled into a feature vector of length two. Multiple observation of the feature vector corresponding to different heart beats, are typically assembled into a feature matrix. Each row of the matrix contains a single feature vector and has length two and corresponds to a single observation or beat. The columns of the feature matrix are as long as the number of observations. These energies are then classified by a linear classifier which performs a least squares analysis of the data to linearly combine the two energies for a beat so as to provide a single output for each beat. The respective outputs for pre-intervention and post-intervention are then averaged to provide a single result for pre-intervention and a single result for post-intervention. Finally, these single pre-intervention and post-intervention results are compared to determine if a change has resulted from the intervention. Alternatively, pre-intervention data could be analyzed as described above and this single output could be compared against a standard to determine the presence of CAD in a patient. Thus, the present invention may be utilized for both predicting and tracking CAD in patients.
8. Signal to Noise Ratio Enhancement
One method for enhancing the S/N of a signal comprises:
(i) providing an array of sensors positioned on the chest of a patient in an area above the patient's heart;
(ii) performing a band limited cross-correlation of the signals in a specified frequency range;
wherein two matrices, one of maximum cross-correlation values and one of the associated lags are generated;
(iii) computing the optimal weights w* for each channel (see Appendix B);
(iv) realigning said signals in said frequency range;
(v) linearly combining using the optimal weights said realigned channels in the said frequency range;
wherein the linear combination is formed according to the following equation (see Appendix B): y = i = 1 N w i * x i
Figure US06278890-20010821-M00030
where:
y=single signal is combination of N sensor channels,
wi*=weight for the ith channel,
xi=signal from the ith channel.
Equation 37 EXEMPLIFICATION OF THE INVENTION EXAMPLE 1
FIG. 33 shows spectrograms generated by a nine sensor array as shown in FIG. 6. The array was approximately centered at the third intercostal space at the left sternal border of the patient. The sensors were affixed to the patient's chest with double-sided adhesive pads. A computer-based clinical work station as generally described in the specification was used to digitize and record the acoustic signals from multiple cardiac cycles. The recorded signals of each sensor were described by the workstation signal conditioning circuitry with overlapping time windows and fast Fourier transformed to produce spectrograms of each heart. FIG. 33 displays the results of a single beat for each of the nine sensors.
EXAMPLE 2
FIG. 34 is a computer-generated illustration of the volumetric beamformer output indicating the origin of an acoustic shear-wave viewed in three dimensions using multiple cutting planes along the Z-axis. The acoustic image is obtained from the inverse path model of a nine-element array of sensors as shown by FIG. 6 using the conventional beamformer as described herein. The shear-wave source is correctly identified by the dense (red) plot located at coordinates X=0, Y=0, Z=7.5 centimeters.
Specifically:
1. Acoustic data for each of the nine sensor locations was generated by delaying the signal from the source location in the volume under the array to each sensor, according to the path length from source to sensor, and the wave speed dispersion as a function of frequency, as known for shear wave propagation in the visco-elastic material having properties of human tissue.
2. Incoherent noise at a level equal to that of the acoustic data signal was added to the signal at each sensor, thus creating a signal-to-noise ratio of 0 dB.
3. The conventional beamformer algorithm was applied to the array signals to produce a value of spatial coherence at each location in the volume beneath the array.
4. The magnitude of coherence was mapped to a color scale along planes arranged in the volume to create a three-dimensional display predicting source location.
EXAMPLE 3
FIG. 35 shows volumetric acoustic images of data obtained from in vitro tests in a gelatin volume. The figures illustrate the effect of six different degrees of occlusion, 25% to 90%, at steady anatomical flow. A nine sensor array similar to that shown by FIG. 6 was used.
EXAMPLE 4
FIGS. 36A and 36B are a side-by-side comparison of the acoustic and radiographic images in the region of a 75% coronary lesion in a patient having coronary artery disease. The non-invasive, in vivo acoustic image, FIG. 36A, was obtained in substantially the same manner as in Example 1. Specifically:
1. The computer-based clinical workstation with appropriate signal conditioning circuitry was used to digitize and record the acoustic signals during an interval of several seconds.
2. The conventional beamformer algorithm was applied to the array signals to produce a value of spatial coherence at each location in the volume beneath the array.
3. The magnitude of coherence was mapped to a color scale along planes arranged in the volume to create a three-dimensional display predicting source location.
4. A radiographic image, FIG. 36B, of the coronary tree of a patient was produced using the known methods of coronary angiography, and aligned to the spatial reference of the acoustic image using radiopaque markers placed at the locations of the nine sensors of the acoustic array.
5. The acoustic image, FIG. 36A, and angiographic image, FIG. 37B, were compared at the location of the lesion.
The radiographic and acoustic images were two-dimensional, anterior-posterior views. The acoustic image correctly indicates the origin of a turbulent shear source just downstream from the 75% coronary occlusion.
EXAMPLE 5
FIGS. 37A and 37B are three-dimensional in vivo volumetric acoustic images at the location of two coronary lesions separated by a few centimeters in the left anterior descending coronary artery of a patient having coronary artery disease. The left image in FIG. 37A is produced in substantially the same manner as in Example 1. An intervention was performed whereby the patient receives treatment by placement of two stents to repair the stenoses. A second volumetric acoustic image, FIG. 37B, produced post-intervention in like manner. The volumetric acoustic images, FIGS. 37A and 37B, were compared.
FIG. 37A shows the turbulent sources prior to surgical intervention. FIG. 37B shows the same cardiac region seventeen hours after two stents were placed in the artery to correct the stenoses. The images measure five centimeters on each edge of the volumetric cube, and were created using the conventional beamformer described herein.
EXAMPLE 6
FIGS. 38 and 39 illustrate an example of non-invasive, in vivo detection of change in a patient's acoustic features obtained using the nine-element sensor array described in FIG. 6 and time-alignment signal processing, referring to FIG. 38A, acoustic energy at high and low frequencies for a patient having coronary artery stenosis is shown by the points scattered in the upper section of the plot. Following surgical intervention to repair the coronary lesion, the acoustic energy appears clustered at the lower left.
The pre- and post-intervention feature data illustrated by FIG. 38 was classified by beat number. FIG. 39 is a plot of beat number against classifier output. The pre-intervention beats subclass appears in the upper left quadrant of FIG. 39, wherein the post-intervention beats appear in the lower right quadrant of FIG. 39.
Specifically:
1. Patient acoustic signals are acquired as described in Example 3.
2. Patient acoustic signals were acquired using steps 1 and 2 of Example 2.
3. Diastolic interval data from each channel and each beat are extracted.
4. A cross-correlation across channels was performed to obtain optimal weights and time lags. The data of each channel is then weighted in amplitude, shifted in time to align the wave arrivals, and summed.
5. The combined (summed) data from each beat was transformed into the frequency domain using FFT methods.
6. For each beat, the frequency domain data was summed over low and high feature bands for frequency bands of approximately 200 Hz-600 Hz to produce a low frequency estimator, and over frequency bands of approximately 600 Hz to 1,800 Hz to produce a high frequency estimator.
7. The results for pre-intervention and post-intervention low and high frequency estimators were plotted for comparison.
EXAMPLE 7 Non-invasive Detection of CAD Change
The methods for non-invasive detection of changes in CAD as described in the specification were applied to patients taking part in a controlled study conducted at two research hospitals. A passive acoustic sensor array was used to acquire data from 44 patients before (pre) and after (post) percutaneous coronary intervention. Acoustic features were extracted from the mid-diastolic sounds measured from multiple cardiac cycles in each patient. A training sample, using data from half of the cardiac cycles was used in a feature separation algorithm to separate the pre and post acoustic features for each patient. The remaining acoustic features were used to validate the separation algorithm. Non-invasively detected acoustic feature changes after successful percutaneous intervention indicate changes in CAD. Using this technique, the acoustic features differentiated the status of the patient (pre vs. post) in 41 of 44 patients (93%). See Table A.
EXAMPLE 8 Comparative Example to Demonstrate S/N Ratio Enhancement
The Table A data shows that the method of optimally combining the signals from multiple sensors, described previously, ensures the highest performance of the non-invasive methods of detecting changes in coronary artery stenosis as described. Table A also illustrates the method of the invention for enhancing the signal to noise ratio of acoustic abnormal blood flow signals. No single channel produces better results than this method. To demonstrate the benefit of S/N ratio enhancement achieved by optimally combining the sensor data from the array, the technique used for non-invasive detection of stenosis change has been applied to patient data as described in Example 7 using three different approaches. The first approach uses features extracted from the optimally combined channels. The second and third approaches used features extracted from single channel data. In the second approach, the channel with the maximum energy was used. In the third approach, the channel with the minimum energy was used. All other aspects of the method for detecting changes in stenosis were kept the same. The channel with the highest S/N ratio is deemed to have the highest total energy also. The method does not perform as well using the single sensor with the highest S/N ratio compared to the enhancement achieved by optimally combining the signals from the array sensors. Clearly, the performance is much worse for a poorly placed sensor with relatively low S/N ratio.
TABLE A
# OF DETECTIONS/ %
METHOD # OF PATIENTS DETECTION
Optimally Combining Channels 41/44 93.2
Maximum Energy 39/44 88.6
Minimum Energy 35/44 79.5

Claims (37)

We claim:
1. A non-invasive, in vivo, method for detecting change in coronary artery stenosis which comprises the steps of:
(i) procuring a plurality of heart sound data sets which are indicative of a stenosis in a patient's coronary artery
wherein each of said data sets is procured at a different time,
(ii) comparing at least two of the data sets to identify selected differences between said sets,
wherein a difference identified in said comparing step corresponds to a change in the coronary artery stenosis of the patient.
2. The claim 1 method wherein said heart sound data sets is comprised of sets of data generated by an array of acoustic sensors positioned on the chest of said patient.
3. The claim 1 method, wherein said heart sound data sets are sets of heart sound data generated by sensing shear waves.
4. The claim 1 method wherein said heart sound data sets exclude heart sound data generated by compression waves.
5. A method according to claim 1, wherein said procuring step comprises the steps of:
placing an array of sensors on an area of the body surface of a patient above a volume of said body which may include abnormal blood flow, wherein each of said sensors in said array includes means to receive sounds caused by blood flow in said volume of said patient's body and to generate electrical signals from said sounds, and
combining said electrical signals generated by a plurality of said sensors in said array for each of said data sets obtained at different times,
wherein said comparing step includes the step of providing a display of the spatial distribution of phase coherence in said combined electrical signal, and wherein abnormal blood flow in said volume of said patient's body is indicated by non-uniformity in said display of said spatial distribution of said phase coherence.
6. A method according to claim 1, wherein said procuring step comprises the steps of:
(i) positioning a plurality of sensors in an array on an area of a patient's body above a volume of said patient's body in which abnormal blood flow may be present; and
(ii) beamforming said plurality of sensors to provide a beamformer output; and
wherein said comparing step includes the step of processing said beamformer output to detect said abnormal blood flow, if present, in said vessel of said patient.
7. A method according to claim 6, wherein said beamformer output is provided by a beam steering angle of from 30 to 30° as a function of the number of sensors of when the source of the formed beam is at infinity.
8. The method of claim 6, wherein an adjustable gain/resolution null space beamformer is used to provide said beamformer output.
9. A method according to claim 6, wherein the plurality of sensors comprises sensors having a stretched piezolelectric film transducer.
10. A method according to claim 1, wherein said comparing step detects abnormal blood flow in a vessel of a patient wherein the abnormal blood flow is caused by a partial occlusion of the vessel, wherein the abnormal blood flow produces sounds detectable at the surface of said patient's body, and wherein said procuring step comprises the steps of:
(i) positioning a plurality of sensors in an array on an area of the body surface of the patient above a vessel which may include the partial occlusion,
(ii) detecting sounds from the sensors caused by abnormal blood flow if present in the vessel of the patient;
(iii) generating electrical signals responsive to said detecting step the electrical signals which includes a compression wave component and a shear wave component;
(iv) locating each of said sensors on the surface of the body of said patient; and
(v) isolating said shear wave component, if present therein, from said plurality of electrical signals transmitted by said plurality of sensors; and
wherein said comparing step comprises processing said isolated shear wave component to detect if there is an occlusion present in the vessel of the patient.
11. The method of claim 10, further comprising the step of providing a display indicative of the occlusion if present in the vessel of the patient.
12. The method claim 10, wherein said shear wave component is isolated in step (v) by blocking the compression wave component in said signals transmitted by said sensors.
13. The method of claim 10, wherein said locating step is performed such the physical location on the subject is identified by photogrammetry.
14. The method of claim 10, wherein said compression wave component is blocked by velocity filtering or by steering a null at the source of said compression wave.
15. A method for non-invasively detecting a change in coronary artery stenosis, comprising the steps of:
positioning a first sensor array on the skin of a patient;
obtaining a first set of acoustic data from the sensor array at a first time;
removing the sensor array from the skin of the patient;
positioning a second sensor array on the skin of a patient;
obtaining a second set of acoustic data from the sensor array at a second time, the second time being temporally separate from the first time;
comparing the first and second acoustic data sets; and
determining a change in coronary artery stenosis in the patient based on said comparing step.
16. A method according to claim 15, wherein said comparing step includes identifying high and low energy features associated with the first and second data sets.
17. A method according to claim 15, further comprising the step of obtaining an ECG of the patient, and wherein said comparing step considers the ECG of the patient.
18. A method according to claim 17, wherein said comparing step comprises the step of parsing the first and second acoustic data sets to synchronize the data to the heartbeats of a patient.
19. A method according to claim 18, wherein said comparing step further comprises the steps of:
averaging the parsed data across a plurality of heartbeats of the patient; and
beamforming the averaged data into the time domain.
20. A method according to claim 19, wherein said comparing step comprises the step of extracting selected energy features at two frequencies associated with the first and second data sets, and wherein the extracted energy features of each of the first and second data sets are used in said determining step.
21. A method according to claim 20, wherein said selected energy features include a first energy feature at a first frequency which is between 200-600 Hz and a second energy feature at a second frequency higher than the first frequency, the second frequency being between 600-1800 Hz.
22. A method according to claim 15, wherein the first data set is obtained before and the second data set obtained after an interventional treatment has been performed on the patient.
23. A method according to claim 22, wherein said determining step estimates the change in the size of a stenotic coronary lesion.
24. A method according to claim 15, wherein the acoustic data includes data which corresponds to shear wave data acquired during the second quarter of the diastolic period of a patient.
25. A method according to claim 15, further comprising the step of acquiring ambient noise information which may impact the reliability of the sensed acoustic data.
26. A method according to claim 20, wherein said comparing step further comprises the step of classifying the extracted energy features per beat into a first subclass associated with pre-intervention data and a second subclass associated with post intervention data.
27. A method according to claim 26, further comprising the step of averaging the first and second data subclasses from said classifying step across beats.
28. A method according to claim 27, further comprising the step of plotting the classified subclass data associated with the pre- and post-intervention at the two selected frequencies.
29. A method according to claim 28, wherein said comparing step considers the number of data points at each of the two frequencies for the pre- and post-intervention subclass data in said plotting step.
30. A method according to claim 15, further comprising the step of generating a time series of acoustic images, wherein one said acoustic image is from the first acoustic data set at the first time and another of said acoustic image is from the second acoustic data at the second time.
31. A method according to claim 30, wherein the acoustic images are three-dimensional.
32. A method according to claim 15, wherein the first and second acoustic data is multi-channel data obtained for each heartbeat.
33. A method according to claim 15, wherein the obtaining steps include obtaining multi-channel acoustic data for a plurality of heartbeats, said method further comprising the step of screening each of the first and second acoustic data sets obtained for each heartbeat to select which to include in said comparing step.
34. A method according to claim 33, wherein all channel data corresponding to a particular heartbeat is retained together or rejected together.
35. A method for identifying post-intervention changes in coronary heart stenosis which comprises:
(i) providing energy feature data indicative of coronary artery stenosis extracted from heartbeats of a patient before intervention;
(ii) providing energy feature data indicative of coronary artery stenosis extracted from heartbeats of a patient after intervention;
(iii) pooling all of said feature data from all pre-intervention and all post-intervention data from said heart beats of said patient;
(iv) classifying said feature data pooled in step (iii) wherein a classifier output is produced for each pre-intervention beat and each post-intervention beat of said patient's heart; and
(v) separately averaging said pre-intervention and post-intervention classifier output data produced in step
(iv) across said beats; and (vi) determining the difference between the average of the pre-intervention and the average of the post-intervention classifier outputs obtained in step (v);
wherein a risk of coronary heart disease may be indicated when said difference in said average output from said post-intervention classifier outputs is equal to or greater than the average of said post-intervention classifier outputs.
36. A non-invasive, in vivo method for detecting coronary artery stenosis change over time which comprises:
(i) providing an array of acoustic sensors positioned on a patient's chest
wherein said sensors detect S1, S2 and quiet interval sounds produced by said patient's heart and convert said sounds to an electrical signal and
wherein said electrical signal includes a heart sound component and a noise component;
(ii) amplifying particular signal to noise ratio from said electrical signal;
(iii) subjecting said amplified electrical signal to signal processing to provide a processed signal having an increased signal to noise ratio;
(iv) isolating the portion of said processed signal of step (iii) which corresponds to the quiet interval in said patient's heart sounds detected by said sensors in step (i);
(v) subjecting quiet interval signals isolated in step (iv) to visual screening wherein portions of said quiet interval signals attributable to breath sounds or transient noise are rejected and other portions of said signal are accepted;
(vi) subjecting said quiet interval signals isolated in step (iv) to aural screening wherein a portion of said signal is bandpass filtered from 500 Hz to 1800 Hz wherein regions with noise interference indicative of breathing sounds or cable noises or room noises or speech or bowel sounds are rejected;
(vii) identifying and correlating portions of the patient's heart sound signal residual after step (vi) with first, second and third beats of said patient's heart with corresponding first, second and third signal channels;
(viii) providing a time alignment of said first, second and third channels;
(ix) assigning optimal weights to each of said time aligned signals;
(x) computing two energy-based features from said time aligned and optimally weighted signals
wherein a first energy based feature is computed at a low frequency from 200 Hz to 600 Hz and
wherein a second energy based feature is calculated at a frequency of 600 Hz to 1800 Hz.
37. A method for acquiring and preprocessing data in preparation for signal analysis to detect changes in coronary artery stenosis which comprises:
(i) providing a fixed array of sensors conformable to the chest of a patient;
wherein said sensors detect cardiac sounds in said chest of said patient and convert said blood flow sounds to electrical signals;
(ii) placing said array on the chest of said patient in an area above said patient's heart, wherein the patient's heart beat generates S1, S2, S3, S4 and other cardiac sounds;
(iii) converting said cardiac sounds into engineering units of acceleration wherein said units of accelerator constitute said signals to be analyzed;
(iv) segmenting said signals into acceleration units identifying individual beats of said patient's heart;
(v) providing a real time window between said S2 and S1 sounds of each of said individual beats of said patient's heart; and
(vi) subjecting said S1 and SS sounds to quality inspection of said sounds.
US09/188,510 1997-11-10 1998-11-09 Non-invasive turbulent blood flow imaging system Expired - Fee Related US6278890B1 (en)

Priority Applications (3)

Application Number Priority Date Filing Date Title
US09/188,510 US6278890B1 (en) 1998-11-09 1998-11-09 Non-invasive turbulent blood flow imaging system
US09/293,199 US6243599B1 (en) 1997-11-10 1999-04-16 Methods, systems and computer program products for photogrammetric sensor position estimation
US09/828,565 US6574494B2 (en) 1997-11-10 2001-04-06 Methods, systems and computer program products for photogrammetric sensor position estimation

Applications Claiming Priority (1)

Application Number Priority Date Filing Date Title
US09/188,510 US6278890B1 (en) 1998-11-09 1998-11-09 Non-invasive turbulent blood flow imaging system

Related Parent Applications (1)

Application Number Title Priority Date Filing Date
PCT/US1997/020186 Continuation WO1999023940A1 (en) 1997-11-10 1997-11-10 Non-invasive turbulent blood flow imaging system

Related Child Applications (2)

Application Number Title Priority Date Filing Date
US09/293,199 Continuation US6243599B1 (en) 1997-11-10 1999-04-16 Methods, systems and computer program products for photogrammetric sensor position estimation
US09/293,199 Continuation-In-Part US6243599B1 (en) 1997-11-10 1999-04-16 Methods, systems and computer program products for photogrammetric sensor position estimation

Publications (1)

Publication Number Publication Date
US6278890B1 true US6278890B1 (en) 2001-08-21

Family

ID=22693462

Family Applications (3)

Application Number Title Priority Date Filing Date
US09/188,510 Expired - Fee Related US6278890B1 (en) 1997-11-10 1998-11-09 Non-invasive turbulent blood flow imaging system
US09/293,199 Expired - Fee Related US6243599B1 (en) 1997-11-10 1999-04-16 Methods, systems and computer program products for photogrammetric sensor position estimation
US09/828,565 Expired - Fee Related US6574494B2 (en) 1997-11-10 2001-04-06 Methods, systems and computer program products for photogrammetric sensor position estimation

Family Applications After (2)

Application Number Title Priority Date Filing Date
US09/293,199 Expired - Fee Related US6243599B1 (en) 1997-11-10 1999-04-16 Methods, systems and computer program products for photogrammetric sensor position estimation
US09/828,565 Expired - Fee Related US6574494B2 (en) 1997-11-10 2001-04-06 Methods, systems and computer program products for photogrammetric sensor position estimation

Country Status (1)

Country Link
US (3) US6278890B1 (en)

Cited By (58)

* Cited by examiner, † Cited by third party
Publication number Priority date Publication date Assignee Title
US20020180605A1 (en) * 1997-11-11 2002-12-05 Ozguz Volkan H. Wearable biomonitor with flexible thinned integrated circuit
US6699201B2 (en) 1998-11-09 2004-03-02 Medacoustics, Inc. Acoustic window identification
US6716169B2 (en) * 2000-08-24 2004-04-06 Seiko Instruments Inc. Ultrasonic sensor, method of fabricating same, and ultrasonic diagnostic device using an ultrasonic sensor
US20040249293A1 (en) * 2001-01-16 2004-12-09 Sandler Richard H. Acoustic detection of vascular conditions
US20040260180A1 (en) * 2001-08-20 2004-12-23 Hiroshi Kanai Tissue identifying method in ultrasonography and ultrasonograph
US20050038360A1 (en) * 2003-04-23 2005-02-17 Hemchandra Shertukde Apparatus and method for non-invasive diagnosing of coronary artery disease
US20050113674A1 (en) * 2003-11-26 2005-05-26 Salla Prathyusha K. Method and system for retrospective gating using multiple inputs
US20050113672A1 (en) * 2003-11-26 2005-05-26 Salla Prathyusha K. Method and system for composite gating using multiple inputs
US20050113671A1 (en) * 2003-11-26 2005-05-26 Salla Prathyusha K. Method and system for estimating three-dimensional respiratory motion
US20050113673A1 (en) * 2003-11-26 2005-05-26 Avinash Gobal B. Method and system to reduce motion-related image artifacts during breath holding
US20050113670A1 (en) * 2003-11-26 2005-05-26 Salla Prathyusha K. Method and system for prospective gating using multiple inputs
US20050234349A1 (en) * 2004-02-10 2005-10-20 Pravica David W Methods, systems, and computer program products for analyzing cardiovascular sounds using eigen functions
US20050251047A1 (en) * 1999-03-01 2005-11-10 Medacoustics, Inc. Low profile acoustic sensor array and sensors with pleated transmission lines and related methods
US20050277288A1 (en) * 1997-11-11 2005-12-15 Volkan Ozguz Stackable semiconductor chip layer comprising prefabricated trench interconnect vias
US7037268B1 (en) 1999-03-01 2006-05-02 Medacoustics, Inc. Low profile acoustic sensor arry and sensors with pleated transmission lines and related methods
WO2006051466A1 (en) * 2004-11-15 2006-05-18 Koninklijke Philips Electronics N.V. Ambulatory medical telemetry device having an audio indicator
US20060184021A1 (en) * 2005-01-24 2006-08-17 Medison Co., Ltd. Method of improving the quality of a three-dimensional ultrasound doppler image
US20070036409A1 (en) * 2005-08-02 2007-02-15 Valadez Gerardo H System and method for automatic segmentation of vessels in breast MR sequences
US20070055151A1 (en) * 2005-01-20 2007-03-08 Shertukde Hemchandra M Apparatus and methods for acoustic diagnosis
WO2006121537A3 (en) * 2001-05-28 2007-11-15 Arvind Thiagarajan System and methods for gating heart signals
US20080039733A1 (en) * 2006-08-08 2008-02-14 Kamil Unver Systems and methods for calibration of heart sounds
US20080154144A1 (en) * 2006-08-08 2008-06-26 Kamil Unver Systems and methods for cardiac contractility analysis
US20080212839A1 (en) * 2003-11-26 2008-09-04 Ge Medical Systems Global Technology Company, Llc Method and system for determining a period of interest using multiple inputs
US20080273709A1 (en) * 2006-04-27 2008-11-06 Arvind Thiagarajan Systems and methods for tuning, analysis and display of heart sounds
US20100016718A1 (en) * 2008-07-16 2010-01-21 Siemens Medical Solutions Usa, Inc. Shear Wave Imaging
US20100198141A1 (en) * 2007-09-24 2010-08-05 Laitenberger Peter G Injection Monitor
US20120179041A1 (en) * 2009-11-17 2012-07-12 Canon Kabushiki Kaisha Image forming apparatus and image forming method
US20120317444A1 (en) * 2010-01-28 2012-12-13 Hideaki Suzuki Monitoring and diagnosing device for working machine
US8761897B2 (en) 2012-08-31 2014-06-24 Greatbatch Ltd. Method and system of graphical representation of lead connector block and implantable pulse generators on a clinician programmer
US8757485B2 (en) 2012-09-05 2014-06-24 Greatbatch Ltd. System and method for using clinician programmer and clinician programming data for inventory and manufacturing prediction and control
US8812125B2 (en) 2012-08-31 2014-08-19 Greatbatch Ltd. Systems and methods for the identification and association of medical devices
US8868199B2 (en) 2012-08-31 2014-10-21 Greatbatch Ltd. System and method of compressing medical maps for pulse generator or database storage
US8903496B2 (en) 2012-08-31 2014-12-02 Greatbatch Ltd. Clinician programming system and method
US8983616B2 (en) 2012-09-05 2015-03-17 Greatbatch Ltd. Method and system for associating patient records with pulse generators
US9052230B2 (en) 2011-05-13 2015-06-09 Chevron U.S.A. Inc Industrial process monitoring and imaging
US9101274B2 (en) 2010-06-24 2015-08-11 Cvr Global, Inc. Sensor, sensor pad and sensor array for detecting infrasonic acoustic signals
US9180302B2 (en) 2012-08-31 2015-11-10 Greatbatch Ltd. Touch screen finger position indicator for a spinal cord stimulation programming device
US9226726B1 (en) 2014-11-25 2016-01-05 John L Semmlow Method and system for detection of cardiac sounds
US9259577B2 (en) 2012-08-31 2016-02-16 Greatbatch Ltd. Method and system of quick neurostimulation electrode configuration and positioning
US9375582B2 (en) 2012-08-31 2016-06-28 Nuvectra Corporation Touch screen safety controls for clinician programmer
US9471753B2 (en) 2012-08-31 2016-10-18 Nuvectra Corporation Programming and virtual reality representation of stimulation parameter Groups
US20160330131A1 (en) * 2015-05-05 2016-11-10 Avaya Inc. Automatic cloud capacity adjustment
US9507912B2 (en) 2012-08-31 2016-11-29 Nuvectra Corporation Method and system of simulating a pulse generator on a clinician programmer
US9594877B2 (en) 2012-08-31 2017-03-14 Nuvectra Corporation Virtual reality representation of medical devices
US9615788B2 (en) 2012-08-31 2017-04-11 Nuvectra Corporation Method and system of producing 2D representations of 3D pain and stimulation maps and implant models on a clinician programmer
US20170202541A1 (en) * 2016-01-15 2017-07-20 Butterfly Network, Inc. Ultrasound signal processing circuitry and related apparatus and methods
US9767255B2 (en) 2012-09-05 2017-09-19 Nuvectra Corporation Predefined input for clinician programmer data entry
US10039520B2 (en) 2005-04-13 2018-08-07 Aum Cardiovascular, Inc Detection of coronary artery disease using an electronic stethoscope
WO2019027693A1 (en) * 2017-07-31 2019-02-07 University Of Pittsburgh-Of The Commonwealth System Of Higher Education System for automatic and early detection of free flap failure
US10668276B2 (en) 2012-08-31 2020-06-02 Cirtec Medical Corp. Method and system of bracketing stimulation parameters on clinician programmers
WO2020160451A1 (en) * 2019-01-31 2020-08-06 The Medical College Of Wisconsin, Inc. Systems and methods for sound mapping of anatomical and physiological acoustic sources using an array of acoustic sensors
US10925573B2 (en) 2017-10-04 2021-02-23 Ausculsciences, Inc. Auscultatory sound-or-vibration sensor
US11045144B2 (en) 2017-10-20 2021-06-29 Ausculsciences, Inc. Coronary artery disease detection signal processing system and method
US11045163B2 (en) 2017-09-19 2021-06-29 Ausculsciences, Inc. Method of detecting noise in auscultatory sound signals of a coronary-artery-disease detection system
US11112473B2 (en) * 2011-08-31 2021-09-07 Insightec, Ltd. Systems and methods for avoiding MRI-originated interference with concurrently used systems
US11191486B2 (en) 2017-09-19 2021-12-07 Ausculsciences, Inc. System and method for detecting decoupling of an auscultatory sound sensor from a test-subject
US11284827B2 (en) 2017-10-21 2022-03-29 Ausculsciences, Inc. Medical decision support system
US11413653B2 (en) 2010-06-24 2022-08-16 Cvr Global, Inc. Sensor, sensor pad and sensor array for detecting infrasonic acoustic signals

Families Citing this family (19)

* Cited by examiner, † Cited by third party
Publication number Priority date Publication date Assignee Title
SE518620C2 (en) * 2000-11-16 2002-10-29 Ericsson Telefon Ab L M Stage construction and camera calibration with robust use of "cheers"
US6845178B1 (en) * 2001-06-27 2005-01-18 Electro Scientific Industries, Inc. Automatic separation of subject pixels using segmentation based on multiple planes of measurement data
US7031497B2 (en) * 2001-11-05 2006-04-18 Koninklijke Philips Electronics N.V. Method for computing optical flow under the epipolar constraint
JP2005515910A (en) * 2002-01-31 2005-06-02 ブレインテック カナダ インコーポレイテッド Method and apparatus for single camera 3D vision guide robotics
US20070035562A1 (en) * 2002-09-25 2007-02-15 Azuma Ronald T Method and apparatus for image enhancement
US7002551B2 (en) * 2002-09-25 2006-02-21 Hrl Laboratories, Llc Optical see-through augmented reality modified-scale display
US20040068758A1 (en) * 2002-10-02 2004-04-08 Mike Daily Dynamic video annotation
US20040066391A1 (en) * 2002-10-02 2004-04-08 Mike Daily Method and apparatus for static image enhancement
US7778328B2 (en) * 2003-08-07 2010-08-17 Sony Corporation Semantics-based motion estimation for multi-view video coding
WO2006135394A2 (en) * 2004-08-20 2006-12-21 The Regents Of The University Of Colorado, A Body Corporate Biometric signature and identification through the use of projective invariants
US7130725B2 (en) * 2004-12-17 2006-10-31 The United States Of America As Represented By The Administrator Of The National Aeronautics And Space Administration Method for correcting control surface angle measurements in single viewpoint photogrammetry
WO2008036354A1 (en) 2006-09-19 2008-03-27 Braintech Canada, Inc. System and method of determining object pose
US20110066020A1 (en) * 2008-03-13 2011-03-17 Alexander Svojanovsky Multi-channel eeg electrode system
US8559699B2 (en) 2008-10-10 2013-10-15 Roboticvisiontech Llc Methods and apparatus to facilitate operations in image based systems
CN102762152A (en) * 2009-12-08 2012-10-31 Aum心血管股份有限公司 Systems and methods for detecting cardiovascular disease
EP2741103B1 (en) * 2012-12-06 2018-04-11 Technion Research & Development Foundation Ltd. Frequency-domain beamforming
WO2019040004A1 (en) * 2017-08-25 2019-02-28 Maker Trading Pte Ltd Stereo machine vision system and method for identifying locations of natural target elements
CN111505651B (en) * 2020-04-22 2022-11-11 西北工业大学 Feature extraction method for potential moving object of active sonar echo map
CN113284179B (en) * 2021-05-26 2022-09-13 吉林大学 Robot multi-object sorting method based on deep learning

Citations (101)

* Cited by examiner, † Cited by third party
Publication number Priority date Publication date Assignee Title
US3442264A (en) 1964-06-04 1969-05-06 Joseph R Levitt Data processing method and means
US3573394A (en) 1967-09-14 1971-04-06 Ind Scient Research Corp Piezoelectric microphone with biasing means
US3799147A (en) 1972-03-23 1974-03-26 Directors University Cincinnat Method and apparatus for diagnosing myocardial infarction in human heart
US3903733A (en) 1972-11-20 1975-09-09 Kureha Chemical Ind Co Ltd Method of measuring vibrations by means of piezoelectric body and the apparatus therefor
US4008408A (en) 1974-02-28 1977-02-15 Pioneer Electronic Corporation Piezoelectric electro-acoustic transducer
US4054808A (en) 1974-08-19 1977-10-18 Matsushita Electric Industrial Co., Ltd. Vibration detecting device having a piezoelectric ceramic plate and a method for adapting the same for use in musical instruments
US4094308A (en) 1976-08-19 1978-06-13 Cormier Cardiac Systems, Inc. Method and system for rapid non-invasive determination of the systolic time intervals
US4146955A (en) 1977-08-15 1979-04-03 Harris Corporation Method of fabricating a stepped-array acousto-optic beam deflector
US4226248A (en) 1978-10-26 1980-10-07 Manoli Samir H Phonocephalographic device
US4234813A (en) 1978-04-10 1980-11-18 Toray Industries, Inc. Piezoelectric or pyroelectric polymer input element for use as a transducer in keyboards
US4255791A (en) 1978-12-04 1981-03-10 Harris Corporation Signal processing system
US4268912A (en) 1978-06-06 1981-05-19 Magnavox Government And Industrial Electronics Co. Directional hydrophone suitable for flush mounting
US4308870A (en) 1980-06-04 1982-01-05 The Kendall Company Vital signs monitor
US4376302A (en) 1978-04-13 1983-03-08 The United States Of America As Represented By The Secretary Of The Navy Piezoelectric polymer hydrophone
US4385255A (en) 1979-11-02 1983-05-24 Yokogawa Electric Works, Ltd. Linear array ultrasonic transducer
US4387378A (en) 1978-06-28 1983-06-07 Harris Corporation Antenna having electrically positionable phase center
US4406967A (en) 1980-08-23 1983-09-27 Kureha Kagaku Kogyo Kabushiki Kaisha Ultrasonic probe
US4413630A (en) 1976-04-05 1983-11-08 Diasonics Cardio/Imaging, Inc. Sector scanner display and recording system for ultrasonic diagnosis
US4424465A (en) 1979-05-16 1984-01-03 Toray Industries, Inc. Piezoelectric vibration transducer
US4428380A (en) 1980-09-11 1984-01-31 Hughes Aircraft Company Method and improved apparatus for analyzing activity
DE3234584A1 (en) 1982-09-17 1984-03-22 Reinhard 8206 Bruckmühl Fuchs Structure-borne sound pick-up of piezo-electric flexion pick-ups
US4458693A (en) 1981-03-13 1984-07-10 Medtronic, Inc. Monitoring system
FR2507424B1 (en) 1981-06-05 1984-09-14 Cgr
US4491051A (en) 1980-02-22 1985-01-01 Barcus Lester M String instrument pickup system
US4509527A (en) 1983-04-08 1985-04-09 Timex Medical Products Corporation Cardio-respiration transducer
US4546777A (en) 1981-03-06 1985-10-15 Siemens Gammasonics, Inc. Heart sound detector and synchronization for diagnostics
US4549551A (en) 1982-11-24 1985-10-29 Her Majesty The Queen In Right Of Canada, As Represented By The Minister Of National Defense Heart rate detector
DE3531399A1 (en) 1984-09-03 1986-03-13 Vickers PLC, London BREATHING CONTROL DEVICE
US4586514A (en) 1983-08-10 1986-05-06 Biotronics Instruments Phonoangiographic spectral analysing apparatus
USRE32180E (en) 1980-02-12 1986-06-10 Composite sheets constituting electromechanical transducers and transducers equipped with such sheets
EP0194823A2 (en) 1985-03-12 1986-09-17 BAXTER INTERNATIONAL INC. (a Delaware corporation) Medical electrode
EP0201421A1 (en) 1985-05-02 1986-11-12 Societe Industrielle De Liaisons Electriques - Silec Contact microphone pick-up with a piezo-polymeric membrane
US4628321A (en) 1982-04-14 1986-12-09 Harris Corporation Aperture transformation sidelobe canceller
US4630203A (en) 1983-12-27 1986-12-16 Thomas Szirtes Contour radiography: a system for determining 3-dimensional contours of an object from its 2-dimensional images
US4656385A (en) 1984-04-17 1987-04-07 Murata Manufacturing Co., Ltd. Housing having grooves therein for mounting a piezoelectric ladder filter
US4697597A (en) 1982-02-12 1987-10-06 Ernst Sanz Apparatus for cardiogoniometry
US4700712A (en) 1985-08-30 1987-10-20 Willi Studer Ag Method for determining the starting point and the end point of closed spatial signal patterns
US4712565A (en) 1986-10-27 1987-12-15 International Acoustics Incorporated Method and apparatus for evaluating of artificial heart valves
US4742458A (en) 1985-10-29 1988-05-03 Software Plus, Inc. Method and apparatus for performing pattern recognition analysis
US4777961A (en) 1985-10-15 1988-10-18 Bruce Saltzman High sensitivity stethoscopic system and method
US4781200A (en) 1985-10-04 1988-11-01 Baker Donald A Ambulatory non-invasive automatic fetal monitoring system
US4784154A (en) 1986-11-13 1988-11-15 Colin Electronics Co., Ltd. Interference resistant biomedical transducer
US4792145A (en) 1985-11-05 1988-12-20 Sound Enhancement Systems, Inc. Electronic stethoscope system and method
US4803996A (en) 1987-09-28 1989-02-14 Nippon Colin Co., Ltd. Cardiovascular monitor
US4803986A (en) 1987-04-24 1989-02-14 Minnesota Mining And Manufacturing Company Ergonometric transcutaneous electrical nerve stimulator
US4805633A (en) 1987-01-26 1989-02-21 Tdk Corporation Displacement sensor
US4812976A (en) 1983-07-22 1989-03-14 Lundy Research Laboratories, Inc. Method and apparatus for characterizing the unknown state of a physical system
US4821584A (en) 1988-03-15 1989-04-18 The United States Of America As Represented By The United States Department Of Energy Piezoelectric film load cell robot collision detector
US4840183A (en) 1987-08-13 1989-06-20 Tdk Corporation Electrocardiograph
US4842411A (en) 1986-02-06 1989-06-27 Vectron, Inc. Method of automatically measuring the shape of a continuous surface
US4862361A (en) 1985-06-05 1989-08-29 Massachusetts Institute Of Technology Methods and apparatus for monitoring cardiovascular regulation using heart rate power spectral analysis
US4862144A (en) 1987-04-21 1989-08-29 Tao Billy S K Movement monitor
US4862897A (en) 1985-11-05 1989-09-05 Sound Enhancement Systems, Inc. Electrocardiogram enhancement system and method
US4905706A (en) 1988-04-20 1990-03-06 Nippon Colin Co., Ltd. Method an apparatus for detection of heart disease
GB2188732B (en) 1986-04-07 1990-04-04 Micro Medical Ltd Portable computer apparatus for the display of a phonocardiogram and an electrocardiogram of a person
US4924875A (en) 1987-10-09 1990-05-15 Biometrak Corporation Cardiac biopotential analysis system and method
US4928705A (en) 1987-12-08 1990-05-29 University Of Pittsburgh Of The Commonwealth System Of Higher Education Acoustic aneurysm detector and associated method
US4947859A (en) 1989-01-25 1990-08-14 Cherne Medical, Inc. Bio-acoustic signal sensing device
US4957369A (en) 1989-01-23 1990-09-18 California Institute Of Technology Apparatus for measuring three-dimensional surface geometries
US4967760A (en) 1989-02-02 1990-11-06 Bennett Jr William R Dynamic spectral phonocardiograph
US4991581A (en) 1988-03-04 1991-02-12 Andries Tek R&D Limited Partnership Acoustic processing apparatus
US5002060A (en) 1988-06-16 1991-03-26 Dror Nedivi Medical monitoring system
US5002058A (en) 1986-04-25 1991-03-26 Intra-Sonix, Inc. Ultrasonic transducer
US5003605A (en) 1989-08-14 1991-03-26 Cardiodyne, Inc. Electronically augmented stethoscope with timing sound
US5010889A (en) 1988-02-04 1991-04-30 Bloodline Technology Intelligent stethoscope
US5012815A (en) 1989-02-02 1991-05-07 Yale University Dynamic spectral phonocardiograph
US5025809A (en) 1989-11-28 1991-06-25 Cardionics, Inc. Recording, digital stethoscope for identifying PCG signatures
US5035247A (en) 1987-12-31 1991-07-30 Jochen Heimann Sensor for non-invasive measurement of sound, pressure and vibration on the human body
US5036857A (en) 1989-10-26 1991-08-06 Rutgers, The State University Of New Jersey Noninvasive diagnostic system for coronary artery disease
US5086776A (en) 1990-03-06 1992-02-11 Precision Diagnostics, Inc. Apparatus and method for sensing cardiac performance
US5109863A (en) 1989-10-26 1992-05-05 Rutgers, The State University Of New Jersey Noninvasive diagnostic system for coronary artery disease
US5129403A (en) 1988-04-14 1992-07-14 The United States Of America As Represented By The Secretary Of The Navy Method and apparatus for detecting and transducing intersaccular acoustic signals
US5140992A (en) 1990-07-16 1992-08-25 The United States Of America As Represented By The Administrator Of The National Aeronautics And Space Administration Passive fetal monitoring sensor
US5164627A (en) 1988-07-26 1992-11-17 Harris Corporation Phased array acoustic signal processor
US5176153A (en) 1990-11-02 1993-01-05 Eberhardt Allen C Heart chamber simulator with electronic accelerated heart valve wear and fatigue test apparatus and method
US5213108A (en) 1988-02-04 1993-05-25 Blood Line Technology, Inc. Visual display stethoscope
US5218969A (en) 1988-02-04 1993-06-15 Blood Line Technology, Inc. Intelligent stethoscope
US5301679A (en) 1991-05-31 1994-04-12 Taylor Microtechnology, Inc. Method and system for analysis of body sounds
US5315512A (en) 1989-09-01 1994-05-24 Montefiore Medical Center Apparatus and method for generating image representations of a body utilizing an ultrasonic imaging subsystem and a three-dimensional digitizer subsystem
US5337752A (en) 1992-05-21 1994-08-16 Mcg International, Inc. System for simultaneously producing and synchronizing spectral patterns of heart sounds and an ECG signal
US5363401A (en) 1993-02-25 1994-11-08 Harris Corporation Mechanism for extracting hybrid (fh/ds) spread spectrum signals within multi-signal type environment
US5365937A (en) 1992-09-09 1994-11-22 Mcg International, Inc. Disposable sensing device with contaneous conformance
US5381804A (en) 1992-10-15 1995-01-17 Aspect Medical Systems, Inc. Monitor and method for acquiring and processing electrical signals relating to bodily functions
US5455385A (en) 1993-06-28 1995-10-03 Harris Corporation Multilayer LTCC tub architecture for hermetically sealing semiconductor die, external electrical access for which is provided by way of sidewall recesses
US5501229A (en) 1994-08-01 1996-03-26 New England Medical Center Hospital Continuous monitoring using a predictive instrument
US5553113A (en) 1994-11-18 1996-09-03 Analogic Corporation Auxiliary data acquisition in a medical imaging system
EP0528279B1 (en) 1991-08-09 1996-12-04 Kureha Kagaku Kogyo Kabushiki Kaisha Flexible piezoelectric device
US5595188A (en) 1995-07-26 1997-01-21 Flowscan, Inc. Assembly process for polymer-based acoustic differential-output sensor
US5598845A (en) 1995-11-16 1997-02-04 Stellartech Research Corporation Ultrasound transducer device for continuous imaging of the heart and other body parts
US5618869A (en) 1994-12-19 1997-04-08 Sumitomo Rubber Industries, Ltd. Rubber composition for treads of studless tires
US5638823A (en) 1995-08-28 1997-06-17 Rutgers University System and method for noninvasive detection of arterial stenosis
US5673702A (en) 1994-06-10 1997-10-07 Cambridge Heart, Inc. Method and apparatus for the improved electronic display of physiologic waveforms
US5680513A (en) 1994-08-19 1997-10-21 Hyland; David C. Series parallel approach to identification of dynamic systems
US5686917A (en) 1995-04-19 1997-11-11 National Instruments Corporation System and method for demultiplexing data in an instrumentation system
US5687738A (en) 1995-07-03 1997-11-18 The Regents Of The University Of Colorado Apparatus and methods for analyzing heart sounds
US5705365A (en) 1995-06-07 1998-01-06 Gen-Probe Incorporated Kits for determining pre-amplification levels of a nucleic acid target sequence from post-amplification levels of product
US5724983A (en) 1994-08-01 1998-03-10 New England Center Hospitals, Inc. Continuous monitoring using a predictive instrument
US5724967A (en) 1995-11-21 1998-03-10 Nellcor Puritan Bennett Incorporated Noise reduction apparatus for low level analog signals
US5724968A (en) 1993-12-29 1998-03-10 First Opinion Corporation Computerized medical diagnostic system including meta function
US5796920A (en) 1994-08-19 1998-08-18 Harris Corporation Multiprocessor system and method for identification and adaptive control of dynamic systems
US5885222A (en) 1993-08-30 1999-03-23 Medacoustics, Inc. Disposable acoustic pad sensors

Family Cites Families (7)

* Cited by examiner, † Cited by third party
Publication number Priority date Publication date Assignee Title
US4509227A (en) 1982-09-30 1985-04-09 Whirlpool Corporation Three-piece swivel caster having a force transfer roller
US5645065A (en) * 1991-09-04 1997-07-08 Navion Biomedical Corporation Catheter depth, position and orientation location system
US5713367A (en) 1994-01-26 1998-02-03 Cambridge Heart, Inc. Measuring and assessing cardiac electrical stability
US6088294A (en) * 1995-01-12 2000-07-11 Baker Hughes Incorporated Drilling system with an acoustic measurement-while-driving system for determining parameters of interest and controlling the drilling direction
US5617869A (en) 1995-06-16 1997-04-08 The United States Of America As Represented By The Secretary Of The Navy Device and method for locating flow blockage in a three-dimensional object
US5755571A (en) * 1996-09-09 1998-05-26 The United States Of America As Represented By The Administrator Of The National Aeronautics And Space Administration Differential measurement periodontal structures mapping system
EP0940652B1 (en) * 1998-03-05 2004-12-22 Nippon Telegraph and Telephone Corporation Surface shape recognition sensor and method of fabricating the same

Patent Citations (104)

* Cited by examiner, † Cited by third party
Publication number Priority date Publication date Assignee Title
US3442264A (en) 1964-06-04 1969-05-06 Joseph R Levitt Data processing method and means
US3573394A (en) 1967-09-14 1971-04-06 Ind Scient Research Corp Piezoelectric microphone with biasing means
US3799147A (en) 1972-03-23 1974-03-26 Directors University Cincinnat Method and apparatus for diagnosing myocardial infarction in human heart
US3903733A (en) 1972-11-20 1975-09-09 Kureha Chemical Ind Co Ltd Method of measuring vibrations by means of piezoelectric body and the apparatus therefor
US4008408A (en) 1974-02-28 1977-02-15 Pioneer Electronic Corporation Piezoelectric electro-acoustic transducer
US4054808A (en) 1974-08-19 1977-10-18 Matsushita Electric Industrial Co., Ltd. Vibration detecting device having a piezoelectric ceramic plate and a method for adapting the same for use in musical instruments
US4413630A (en) 1976-04-05 1983-11-08 Diasonics Cardio/Imaging, Inc. Sector scanner display and recording system for ultrasonic diagnosis
US4413630B1 (en) 1976-04-05 1994-04-05 Diasonics Delaware Inc Sector scanner display and recording system for ultrasonic diagnosis
US4094308A (en) 1976-08-19 1978-06-13 Cormier Cardiac Systems, Inc. Method and system for rapid non-invasive determination of the systolic time intervals
US4146955A (en) 1977-08-15 1979-04-03 Harris Corporation Method of fabricating a stepped-array acousto-optic beam deflector
US4234813A (en) 1978-04-10 1980-11-18 Toray Industries, Inc. Piezoelectric or pyroelectric polymer input element for use as a transducer in keyboards
US4376302A (en) 1978-04-13 1983-03-08 The United States Of America As Represented By The Secretary Of The Navy Piezoelectric polymer hydrophone
US4268912A (en) 1978-06-06 1981-05-19 Magnavox Government And Industrial Electronics Co. Directional hydrophone suitable for flush mounting
US4387378A (en) 1978-06-28 1983-06-07 Harris Corporation Antenna having electrically positionable phase center
US4226248A (en) 1978-10-26 1980-10-07 Manoli Samir H Phonocephalographic device
US4255791A (en) 1978-12-04 1981-03-10 Harris Corporation Signal processing system
US4424465A (en) 1979-05-16 1984-01-03 Toray Industries, Inc. Piezoelectric vibration transducer
US4385255A (en) 1979-11-02 1983-05-24 Yokogawa Electric Works, Ltd. Linear array ultrasonic transducer
USRE32180E (en) 1980-02-12 1986-06-10 Composite sheets constituting electromechanical transducers and transducers equipped with such sheets
US4491051A (en) 1980-02-22 1985-01-01 Barcus Lester M String instrument pickup system
US4308870A (en) 1980-06-04 1982-01-05 The Kendall Company Vital signs monitor
US4406967A (en) 1980-08-23 1983-09-27 Kureha Kagaku Kogyo Kabushiki Kaisha Ultrasonic probe
US4428380A (en) 1980-09-11 1984-01-31 Hughes Aircraft Company Method and improved apparatus for analyzing activity
US4546777A (en) 1981-03-06 1985-10-15 Siemens Gammasonics, Inc. Heart sound detector and synchronization for diagnostics
US4458693A (en) 1981-03-13 1984-07-10 Medtronic, Inc. Monitoring system
FR2507424B1 (en) 1981-06-05 1984-09-14 Cgr
US4697597A (en) 1982-02-12 1987-10-06 Ernst Sanz Apparatus for cardiogoniometry
US4628321A (en) 1982-04-14 1986-12-09 Harris Corporation Aperture transformation sidelobe canceller
DE3234584A1 (en) 1982-09-17 1984-03-22 Reinhard 8206 Bruckmühl Fuchs Structure-borne sound pick-up of piezo-electric flexion pick-ups
US4549551A (en) 1982-11-24 1985-10-29 Her Majesty The Queen In Right Of Canada, As Represented By The Minister Of National Defense Heart rate detector
US4509527A (en) 1983-04-08 1985-04-09 Timex Medical Products Corporation Cardio-respiration transducer
US4812976A (en) 1983-07-22 1989-03-14 Lundy Research Laboratories, Inc. Method and apparatus for characterizing the unknown state of a physical system
US4586514A (en) 1983-08-10 1986-05-06 Biotronics Instruments Phonoangiographic spectral analysing apparatus
US4630203A (en) 1983-12-27 1986-12-16 Thomas Szirtes Contour radiography: a system for determining 3-dimensional contours of an object from its 2-dimensional images
US4656385A (en) 1984-04-17 1987-04-07 Murata Manufacturing Co., Ltd. Housing having grooves therein for mounting a piezoelectric ladder filter
DE3531399A1 (en) 1984-09-03 1986-03-13 Vickers PLC, London BREATHING CONTROL DEVICE
EP0194823A2 (en) 1985-03-12 1986-09-17 BAXTER INTERNATIONAL INC. (a Delaware corporation) Medical electrode
EP0201421A1 (en) 1985-05-02 1986-11-12 Societe Industrielle De Liaisons Electriques - Silec Contact microphone pick-up with a piezo-polymeric membrane
US4862361A (en) 1985-06-05 1989-08-29 Massachusetts Institute Of Technology Methods and apparatus for monitoring cardiovascular regulation using heart rate power spectral analysis
US4700712A (en) 1985-08-30 1987-10-20 Willi Studer Ag Method for determining the starting point and the end point of closed spatial signal patterns
US4781200A (en) 1985-10-04 1988-11-01 Baker Donald A Ambulatory non-invasive automatic fetal monitoring system
US4777961A (en) 1985-10-15 1988-10-18 Bruce Saltzman High sensitivity stethoscopic system and method
US4742458A (en) 1985-10-29 1988-05-03 Software Plus, Inc. Method and apparatus for performing pattern recognition analysis
US4792145A (en) 1985-11-05 1988-12-20 Sound Enhancement Systems, Inc. Electronic stethoscope system and method
US4862897A (en) 1985-11-05 1989-09-05 Sound Enhancement Systems, Inc. Electrocardiogram enhancement system and method
US4842411A (en) 1986-02-06 1989-06-27 Vectron, Inc. Method of automatically measuring the shape of a continuous surface
GB2188732B (en) 1986-04-07 1990-04-04 Micro Medical Ltd Portable computer apparatus for the display of a phonocardiogram and an electrocardiogram of a person
US5002058A (en) 1986-04-25 1991-03-26 Intra-Sonix, Inc. Ultrasonic transducer
US4712565A (en) 1986-10-27 1987-12-15 International Acoustics Incorporated Method and apparatus for evaluating of artificial heart valves
US4784154A (en) 1986-11-13 1988-11-15 Colin Electronics Co., Ltd. Interference resistant biomedical transducer
US4805633A (en) 1987-01-26 1989-02-21 Tdk Corporation Displacement sensor
US4862144A (en) 1987-04-21 1989-08-29 Tao Billy S K Movement monitor
US4803986A (en) 1987-04-24 1989-02-14 Minnesota Mining And Manufacturing Company Ergonometric transcutaneous electrical nerve stimulator
US4840183A (en) 1987-08-13 1989-06-20 Tdk Corporation Electrocardiograph
US4803996A (en) 1987-09-28 1989-02-14 Nippon Colin Co., Ltd. Cardiovascular monitor
US4924875A (en) 1987-10-09 1990-05-15 Biometrak Corporation Cardiac biopotential analysis system and method
US4928705A (en) 1987-12-08 1990-05-29 University Of Pittsburgh Of The Commonwealth System Of Higher Education Acoustic aneurysm detector and associated method
US5035247A (en) 1987-12-31 1991-07-30 Jochen Heimann Sensor for non-invasive measurement of sound, pressure and vibration on the human body
US5213108A (en) 1988-02-04 1993-05-25 Blood Line Technology, Inc. Visual display stethoscope
US5218969A (en) 1988-02-04 1993-06-15 Blood Line Technology, Inc. Intelligent stethoscope
US5010889A (en) 1988-02-04 1991-04-30 Bloodline Technology Intelligent stethoscope
US4991581A (en) 1988-03-04 1991-02-12 Andries Tek R&D Limited Partnership Acoustic processing apparatus
US4821584A (en) 1988-03-15 1989-04-18 The United States Of America As Represented By The United States Department Of Energy Piezoelectric film load cell robot collision detector
US5129403A (en) 1988-04-14 1992-07-14 The United States Of America As Represented By The Secretary Of The Navy Method and apparatus for detecting and transducing intersaccular acoustic signals
US4905706A (en) 1988-04-20 1990-03-06 Nippon Colin Co., Ltd. Method an apparatus for detection of heart disease
US5002060A (en) 1988-06-16 1991-03-26 Dror Nedivi Medical monitoring system
US5164627A (en) 1988-07-26 1992-11-17 Harris Corporation Phased array acoustic signal processor
US4957369A (en) 1989-01-23 1990-09-18 California Institute Of Technology Apparatus for measuring three-dimensional surface geometries
US4947859A (en) 1989-01-25 1990-08-14 Cherne Medical, Inc. Bio-acoustic signal sensing device
US5012815A (en) 1989-02-02 1991-05-07 Yale University Dynamic spectral phonocardiograph
US4967760A (en) 1989-02-02 1990-11-06 Bennett Jr William R Dynamic spectral phonocardiograph
US5003605A (en) 1989-08-14 1991-03-26 Cardiodyne, Inc. Electronically augmented stethoscope with timing sound
US5315512A (en) 1989-09-01 1994-05-24 Montefiore Medical Center Apparatus and method for generating image representations of a body utilizing an ultrasonic imaging subsystem and a three-dimensional digitizer subsystem
US5109863A (en) 1989-10-26 1992-05-05 Rutgers, The State University Of New Jersey Noninvasive diagnostic system for coronary artery disease
US5036857A (en) 1989-10-26 1991-08-06 Rutgers, The State University Of New Jersey Noninvasive diagnostic system for coronary artery disease
US5025809A (en) 1989-11-28 1991-06-25 Cardionics, Inc. Recording, digital stethoscope for identifying PCG signatures
US5086776A (en) 1990-03-06 1992-02-11 Precision Diagnostics, Inc. Apparatus and method for sensing cardiac performance
US5140992A (en) 1990-07-16 1992-08-25 The United States Of America As Represented By The Administrator Of The National Aeronautics And Space Administration Passive fetal monitoring sensor
US5176153A (en) 1990-11-02 1993-01-05 Eberhardt Allen C Heart chamber simulator with electronic accelerated heart valve wear and fatigue test apparatus and method
US5301679A (en) 1991-05-31 1994-04-12 Taylor Microtechnology, Inc. Method and system for analysis of body sounds
EP0528279B1 (en) 1991-08-09 1996-12-04 Kureha Kagaku Kogyo Kabushiki Kaisha Flexible piezoelectric device
US5337752A (en) 1992-05-21 1994-08-16 Mcg International, Inc. System for simultaneously producing and synchronizing spectral patterns of heart sounds and an ECG signal
US5365937A (en) 1992-09-09 1994-11-22 Mcg International, Inc. Disposable sensing device with contaneous conformance
US5807268A (en) 1992-09-09 1998-09-15 Medacoustics, Inc. Disposable sensing device with contaneous conformance
US5381804A (en) 1992-10-15 1995-01-17 Aspect Medical Systems, Inc. Monitor and method for acquiring and processing electrical signals relating to bodily functions
US5363401A (en) 1993-02-25 1994-11-08 Harris Corporation Mechanism for extracting hybrid (fh/ds) spread spectrum signals within multi-signal type environment
US5455385A (en) 1993-06-28 1995-10-03 Harris Corporation Multilayer LTCC tub architecture for hermetically sealing semiconductor die, external electrical access for which is provided by way of sidewall recesses
US5885222A (en) 1993-08-30 1999-03-23 Medacoustics, Inc. Disposable acoustic pad sensors
US5724968A (en) 1993-12-29 1998-03-10 First Opinion Corporation Computerized medical diagnostic system including meta function
US5673702A (en) 1994-06-10 1997-10-07 Cambridge Heart, Inc. Method and apparatus for the improved electronic display of physiologic waveforms
US5724983A (en) 1994-08-01 1998-03-10 New England Center Hospitals, Inc. Continuous monitoring using a predictive instrument
US5501229A (en) 1994-08-01 1996-03-26 New England Medical Center Hospital Continuous monitoring using a predictive instrument
US5718233A (en) 1994-08-01 1998-02-17 New England Medical Center Hospitals, Inc. Continuous monitoring using a predictive instrument
US5680513A (en) 1994-08-19 1997-10-21 Hyland; David C. Series parallel approach to identification of dynamic systems
US5796920A (en) 1994-08-19 1998-08-18 Harris Corporation Multiprocessor system and method for identification and adaptive control of dynamic systems
US5553113A (en) 1994-11-18 1996-09-03 Analogic Corporation Auxiliary data acquisition in a medical imaging system
US5618869A (en) 1994-12-19 1997-04-08 Sumitomo Rubber Industries, Ltd. Rubber composition for treads of studless tires
US5686917A (en) 1995-04-19 1997-11-11 National Instruments Corporation System and method for demultiplexing data in an instrumentation system
US5705365A (en) 1995-06-07 1998-01-06 Gen-Probe Incorporated Kits for determining pre-amplification levels of a nucleic acid target sequence from post-amplification levels of product
US5687738A (en) 1995-07-03 1997-11-18 The Regents Of The University Of Colorado Apparatus and methods for analyzing heart sounds
US5595188A (en) 1995-07-26 1997-01-21 Flowscan, Inc. Assembly process for polymer-based acoustic differential-output sensor
US5638823A (en) 1995-08-28 1997-06-17 Rutgers University System and method for noninvasive detection of arterial stenosis
US5598845A (en) 1995-11-16 1997-02-04 Stellartech Research Corporation Ultrasound transducer device for continuous imaging of the heart and other body parts
US5724967A (en) 1995-11-21 1998-03-10 Nellcor Puritan Bennett Incorporated Noise reduction apparatus for low level analog signals

Non-Patent Citations (32)

* Cited by examiner, † Cited by third party
Title
"Gabor Spectrogram," DSP Software Development, National Instruments, Austin, TX (believed to be prior art).
Akay et al., "Application of Adaptive Filters to Noninvasive Acoustical Detection of Coronary Occlusions Before and After Angioplasty," IEEE Transactions on Biomedical Engineering, vol. 39, No. 2, pp. 176-183 (Feb. 1992).
Akay et al., "Application of Adaptive FTF/FAEST Zero Tracking Filters to Noninvasive Characterization of the Sound Pattern Caused by Coronary Artery Stenosis Before and After Angioplasty", Annals of Biomedical Engineering, vol. 21, pp. 9-17 (1993).
Akay et al., "Noninvasive acoustical detection of coronary artery disease using the adaptive line enhancer method," Medical & Biological Engineering & Computing, vol. 30, pp. 147-154 (Mar. 1992).
Akay et al.,"Noninvasive Acoustical Detection of Coronary Artery Disease: A Comparative Study of Signal Processing Methods," IEEE Transactions on Biomedical Engineering, vol. 40, No. 6, pp. 571-5784 (Jun. 1993).
Donnerstein, "Continuous Spectral Analysis of Heart Murmurs for Evaluating Stenotic Cardiac Lesions," The Am. Journ. Card., vol. 64, pp. 625-630 (Sep. 15, 1989).
Durand et al., "Evaluation of FFT-Based and Modern Parametric Methods for the Spectral Analysis of Bioprosthetic Valve Sounds," IEEE Trans. on Biomedical Eng., vol. BME-33, No. 6, pp. 572-578 (Jun. 1986).
Faugeras, Olivier, Ordering, Three-Dimensional Computer Vision-A Geometric Viewpoint, Ch. 6, pp. 178-181 (MIT Press, 1993).
Foale et al., "Detection of aortic porcine valve dysfunction by maximum entrophy spectral analysis," Circulation, vol. 68, No. 1, pp. 42-49 (Jul. 1983).
Fraden, "Application of Piezo/Pyroelectric Films in Medical Transducers," Jour. of Clinical Eng., vol. 13, No. 3, pp. 133-138 (Mar.-Apr. 1988).
Haralick, R. et al., Computer and Robot Vision, Addison-Wesley Publ. Co., NY, NY, pp. 31-40 (believed to be prior art).
Haralick, Robert M., et al., Structure from Stereo by Using Correspondence, Computer and Robot Vision, vol. II, Ch. 16.6 (Addison-Wesley 1993).
Horn, "Computing Depth," Robot Vision, Ch. 13.6, pp. 311-312 (MIT Press 1986).
Horn, Berthold, Disparity between the Two Images, Robot Vision, Ch. 13.1, pp. 300-301, 320-322 (MIT Press 1986).
Iwata et al., "Algorithm for Detecting the First and Second Heart Sounds by Spectral Tracking," Medical & Biological Engineers and Computing, pp. 19-26 (Jan. 1980).
Johnson et al., "Estimation of the Severity of Aortic Valve Stenosis by Frequency Analysis of the Murmur," J. Am. Coll. Cardiol., 1(5):1315-23 (1983).
Johnson et al., "Evaluation of Aortic Stenosis by Spectral Analysis of the Murmur," JACC, vol. 6, No. 1, pp. 55-65 (Jul. 1985).
Joo et al."Pole-Zero Modeling and Classification of Phonocardiograms," IEEE Trans. on Biomedical Eng., vol. BME-30, No. 2, pp. 110-118 (Feb. 1983).
Kagawa et al., "Real-time sound spectroanalysis for diagnosis of malfunctioning prosthetic valves," J. Thorac. Cardiovasc. Surg., vol. 79, pp. 671-679 (May 1980).
Lees et al., "Phonoangiography: A New Noninvasive Diagnostic Method for Studying Arterial Disease," Proceedings of the National Academy of Sciences, vol. 67, No. 2, pp. 935-942 (Oct. 1970).
Longuet-Higgins, H.C., A computer algorithm for reconstructing a scene from two projections, Nature, vol. 293, pp. 133-135 (Sep. 10, 1981).
Nilsson et al., "A Combined Microphone for Simultaneous Recording of Pulse, Phono and Reference ECG," Electromedica, vol. 2, No. 76, pp. 64-68 (1976).
Oestreicher, "Field and Impedance of an Oscillating Sphere in a Viscoelastic Medium with an Application to Biophysics," J. Acoust. Soc. Am., vol. 23, No. 6, pp. 707-714 (Nov. 1951).
Qian et al., "Orthogonal-Like Discrete Gabor Expansion," 26th Conf. on Infor. Sci an Systems, Princeton University (Mar. 18, 1992).
Semmlow et al., "Coronary Atery Disease-Correlates Between Diastolic Auditory Characteristics and Coronary Artery Stenoses," IEEE Transactions on Biomedical Engineering, vol. BME-30, No. 2, pp. 136-139 (Feb. 1983).
Semmlow et al., "Noninvasive Detection of Coronary Artery Disease Using Parametric Spectral Analysis Methods," IEEE Engineering in Medicine and Biology Magazine, pp. 33-36 (Mar. 1990).
Semmlow et al., "Non-Invasive Diagnosis of Coronary Artery Disease by Enhanced Coronary Phonocardiography," IEEE Frontiers of Eng. in Health Care, pp. 181-185 (1982).
Stein et al., "Frequency Spectra of the First Heart Sound and of the Aortic Component of the Second Heart Sound in Patients with Degenerated Porcine Bioprosthetic Valves," The Am. Journ. of Carad., vol. 53, pp. 557-581 (Feb. 1, 1984).
Verburg, "Transmission of Vibrations of the Heart to the Chestwall," Adv. Cardiovasc. Phys., vol. 5, (Part III), pp. 84-103 (1983).
von Glerke, H. et al., "Physics of Vibrations in Living Tissues," J. App. Physiology, vol. 4, pp. 886-900 (Jun. 1952).
Wang et al., Modeling Sound Generation in Stenosed Coronary Arteries, IEEE Transactions on Biomedical Engineering, vol. 37, No. 11, pp. 1087-1094 (Nov. 1990).
Xu, Gang, et al., Reconstruction Techniques, Epipolar Geometry in Stereo, Motion and Object Recognition-A Unified Approach, Ch. 3.4.3, pp. 153-155 (1996).

Cited By (97)

* Cited by examiner, † Cited by third party
Publication number Priority date Publication date Assignee Title
US20050277288A1 (en) * 1997-11-11 2005-12-15 Volkan Ozguz Stackable semiconductor chip layer comprising prefabricated trench interconnect vias
US20020180605A1 (en) * 1997-11-11 2002-12-05 Ozguz Volkan H. Wearable biomonitor with flexible thinned integrated circuit
US20100291735A1 (en) * 1997-11-11 2010-11-18 Volkan Ozguz Stackable semiconductor chip layer comprising prefabricated trench interconnect vias
US7786562B2 (en) 1997-11-11 2010-08-31 Volkan Ozguz Stackable semiconductor chip layer comprising prefabricated trench interconnect vias
US6699201B2 (en) 1998-11-09 2004-03-02 Medacoustics, Inc. Acoustic window identification
US7037268B1 (en) 1999-03-01 2006-05-02 Medacoustics, Inc. Low profile acoustic sensor arry and sensors with pleated transmission lines and related methods
US20050251047A1 (en) * 1999-03-01 2005-11-10 Medacoustics, Inc. Low profile acoustic sensor array and sensors with pleated transmission lines and related methods
US6716169B2 (en) * 2000-08-24 2004-04-06 Seiko Instruments Inc. Ultrasonic sensor, method of fabricating same, and ultrasonic diagnostic device using an ultrasonic sensor
US7527597B2 (en) * 2001-01-16 2009-05-05 Biomedical Acoustic Research Corporation Acoustic detection of vascular conditions
US20040249293A1 (en) * 2001-01-16 2004-12-09 Sandler Richard H. Acoustic detection of vascular conditions
WO2006121537A3 (en) * 2001-05-28 2007-11-15 Arvind Thiagarajan System and methods for gating heart signals
US7744537B2 (en) * 2001-08-20 2010-06-29 Japan Science And Technology Agency Ultrasonic method and system for characterizing arterial tissue using known elasticity data
US20040260180A1 (en) * 2001-08-20 2004-12-23 Hiroshi Kanai Tissue identifying method in ultrasonography and ultrasonograph
JP2006524546A (en) * 2003-04-23 2006-11-02 ヘムチャンドラ・シャートゥクド Apparatus and method for non-invasive diagnosis of coronary artery disease
WO2005013797A3 (en) * 2003-04-23 2005-05-06 Hemchandra Shertukde Apparatus and method for non-invasive diagnosing of coronary artery disease
US20050038360A1 (en) * 2003-04-23 2005-02-17 Hemchandra Shertukde Apparatus and method for non-invasive diagnosing of coronary artery disease
US7291111B2 (en) 2003-04-23 2007-11-06 Medscansonics, Inc. Apparatus and method for non-invasive diagnosing of coronary artery disease
US20080212839A1 (en) * 2003-11-26 2008-09-04 Ge Medical Systems Global Technology Company, Llc Method and system for determining a period of interest using multiple inputs
US8285359B2 (en) 2003-11-26 2012-10-09 General Electric Company Method and system for retrospective gating using multiple inputs
US20050113674A1 (en) * 2003-11-26 2005-05-26 Salla Prathyusha K. Method and system for retrospective gating using multiple inputs
US8137282B2 (en) 2003-11-26 2012-03-20 General Electric Company Method and system for determining a period of interest using multiple inputs
US8064983B2 (en) 2003-11-26 2011-11-22 General Electric Company Method and system for prospective gating using multiple inputs
US7844317B2 (en) * 2003-11-26 2010-11-30 General Electric Company Method and system for estimating three-dimensional respiratory motion
US20050113672A1 (en) * 2003-11-26 2005-05-26 Salla Prathyusha K. Method and system for composite gating using multiple inputs
US20050113671A1 (en) * 2003-11-26 2005-05-26 Salla Prathyusha K. Method and system for estimating three-dimensional respiratory motion
US7756565B2 (en) 2003-11-26 2010-07-13 General Electric Company Method and system for composite gating using multiple inputs
US20050113673A1 (en) * 2003-11-26 2005-05-26 Avinash Gobal B. Method and system to reduce motion-related image artifacts during breath holding
US20050113670A1 (en) * 2003-11-26 2005-05-26 Salla Prathyusha K. Method and system for prospective gating using multiple inputs
US20050234349A1 (en) * 2004-02-10 2005-10-20 Pravica David W Methods, systems, and computer program products for analyzing cardiovascular sounds using eigen functions
US7621875B2 (en) * 2004-02-10 2009-11-24 East Carolina University Methods, systems, and computer program products for analyzing cardiovascular sounds using eigen functions
WO2005077004A3 (en) * 2004-02-10 2007-04-12 Cardiovascular Resonances Llc Methods, systems, and computer program products for analyzing cardiovascular sounds using eigen functions
US10709330B2 (en) 2004-11-15 2020-07-14 Koninklijke Philips N.V. Ambulatory medical telemetry device having an audio indicator
JP2008520266A (en) * 2004-11-15 2008-06-19 コーニンクレッカ フィリップス エレクトロニクス エヌ ヴィ Mobile medical telemetry device with voice indicator
US20110015493A1 (en) * 2004-11-15 2011-01-20 Koninklijke Philips Electronics N.V. Ambulatory Medical Telemetry Device Having An Audio Indicator
WO2006051466A1 (en) * 2004-11-15 2006-05-18 Koninklijke Philips Electronics N.V. Ambulatory medical telemetry device having an audio indicator
US20070055151A1 (en) * 2005-01-20 2007-03-08 Shertukde Hemchandra M Apparatus and methods for acoustic diagnosis
US20060184021A1 (en) * 2005-01-24 2006-08-17 Medison Co., Ltd. Method of improving the quality of a three-dimensional ultrasound doppler image
US10039520B2 (en) 2005-04-13 2018-08-07 Aum Cardiovascular, Inc Detection of coronary artery disease using an electronic stethoscope
US20070036409A1 (en) * 2005-08-02 2007-02-15 Valadez Gerardo H System and method for automatic segmentation of vessels in breast MR sequences
US7711164B2 (en) * 2005-08-02 2010-05-04 Siemens Medical Solutiions Usa, Inc. System and method for automatic segmentation of vessels in breast MR sequences
US7806833B2 (en) 2006-04-27 2010-10-05 Hd Medical Group Limited Systems and methods for analysis and display of heart sounds
US20080273709A1 (en) * 2006-04-27 2008-11-06 Arvind Thiagarajan Systems and methods for tuning, analysis and display of heart sounds
US20080039733A1 (en) * 2006-08-08 2008-02-14 Kamil Unver Systems and methods for calibration of heart sounds
US20080154144A1 (en) * 2006-08-08 2008-06-26 Kamil Unver Systems and methods for cardiac contractility analysis
US20100198141A1 (en) * 2007-09-24 2010-08-05 Laitenberger Peter G Injection Monitor
US20100016718A1 (en) * 2008-07-16 2010-01-21 Siemens Medical Solutions Usa, Inc. Shear Wave Imaging
US8187187B2 (en) * 2008-07-16 2012-05-29 Siemens Medical Solutions Usa, Inc. Shear wave imaging
US20120179041A1 (en) * 2009-11-17 2012-07-12 Canon Kabushiki Kaisha Image forming apparatus and image forming method
US10251560B2 (en) 2009-11-17 2019-04-09 Canon Kabushiki Kaisha Image forming apparatus and image forming method
US8998813B2 (en) * 2009-11-17 2015-04-07 Canon Kabushiki Kaisha Image forming apparatus and image forming method
US20120317444A1 (en) * 2010-01-28 2012-12-13 Hideaki Suzuki Monitoring and diagnosing device for working machine
US8838324B2 (en) * 2010-01-28 2014-09-16 Hitachi Construction Machinery Co., Ltd. Monitoring and diagnosing device for working machine
US11413653B2 (en) 2010-06-24 2022-08-16 Cvr Global, Inc. Sensor, sensor pad and sensor array for detecting infrasonic acoustic signals
US9101274B2 (en) 2010-06-24 2015-08-11 Cvr Global, Inc. Sensor, sensor pad and sensor array for detecting infrasonic acoustic signals
US9829368B2 (en) 2011-05-13 2017-11-28 Chevron U.S.A. Inc. Industrial process monitoring and imaging
US9052230B2 (en) 2011-05-13 2015-06-09 Chevron U.S.A. Inc Industrial process monitoring and imaging
US11112473B2 (en) * 2011-08-31 2021-09-07 Insightec, Ltd. Systems and methods for avoiding MRI-originated interference with concurrently used systems
US8812125B2 (en) 2012-08-31 2014-08-19 Greatbatch Ltd. Systems and methods for the identification and association of medical devices
US10141076B2 (en) 2012-08-31 2018-11-27 Nuvectra Corporation Programming and virtual reality representation of stimulation parameter groups
US9259577B2 (en) 2012-08-31 2016-02-16 Greatbatch Ltd. Method and system of quick neurostimulation electrode configuration and positioning
US9314640B2 (en) 2012-08-31 2016-04-19 Greatbatch Ltd. Touch screen finger position indicator for a spinal cord stimulation programming device
US8761897B2 (en) 2012-08-31 2014-06-24 Greatbatch Ltd. Method and system of graphical representation of lead connector block and implantable pulse generators on a clinician programmer
US9375582B2 (en) 2012-08-31 2016-06-28 Nuvectra Corporation Touch screen safety controls for clinician programmer
US9471753B2 (en) 2012-08-31 2016-10-18 Nuvectra Corporation Programming and virtual reality representation of stimulation parameter Groups
US8868199B2 (en) 2012-08-31 2014-10-21 Greatbatch Ltd. System and method of compressing medical maps for pulse generator or database storage
US9507912B2 (en) 2012-08-31 2016-11-29 Nuvectra Corporation Method and system of simulating a pulse generator on a clinician programmer
US9555255B2 (en) 2012-08-31 2017-01-31 Nuvectra Corporation Touch screen finger position indicator for a spinal cord stimulation programming device
US9594877B2 (en) 2012-08-31 2017-03-14 Nuvectra Corporation Virtual reality representation of medical devices
US9615788B2 (en) 2012-08-31 2017-04-11 Nuvectra Corporation Method and system of producing 2D representations of 3D pain and stimulation maps and implant models on a clinician programmer
US10668276B2 (en) 2012-08-31 2020-06-02 Cirtec Medical Corp. Method and system of bracketing stimulation parameters on clinician programmers
US10376701B2 (en) 2012-08-31 2019-08-13 Nuvectra Corporation Touch screen safety controls for clinician programmer
US9776007B2 (en) 2012-08-31 2017-10-03 Nuvectra Corporation Method and system of quick neurostimulation electrode configuration and positioning
US9180302B2 (en) 2012-08-31 2015-11-10 Greatbatch Ltd. Touch screen finger position indicator for a spinal cord stimulation programming device
US9901740B2 (en) 2012-08-31 2018-02-27 Nuvectra Corporation Clinician programming system and method
US10347381B2 (en) 2012-08-31 2019-07-09 Nuvectra Corporation Programming and virtual reality representation of stimulation parameter groups
US10083261B2 (en) 2012-08-31 2018-09-25 Nuvectra Corporation Method and system of simulating a pulse generator on a clinician programmer
US8903496B2 (en) 2012-08-31 2014-12-02 Greatbatch Ltd. Clinician programming system and method
US8983616B2 (en) 2012-09-05 2015-03-17 Greatbatch Ltd. Method and system for associating patient records with pulse generators
US9767255B2 (en) 2012-09-05 2017-09-19 Nuvectra Corporation Predefined input for clinician programmer data entry
US8757485B2 (en) 2012-09-05 2014-06-24 Greatbatch Ltd. System and method for using clinician programmer and clinician programming data for inventory and manufacturing prediction and control
US9320489B1 (en) 2014-11-25 2016-04-26 John Leonard Semmlow Apparatus for detection of cardiac acoustic signals
US9226726B1 (en) 2014-11-25 2016-01-05 John L Semmlow Method and system for detection of cardiac sounds
US20160330131A1 (en) * 2015-05-05 2016-11-10 Avaya Inc. Automatic cloud capacity adjustment
US10873538B2 (en) * 2015-05-05 2020-12-22 Avaya Inc. Automatic cloud capacity adjustment
US20170202541A1 (en) * 2016-01-15 2017-07-20 Butterfly Network, Inc. Ultrasound signal processing circuitry and related apparatus and methods
US10624613B2 (en) * 2016-01-15 2020-04-21 Butterfly Network, Inc. Ultrasound signal processing circuitry and related apparatus and methods
US20200222026A1 (en) * 2017-07-31 2020-07-16 University Of Pittsburgh-Of The Commonwealth System Of Higher Education System for automatic and early detection flap failure
US11877885B2 (en) * 2017-07-31 2024-01-23 University of Pittsburgh—of the Commonwealth System of Higher Education System for automatic and early detection flap failure
WO2019027693A1 (en) * 2017-07-31 2019-02-07 University Of Pittsburgh-Of The Commonwealth System Of Higher Education System for automatic and early detection of free flap failure
US11191486B2 (en) 2017-09-19 2021-12-07 Ausculsciences, Inc. System and method for detecting decoupling of an auscultatory sound sensor from a test-subject
US11045163B2 (en) 2017-09-19 2021-06-29 Ausculsciences, Inc. Method of detecting noise in auscultatory sound signals of a coronary-artery-disease detection system
US10925573B2 (en) 2017-10-04 2021-02-23 Ausculsciences, Inc. Auscultatory sound-or-vibration sensor
US11510644B2 (en) 2017-10-04 2022-11-29 Ausculsciences, Inc. Wiring harness for use with auscultatory sound-or-vibration sensors
US11896420B2 (en) 2017-10-04 2024-02-13 Ausculsciences, Inc. Auscultatory sound-or-vibration sensor
US11045144B2 (en) 2017-10-20 2021-06-29 Ausculsciences, Inc. Coronary artery disease detection signal processing system and method
US11284827B2 (en) 2017-10-21 2022-03-29 Ausculsciences, Inc. Medical decision support system
WO2020160451A1 (en) * 2019-01-31 2020-08-06 The Medical College Of Wisconsin, Inc. Systems and methods for sound mapping of anatomical and physiological acoustic sources using an array of acoustic sensors

Also Published As

Publication number Publication date
US6243599B1 (en) 2001-06-05
US20010034481A1 (en) 2001-10-25
US6574494B2 (en) 2003-06-03

Similar Documents

Publication Publication Date Title
US6278890B1 (en) Non-invasive turbulent blood flow imaging system
US6585647B1 (en) Method and means for synthetic structural imaging and volume estimation of biological tissue organs
US7740584B2 (en) Method and system for mapping physiology information onto ultrasound-based anatomic structure
EP1579244B1 (en) Segmentation tool for identifying flow regions in an imaging system
US5727561A (en) Method and apparatus for non-invasive detection and analysis of turbulent flow in a patient&#39;s blood vessels
US8303507B2 (en) Ultrasonic doppler diagnostic apparatus and measuring method of diagnostic parameter
EP3761881B1 (en) A system and method of identifying characteristics of ultrasound images
US6371924B1 (en) Acoustic window identification
Adam et al. Semiautomated Border Tracking of Cine Echocardiographic Ventnrcular Images
JP2011505951A (en) Robot ultrasound system with fine adjustment and positioning control using a feedback responsive to the acquired image data
Chung et al. Freehand three-dimensional ultrasound imaging of carotid artery using motion tracking technology
US6402693B1 (en) Ultrasonic transducer aligning system to replicate a previously obtained image
WO1999023940A1 (en) Non-invasive turbulent blood flow imaging system
Kijanka et al. Phase velocity estimation with expanded bandwidth in viscoelastic phantoms and tissues
Shirkovskiy et al. Airborne ultrasound surface motion camera: Application to seismocardiography
CN111407308A (en) Ultrasound imaging system and computer-implemented method and medium for optimizing ultrasound images
CA2677381A1 (en) Method and system for regional assessment of pulmonary function
Parker et al. Measurement of torsion from multitemporal images of the eye using digital signal processing techniques
US20100228120A1 (en) System and method of positioning a sensor for acquiring a vital parameter of a subject
Saeidi et al. 3D heart sound source localization via combinational subspace methods for long-term heart monitoring
EP1808122A2 (en) Non-invasive turbulent blood flow imaging system
CN113382685A (en) Method and system for studying vessel characteristics
JP2023531982A (en) Systems and methods for identifying blood vessels from ultrasound data
BAHADIRLAR et al. Cardiac passive acoustic localization: Cardiopal
US11730381B1 (en) Systems, apparatuses, and methods for locating blood flow turbulence in the cardiovascular system

Legal Events

Date Code Title Description
AS Assignment

Owner name: MEDACOUSTICS, INC., NORTH CAROLINA

Free format text: ASSIGNMENT OF ASSIGNORS INTEREST;ASSIGNORS:CHASSAING, CHARLES E.;STEARNS, SCOTT DONALDSON;VAN HORN, MARK HAROLD;AND OTHERS;REEL/FRAME:009778/0946;SIGNING DATES FROM 19981102 TO 19990208

FPAY Fee payment

Year of fee payment: 4

AS Assignment

Owner name: HARRIS CORPORATION, FLORIDA

Free format text: ASSIGNMENT OF PATENTS;ASSIGNOR:MEDACOUSTICS, INC.;REEL/FRAME:017251/0857

Effective date: 20051110

REFU Refund

Free format text: REFUND - 7.5 YR SURCHARGE - LATE PMT W/IN 6 MO, LARGE ENTITY (ORIGINAL EVENT CODE: R1555); ENTITY STATUS OF PATENT OWNER: LARGE ENTITY

FPAY Fee payment

Year of fee payment: 8

AS Assignment

Owner name: MCG INTERNATIONAL INC., CONNECTICUT

Free format text: ASSIGNMENT OF ASSIGNORS INTEREST;ASSIGNOR:HARRIS CORPORATION;REEL/FRAME:026825/0176

Effective date: 20110601

REMI Maintenance fee reminder mailed
LAPS Lapse for failure to pay maintenance fees
STCH Information on status: patent discontinuation

Free format text: PATENT EXPIRED DUE TO NONPAYMENT OF MAINTENANCE FEES UNDER 37 CFR 1.362

FP Lapsed due to failure to pay maintenance fee

Effective date: 20130821