US6477272B1 - Object recognition with co-occurrence histograms and false alarm probability analysis for choosing optimal object recognition process parameters - Google Patents
Object recognition with co-occurrence histograms and false alarm probability analysis for choosing optimal object recognition process parameters Download PDFInfo
- Publication number
- US6477272B1 US6477272B1 US09/336,274 US33627499A US6477272B1 US 6477272 B1 US6477272 B1 US 6477272B1 US 33627499 A US33627499 A US 33627499A US 6477272 B1 US6477272 B1 US 6477272B1
- Authority
- US
- United States
- Prior art keywords
- search
- probability
- parameters
- search parameters
- prescribed
- Prior art date
- Legal status (The legal status is an assumption and is not a legal conclusion. Google has not performed a legal analysis and makes no representation as to the accuracy of the status listed.)
- Expired - Lifetime
Links
Images


Classifications
-
- G—PHYSICS
- G06—COMPUTING; CALCULATING OR COUNTING
- G06V—IMAGE OR VIDEO RECOGNITION OR UNDERSTANDING
- G06V10/00—Arrangements for image or video recognition or understanding
- G06V10/40—Extraction of image or video features
- G06V10/56—Extraction of image or video features relating to colour
-
- G—PHYSICS
- G06—COMPUTING; CALCULATING OR COUNTING
- G06V—IMAGE OR VIDEO RECOGNITION OR UNDERSTANDING
- G06V10/00—Arrangements for image or video recognition or understanding
- G06V10/70—Arrangements for image or video recognition or understanding using pattern recognition or machine learning
- G06V10/74—Image or video pattern matching; Proximity measures in feature spaces
- G06V10/75—Organisation of the matching processes, e.g. simultaneous or sequential comparisons of image or video features; Coarse-fine approaches, e.g. multi-scale approaches; using context analysis; Selection of dictionaries
- G06V10/758—Involving statistics of pixels or of feature values, e.g. histogram matching
Definitions
- the invention is related to a computer-implemented object recognition system and process, and more particularly, to such a system and process employing co-occurrence histograms (CH) for finding an object in a search image.
- CH co-occurrence histograms
- Object recognition in images is typically based on a model of the object at some level of abstraction. This model is matched to an input image which has been abstracted to the same level as the model. At the lowest level of abstraction (no abstraction at all), an object can be modeled as a whole image and compared, pixel by pixel, against a raw input image. However, more often unimportant details are abstracted away, such as by using sub-templates (ignoring background and image position), normalized correlation (ignoring illumination brightness), or edge features (ignoring low spatial frequencies).
- the abstraction itself is embodied in both the representation of the object and in the way it is matched to the abstracted image. For instance, Huttenlocher et al. [1] represent objects as simple edge points and then match with the Hausdorff distance. While the edge points form a completely rigid representation, the matching allows the points to move nonrigidly.
- One interesting dimension of the aforementioned abstraction is rigidity. Near one end of this dimension are the several object recognition algorithms that abstract objects into a rigid or semi-rigid geometric juxtaposition of image features. These include Hausdorff distance [1], geometric hashing [2], active blobs [3], and eigenimages [4, 5]. In contrast, some histogram-based approaches abstract away (nearly) all geometric relationships between pixels. In pure histogram matching, e.g. Swain & Ballard [6], there is no preservation of geometry, just an accounting of the number of pixels of given colors. The technique of Funt & Finlayson [7] uses a histogram of the ratios of neighboring pixels, which introduces a slight amount of geometry into the representation.
- the dilemma comes in deciding how much to abstract away.
- the goal is to ignore just enough details of the object's appearance to match all anticipated images of the object, but not so many details that the algorithm generates false matches.
- the present invention addresses this issue.
- This invention is directed toward an object recognition system. and process that identifies the location of a modeled object in an image. Essentially, this involves first creating model images of the object whose location is to be identified in the search image. As the object may be depicted in the search image in any orientation, it is preferred that a number of model images be captured, of which each shows the object from a different viewpoint. Ideally, these model images would be taken from viewpoints spaced at roughly equal angles from each other around the object. In addition, multiple images could be taken at each angular viewpoint where each is captured at a different distance away from the object being modeled. This latter method would better model an object whose distance from the camera capturing the search image is unknown.
- Each model image is processed to compute a color co-occurrence histogram (CH).
- CH color co-occurrence histogram
- This unique histogram keeps track of the number of pairs of certain “colored” pixels that occur at particular separation distances in the model image. In this way, geometric information is added to the histogram to make it more selective of the object in the search image, than would a simple color histogram.
- the color ranges there are two parameters that are selected ahead of time. These parameters are the color ranges and the distance ranges. Choosing the color ranges involves dividing the total possible color values associated with the pixels of the model images into a series of preferably equal sized color ranges. Choosing the distance rangesiinvolves selecting a set of distance ranges, for example (1-2 pixels), (2-3 pixels), (3-4 pixels) . . .
- each color and distance range (& so ultimately the total number of different ranges) is preferably selected :to optimize the search process as will be discussed later. Essentially, these ranges should be made small enough to ensure a high selectivity in finding the object in the search image and to minimize false matches. On the other hand, the ranges should be large enough to reduce the amount of processing and to allow enough flexibility in the match that small changes in the shape of the object in the search image (e.g. due to flexure, a slight change in viewpoint, or a different zoom level or scale) do not prevent an object from being recognized.
- each pixel in the model image is quantized in regards to its color by associating it to the color range which includes the actual color value of the pixel.
- the model images are quantized in regards to distance by associating each possible unique, non-ordered, pair of pixels in a model image to one of the distance ranges based on the actual distance separating the pixel pair.
- the CH is then generated by establishing a count of the number of pixel pairs in: a model image which exhibit the same “mix” of color ranges and the same distance range.
- the search image (i.e., the image to be searched for the modeled object) is first cordoned into a series of preferably equal sized sub-images or search windows. These search windows preferably overlap both side-to-side and up-and-down. In the tested embodiment of the present invention, the overlap was set to one-half the width and height of the search window.
- the size of the search window is preferably as large as possible so as to minimize the search process. However, it is also desired that the search window not be so large that false matches or alarms occur. It should be noted that the size of the search window, as well as the size of the aforementioned color and distance ranges, can be optimized via a unique false alarm analysis. This analysis will be discussed in greater detail below.
- a CH is calculated for each search window in the same manner that they were generated in connection with the model images.
- the same color & distance ranges are employed in the quantization steps of the process.
- Each of these search window CHs is compared to, each of the model image CHs. Essentially, this comparison assesses the similarity between the histograms.
- the results of this comparison can be handled in two ways. In a first version, a similarity value threshold is established and any comparison that exceeds the threshold would cause the associated search window to be declared as potentially containing the object. This version would allow identifying each location of the object in a search image which depicts more than one of the objects.
- the threshold would still be used, but only the greatest of the similarity values exceeding the threshold would be chosen to indicate a search window potentially contains the object.
- This version would be especially useful where it is known only one of the objects exists in the image. It could also be useful in that the threshold could be made lower and the object still located, for example in a noisy image.
- an intersection analysis essentially entails comparing the count in each corresponding color mix/distance category between a search window CH and a model image CH, and then identifying the smaller count. The identified smaller counts from each color mix/distance category are added together to produce a similarity value. It is noted that two matching images of an object will have a larger similarity value than non-matching images because the smallest count from each category will be nearly as large as the larger count, whereas the smaller count in non-matching images are likely to be significantly smaller than the larger value. Thus, the sum of the smaller counts from matching images should be larger than the sum of counts from nonmatching images.
- the location can be fined tuned. This is accomplished by repeating the comparison process using the particular model image CH involved in the match and search window CHs generated from search windows respectively created by moving the identified search window up by one pixel row, down by one pixel row, to the left by one pixel column, and to the right by one pixel column, respectively.
- the search window associated with the largest similarity value of the five search windows i.e., the original, up, down, right, & left
- This refinement process is repeated until a newly selected window is associated with the maximum similarity value, unless the original search window already exhibits the maximum similarity value.
- This search window selected at the end of the refinement process is declared as containing the object.
- the analysis employs a numerical algorithm that approximates a mathematical model for estimating the false alarm probability of the object recognition process.
- the false alarm probability is the probability that the intersection of a search window CH and a model image CH (I pm ) will exceed the search threshold ( ⁇ I mm ) when the object is not actually in the search window.
- the false alarm rate would be expected to increase as the search window grows in size, because there will be more opportunities for accidentally accounting for all the entries in the model CH.
- the false alarm probability would be expected to decrease with an increase in the number of colors (n c ) and the number of distances (n d ), because these increases lead to more specific models that are less likely to be accidentally accounted for by a random background.
- the process of computing the false alarm probability begins by computing the probability of occurrence of a given CH on a random background region.
- the number n k of ways that a distance interval can occur in the search window must be ascertained. For instance, a distance interval of 5 pixels can only occur in a limited number of ways in a given size image. This number can be computed using a simple Matlab program. For a fixed distance interval there are n c (n c +1)/2 possible unique, nonordered color pairs with corresponding bins in the CH, each pair occurring with probability p ij . Each bin contains n ij k counts.
- f ⁇ ( n 11 k , n 12 k , K , n ij k , K , n n c , n c k ) ( n k n 11 k , n 12 k , K , n ij k , K , n n c , n c k ) * p 11 n 11 k ⁇ p 12 n 12 k ⁇ K ⁇ ⁇ p ij n ij k ⁇ K ⁇ ⁇ p n c ⁇ n c n c , n c k
- n k n 11 k , n 12 k , K , n ij k , K , n n c , n c k n k ! n 11 k ! ⁇ ⁇ n 12 k ! ⁇ ⁇ K ⁇ ⁇ n ij k ! ⁇ ⁇ K ⁇ ⁇ n n c , n c k !
- f(n 11 k ,n 12 k ,K,n ij k ,K,n n c k , n c ) will be abbreviated as f(n c ,n k )for convenience.
- n (n 11 k ,n 12 k ,K,n ij k ,K,n n c ⁇ 1,n c k ) T i ⁇ j
- the Gaussian g k (n) can be integrated to give probabilities of sets of CHs occurring in the image background.
- the integration limits are given in terms of the number of co-occurrences of particular color pairs.
- the Gaussian only applies to a single specified distance range (k ⁇ 1,k). Thus, it is still necessary to list all the CHs that could cause a false alarm. These would ideally be represented in terms of integration limits for the Gaussian approximation, but this list is too complex to characterize in this way.
- ⁇ k is the integration region for CH distance range (k ⁇ 1,k).
- the integration region ⁇ k is unbounded above and bounded below as n 11 k ⁇ m 11 k ,n 12 k ⁇ m 12 k ,K,n ij k ⁇ n ij k ,K,n n c ⁇ 1,n c k .
- the actual integration is preferably performed using a Monte Carlo technique.
- the foregoing approximation of the probability of a false alarm occurring can then be used to plot probability curves for one of the parameters (i.e., either the colors ranges, the distance ranges, or the search window size) at different values thereof, while holding the other parameters constant.
- the goal of this procedure is to find the optimum value. In the case of the color and distance ranges this optimum will occur at a point where the ranges are as large as possible while at the same time exhibiting an acceptable probability of false alarms.
- the optimum is the largest window size possible with the same acceptable prom!bability of false alarms.
- the plotting process can be repeated for various combinations of constant parameter values to find the curve that gives the largest color or distance range, or the largest window size, at an acceptably low false alarm probability.
- the new values of the constant parameters would be chosen by performing an identical probability analysis using one of the constant parameters as the varying parameter and holding the others constant.
- the process is repeated iteratively until a set of mutually optimal values is established.
- the results are specific to the particular model image employed in the calculation, and so could be repeated for each model image. However, it was found in a tested embodiment that the computed optimal parameter values from one model image worked reasonably well for all the other models as well.
- the color.CH is an effective way to represent objects for recognition in images. By keeping track of pairs of pixels, it allows a variable amount of geometry to be added to the regular color histogram. This in turn allows the object recognition process to work in spite of confusing background clutter and moderate amounts of occlusion and object flexing. Specifically, by adjusting the distances over which the co-occurrences are checked, the sensitivity of the process can be adjusted to account for geometric changes in the object's appearance such as caused by viewpoint change or object flexing.
- the CH is also robust to partial occlusions, because it is not required that the image account for all the co-occurrences of the model.
- FIG. 1 is a diagram depicting a general purpose computing device constituting an exemplary system for implementing the present invention.
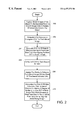
- FIG. 2 is a block diagram of an overall object recognition process for identifying the location of a modeled object in a search image according to the present invention.
- FIG. 3 is a diagram graphically depicting two pixels separated by a vector in an image plane.
- FIG. 4 is a block diagram of a process for accomplishing the rmodel image co-occurrence histogram creation module of the overall process of FIG. 3 .
- FIG. 5 is a block diagram of a process for accomplishing the co-occurrence histogram comparison module of the overall process of FIG. 3 .
- FIG. 6 is a block diagram of a process for refining the location of a search window containing the sought after object according to the present invention.
- FIG. 7 is a diagram graphically depicting some of the ways that a distance of five pixels can occur in a 6 ⁇ 6 search window.
- FIGS. 8 ( a ) through 8 ( l ) are images depicting various model images of a figurine.
- FIG. 9 is a graph plotting false alarm probability as a function of search window size.
- the left, middle and right curves represent the use of 6, 8 and 10 color ranges respectively. All the curves are based on 12 distance ranges.
- FIG. 10 is a graph plotting false alarm probability as a function of the number of color ranges.
- the left, middle and right curves represent the use of 14, 12 and 10 distance ranges respectively. All the curves are based on a search window scaling factor of 3.
- FIGS. 11 and 12 are images showing the results of employing the object recognition process according to the present invention and the model images shown in FIGS. 8 ( a ) through 8 ( l ).
- FIG. 11 shows that the location of the figurine was found in spite of background clutter and partial occlusion.
- FIG. 12 shows that the location of the figurine was found in spite of being flexed such that it was in a standing position with one arm outstretch instead of sitting with arms at the side as in the model images.
- FIG. 1 and the following discussion are intended to provide a brief, general description of a suitable computing environment in :which the invention may be implemented.
- the invention will be described in the general context of computer-executable instructions, such as program modules, being executed by a personal computer.
- program modules include routines, programs, objects, components, data structures, etc. that perform particular tasks or implement particular abstract data types.
- program modules include routines, programs, objects, components, data structures, etc. that perform particular tasks or implement particular abstract data types.
- program modules include routines, programs, objects, components, data structures, etc. that perform particular tasks or implement particular abstract data types.
- the invention may be practiced with other computer system configurations, including hand-held devices, multiprocessor systems, microprocessor-based or programmable consumer electronics, network PCs, minicomputers, mainframe computers, and the like.
- the invention may also be practiced in distributed computing environments where tasks are performed by remote processing devices that are linked through a communications network.
- program modules may be located in both local and remote memory storage devices
- an exemplary system for implementing the invention includes a general purpose computing device in the form of a conventional personal computer 20 , including a processing unit 21 , a system memory 22 , and a system bus 23 that couples various system components including the system memory to the processing unit 21 .
- the system bus 23 may be any of several types of bus structures including a memory bus or memory controller, a peripheral bus, and a local bus using any of a variety of bus architectures.
- the system memory includes read only memory (ROM) 24 and random access memory (RAM) 25 .
- ROM read only memory
- RAM random access memory
- a basic input/output system 26 (BIOS) containing the basic routine that helps to transfer information between elements within the personal computer 20 , such as during start-up, is stored in ROM 24 .
- the personal computer 20 further includes a hard disk drive 27 for reading from and writing to a hard disk, not shown, a magnetic disk drive 28 for reading from or writing to a removable magnetic disk 29 , and an optical disk drive 30 for reading from or writing to a removable optical disk 31 such as a CD ROM or other optical media.
- the hard disk drive 27 , magnetic disk drive 28 , and optical disk drive 30 are connected to the system bus 23 by a hard disk drive interface 32 , a magnetic disk drive interface 33 , and an optical drive interface 34 , respectively.
- the drives and their associated computer-readable media provide nonvolatile storage of computer readable instructions, data structures, program modules and other data for the personal computer 20 .
- a number of program modules may be stored on the hard disk, magnetic disk 29 , optical disk 31 , ROM 24 or RAM 25 , including an operating system 35 , one or more application programs 36 , other program modules 37 , and program data 38 .
- a user may enter commands and information into the personal computer 20 through input devices such as a keyboard 40 and pointing device 42 .
- a camera 55 (such as a digital/electronic still or video camera, or film/photographic scanner) capable of capturing a sequence of images 56 can also be included as an input device to the personal computer 20 .
- the images 56 are input into the computer 20 via an appropriate camera interface 57 . This interface 57 is connected to.
- image data can be input into the computer 20 from any of the aforementioned computer-readable media as well, without requiring the use of the camera 55 .
- Other input devices may include a microphone, joystick, game pad, satellite dish, scanner, or the like.
- These and other input devices are often connected to the processing unit 21 through a serial port interface 46 that is coupled to the system bus, but may be connected by other interfaces, such as a parallel port, game port or a universal serial bus (USB).
- a monitor 47 or other type of display device is also connected to the system bus 23 via an interface, such as a video adapter 48 .
- personal computers typically include other peripheral output devices (not shown), such as speakers and printers.
- the personal computer 20 may operate in a networked environment using logical connections to one or more remote computers, such as a remote computer 49 .
- the remote computer 49 may be an:other personal computer, a server, a router, a network PC, a peer device or other common network node, and typically includes many or all of the elements described above relative to the personal computer 20 , although only a memory storage device 50 has been illustrated in FIG. 1 .
- the logical connections depicted in FIG. 1 include a local area network (LAN) 51 and a wide area network (WAN) 52 .
- LAN local area network
- WAN wide area network
- the personal computer 20 When used in a LAN networking environment, the personal computer 20 is connected to the local network 51 through a network interface or adapter 53 . When used in a WAN networking environment, the personal computer 20 typically includes a modem 54 or other means for establishing communications over the wide area network 52 , such as the Internet.
- the modem 54 which may be internal or external, is connected to the system bus 23 via the serial port interface 46 .
- program modules depicted relative to the personal computer 20 may be stored in the remote memory storage device. It will be appreciated that the network connections shown are exemplary and other means of establishing a communications link between the computers may be used.
- the first step 200 in the general object recognition process involves capturing model images of the object that will be searched for in an image (hereinafter referred to as the search image). These model images are captured from a plurality of “viewpoints” around the object. For the purposes of the present description the term “viewpoint” refers to a viewing direction toward the object, rather than a specific point in space.
- a co-occurrence histogram (CH) is computed for each of the model images.
- step 204 a series of search windows, of a prescribed size, are generated from overlapping portions of the search image.
- a co-occurrence histogram is computed for each of the search windows in step 206 .
- a comparison between the CH of each of the model images and the CH of each of the search windows is then conducted to assess the similarity between each pair of CHs (step 208 ).
- any search window that is associated with a search window CH having a degree of similarity to one of the model image CHs which exceeds a prescribed search threshold is designated as potentially containing the object being sought. This designation can be presumed final, or refined as will be discussed later.
- the object recognition process first involves creating model images of the object whose location is to be identified in the search image.
- the object may be depicted in the search image in any orientation, it is preferred that a number of model images be captured, of which each shows the object from a different viewpoint. Ideally, these model images would be taken from viewpoints spaced at equal angles from each other around the object.
- the angle separating each model image viewpoint should be selected so that a high degree of matching (e.g., by exceeding the aforementioned search threshold) exists between one of the model images and a portion of the search image actually containing the modeled object.
- the aforementioned comparison process becomes more onerous as the number of model images increases. Therefore, it is preferred that the angle be large enough to minimize the number of model images required, while still providing the desired degree of match.
- One way of determining this optimal separation angle is to require a good degree of matching between each adjacent model image viewpoint, as measured by an appropriate threshold. Specifically, this can be accomplished by selecting a series of candidate separation angles, and for each candidate, assessing the degree of similarity:between at least one pair of model images having adjacent viewpoints separated by the candidate separation angle.
- the largest candidate separation angle that has an assessed degree of similarity exceeding a prescribed model image separation angle threshold is designated as the separation angle to be employed in capturing the model images of the object.
- the aforementioned model image separation angle threshold is chosen so that the number of model images required is minimized, while still ensuring the model images cover every possible orientation of the sought after object in the search image.
- model image creation process Another aspect of the model image creation process is the distance away from the object that the images are captured. If it is generally known how far away from the camera the object is in the search image, then the model images could be captured at approximately the same distance away from the object being modeled. However, if this distance in not known, then it would be desirable to capture more than one model image at each viewpoint angle, where each image is captured at a different distance away from the object. In this way, the model images are more likely to accurately model the object of interest in the search image. It should be noted that the aforementioned similarity test used to ensure a good degree of matching between model, images taken at adjacent angular viewpoints could also be employed to ensure a good degree of matching between model images taken at the same angular viewpoint, but at different distances away from the object.
- the largest candidate separation distance that has an assessed degree of similarity exceeding a prescribed model image separation distance threshold is designated at the aforementioned separation distance to be employed in capturing the model images of the object.
- the model image separation distance threshold is chosen so that the number of model images required is minimize, while still ensuring the model images cover every possible distance away for the sought after object that might be encountered in the search image. In this way, it is more likely that -one of the model images associated with a particular angular viewpoint will match (i.e., exceed the aforementioned search threshold) an object in the search image having a similar angular viewpoint.
- a co-occurrence histogram is computed for each model image.
- pixel “color” will be employed as the basis for computing the CH.
- the pixel “color” can be defined using any conventional characterization of the color space.
- each model image will be represented as a color CH.
- CH color
- the process involves separately determining the colors of each model image.
- the quantization in color and distance means the CH is represented by CH(i,j,k), where i and j index the two colors from set C, and k indexes the distance range from set D.
- a model image CH is computed via the steps illustrated in FIG. 4 .
- the colors exhibited by the pixels of the model image are determined, as indicated above.
- the overall gamut of possible pixel “colors” exhibited by the pixels is then divided into a series of discrete color ranges (step 401 ). Preferably these color ranges are equal in size, although they need not be made so.
- the model image is quantized into the n c colors. This is done as shown in step 402 by comparing the raw color exhibited by a pixel to the set of quantized colors and assigning the pixel to the nearest quantized color.
- the distance ranges are also established, either at this point, or more preferably, prior to beginning the process. This involves choosing a maximum distance of interest and dividing it into a series of distance ranges (step 404 ). For instance, in a tested embodiment a maximum distance range of 12 pixels was chosen and divided into equal sized distance ranges each being one pixel wide (i.e., (1-2 pixels), (2-3 pixels), (3-4 pixels) . . . , (11-12 pixels)). Every possible unique, non-ordered pixel pair is then identified in step 406 . For each of the identified pixel pairs, the next step 408 is to quantize the distance between the pixels making up the pair by assigning the pair to the appropriate one of the previously selected distance ranges.
- the next step 410 in the process is to categorize each pixel pair by the assigned color range of each constituent pixel, as well as its assigned distance range. A count is then established for the number of pixel pairs exhibiting, the same mix of assigned quantized colors and having the same assigned distance range (step 412 ).
- the image is scanned for a window that gives a CH similar to one of the model CHs. This is repeated for each of the model images.
- the image windows from which the model and image CHs are computed need not be the same size. In fact it is desirable to make the image search window as large as reasonably possible to increase the speed of scanning the whole image. However, the search window size should not be made so large that a substantial risk of a false match or alarm is introduced, Thus, it is desirable to choose a search window size which is as large as possible, while at the same time not being so large as to risk false alarms. The issue of choosing such a search window size is also addressed later using the aforementioned false alarm analysis.
- the search windows are preferably generated by cordoning off the search image into a series of equally-sized regions having the chosen search window size and shape configuration. These regions preferably overlap both side-to-side and up-and-down, where possible (i.e. the edges of the image will preclude overlapping in some directions for regions adjacent the edge). In the tested embodiment of the present invention, the overlap was set to one-half the width and height of the search window.
- rectangular search windows are envisioned to be the most practical shape, other shapes may be feasible depending on the search image being searched. For example, triangular, polygonal, circular or even elliptical search windows might be employed. For the purposes of explaining the present invention a rectangular search window will be assumed.
- a search window Once a search window has been generated, its CH is computed. This can occur as each search window is identified, or after all the windows have been generated. Regardless, a CH is calculated for each search window in the same manner that they were generated in connection with the model images. In particular, the same quantized colors & distance ranges are employed in the quantization steps of the process. Specifically, for those pixels of the search window having a color falling within one of the previously computed pixel color ranges, the pixel's color is quantized by assigning the pixel to the pixel color range into which its color falls. Then, as with the model image CHs, every possible unique, non-ordered pair of pixels in the search window is identified.
- each pixel pair is categorized as was done with the model image CHs, and a count of the number of categorized pixel pairs having the same pixel color mix/distance category is established.
- This intersection indicates how well the image CH accounts for the model CH. For example, if the image accounts for all the entries in the model CH, then the intersection will be equal to the sum of all the entries in the model CH, or I mm .
- the count in each corresponding color mix/distance category is compared between a search window CH and a model image CH (step 500 ).
- the purpose is of this comparison is to identify the smaller of the two counts in each category, as indicated in step 502 .
- the identified smaller counts from each color mix/distance category are added together to produce a similarity value (step 504 ). The larger this similarity value, the greater the similarity between the associated model image and search window.
- intersection method is an attractive measure of similarity, because if the image CH contains extra entries from the background, they will not reduce the quality of the match. However, if the image CH has large values for all its entries, say due to examining a large region in the image, it could accidentally account for the entries in the model CH, causing a false alarm. As indicated earlier, the effect of the search window size, as well as other parameters, is examined based on the false alarm probability in the next section.
- T ⁇ I mm .
- the exact value of ⁇ will vary depending on the degree of accuracy required for the application for which the present invention is being employed. However, in a tested embodiment it was determined that an ⁇ of 0.9 produced satisfactory results.
- any intersection that exceeds the threshold would cause the associated search window to be declared as potentially containing the object. This version would allow identifying each location of the object in a search image which depicts more than one of the objects.
- the threshold would still be used, but only the greatest of the similarity values exceeding the threshold would be chosen to indicate a search window potentially contains the object. This version would be especially useful where it is known only one of the objects exists in the image. It could also be useful in that the threshold could be made lower and the object still located, for example in a noisy image.
- the search window associated with a similarity value exceeding the prescribed search threshold can be considered to contain the object being sought without further processing. However, depending on the application, it might be, desirable to further refine the exact location of the object within the search image. This refinement can be achieved using a two-part process. This two-part process begins as described above to find one or more search windows potentially containing the object being sought.
- the high resolution search is essentially a pixel-by-pixel hill-climbing search.
- the high resolution search is accomplished in connection with each of the identified search windows by first designating the identified search window as the primary search window (step 600 ). Then, in step 602 , additional search windows are generated from portions of the search image respectively defined by moving the primary search window up by one pixel row, down by one pixel row, to the left by one pixel column, and to the right by one pixel column. This produces a total of five search windows in most cases, i.e. the primary and four translated windows. Of course, if the primary search window is located at the edge of the search image, it will not be possible to generate all four of the translated search windows and the refinement process would be conducted with fewer search windows (i.e., three or four).
- the refinement process continues with the computation of a color CH for each of the additional search windows (step 604 ) and assessing the similarity between the CHs of each of the additional search windows and the CH of the model image associated with the original search window (step 606 ). These steps are performed in the same manner as described in connection with the process used to identify the original search window.
- the result of the foregoing steps is to produce a similarity value for each of the translated search windows. It is next determined if any of the similarity values associated with the translated search windows exceeds the similarity value previously computed for the primary search window, as indicated by step 608 .
- the primary search window is declared as actually containing the object being sought. If, however, one of the similarity values computed for the additional search windows does exceed that of the primary search window, then that particular additional search window is designated the current primary search window (step 612 ) and the process of steps 600 through 610 or 612 is repeated using the newly designated primary search window in place of the previously designated primary search window. Thus, the refinement process is repeated, unless the originally designated primary search window is associated with the maximum similarity value, and continues until a newly designated primary search window is associated with the maximum similarity value. This fine tunes the location of a search window containing the sought after object. Either way, a currently designated primary search window having the maximum similarity value in comparison to the additional search windows is declared to contain the object being sought (see step 610 ).
- the search windows taken from the image being searched have a scale twice that of the model images.
- the model images would be quantized for the distance ranges as described previously. However, these ranges would be doubled in size when quantizing the search windows. In this way the number of ranges stays the same.
- the number of pixel pairs in the unaltered distance ranges associated with the model image CH are compared to the number of pixel pairs in the corresponding doubled distance ranges in the search image CH.
- the result of this scale compensating process is that approximately the same number of pixel pairs will be associated with the “corresponding” distance ranges in the compared model image and search window when these images match.
- the false alarm probability is the probability that the intersection I pm will exceed the match threshold ⁇ I mm when the object is not actually in the search window. Intuitively, it is expected that the false alarm rate will increase as the search window grows, because there will be more opportunities for accidentally accounting for all the entries in the model CH. Also, it is expected that the false alarm probability will decrease as the number of colors n c and the number of distances n d is increased, because these increases lead to more specific models that are less likely to be accidentally accounted for by a random background. Pulling these parameters in the opposite direction is desired for a speedy algorithm and for one that does not required too many model viewpoints of each object. The algorithm would run faster if the search window were larger, because the whole image could then be searched faster.
- intersection computation would be faster with fewer colors and,distances. Fewer distances would tend to generalize a model of a particular viewpoint to match those of more disparate viewpoints, and it would match better with objects that flex.
- the false alarm probability helps arbitrate between these desires, letting the parameters to be set for the fastest possible execution and most tolerant matching without undue risk of false alarm.
- subsection 2.1 shows the derivation of the probability of a given CH occurring on a random background. This is then used as discussed in subsection 2.2 to compute the probability that a random background will match a model CH. And finally, in subsection 2.3 the analysis is used to choose parameters for a real object.
- the derivation begins by computing the probability of occurrence of a given CH on a random background region of size h ⁇ w.
- the image is quantized into n c colors, with color i occurring with probability p i .
- the co-occurrence histogram looks at pairs of colors, so it is observed that the probability of seeing colors i and j at (x i ,y i ) and (x j ,y j ) respectively is p i p j .
- nk defines the number of ways that a distance interval (k ⁇ 1,k) can occur in the search window. This number n k is computed using a standard Matlab program.
- n c (n c +1)/2 possible unique, nonordered color pairs with corresponding bins in the CH, each pair occurring with probability p ij .
- the probability of a partition of particular color pairs into bins with n ij k in each bin is p 11 n 11 k p 12 n 12 k Kp ij n ij k Kp n c n c n nc,nc k .
- This partition can happen in ⁇ ( ⁇ n k n 11 k , n 12 k , K , n ij k , K , n n c , n c k ⁇ )
- f(n 11 k ,n 12 k ,K,n ij k ,n n c ,n c k ) will be abbreviated as f(n c ,n k ) in the following description.
- the function f(n c ,n k ) is the probability of observing a given set of co-occurrences in a distance range (k ⁇ 1,k).
- Equation (5) would then be used to compute the probability of each CH in the list and sum the probabilities to get the false alarm probability.
- this list is much too long.
- the multinomial distribution is approximated as a multivariate Gaussian distribution and integrated. This simplifies the problem from summing values in an enormous list to integrating a multidimensional Gaussian.
- n (n 11 k ,n 12 k ,K,n ij k ,K,n n c ⁇ 1,n c k ) T i ⁇ j
- the dimensionality of these vectors is one less than the number of color pairs n c (n c +1)/2. This is because once all but the last color co-occurrence bin has been filled, the last bin must contain exactly enough counts to make the total n k .
- the Gaussian g k (n) can be integrated to give probabilities of sets of CHs occurring in the image background.
- the integration limits are given in terms of the number of co-occurrences of particular color pairs.
- the Gaussian only applies to a single specified distance range (k ⁇ 1,k).
- n ij k I m (i,j,k) is the model CH
- 0 ⁇ 1 the fraction of the histogram counts that we require to declare the model found in the image. This tends to underestimate the probability of a false alarm, but experiments show that it is still approximately correct.
- ⁇ k is the integration region for CH distance range (k ⁇ 1,k).
- the region ⁇ k is unbounded above and bounded below as n 11 k ⁇ m 11 k ,n 12 k ⁇ m 12 k ,K,n ij k ⁇ n ij k ,K,n n c ⁇ 1,n c k ⁇ m n c ⁇ 1,n c .
- the actual integration is preferably performed using a standard Monte Carlo technique.
- the next subsection shows plots of the false alarm probability to demonstrate how the analysis can be used to pick some of the algorithm's operating parameters.
- the present object recognition system and process requires the specification of three parameters: the number of colors n c , the number of distances n d , and the size of the search window h ⁇ w.
- This section shows how a false alarm analysis can be used to guide the choice of these parameters for a model image—namely the one shown in FIG. 8 ( h ).
- the analysis begins by deciding the size of the search window.
- the false alarm rate increases as expected, staying essential zero if the scaling factor is less than three.
- a search window size 300 ⁇ 180 (i.e., 3 times the model image size) is selected.
- n the optimal number of colors n, is chosen for the aforementioned k-means color quantization.
- the false alarm probability decreases with more colors, because more colors make the model more specific and less prone to matching a random background.
- n d 12 should be chosen because that is where th,e false alarm rate first goes to nearly zero.
- plots of the false alarm probability illustrate how the probability varies as two of the three parameters of interest are fixed, while the third variable was varied. It is also noted that in the process of choosing the optimum search window size, n c and n d were fixed at the values later found to be nearly optimal for these parameters. The same was true for n d in the process used to select the optimal number of colors n c . This was no accident. The process of selecting the optimal parameters actually required a series of iterations through the parameters and associated plots to find a mutually good-working set of values. Only the final iteration is depicted in FIGS. 9 and 10.
- An alternate analysis approach can also be employed in selecting the optimal, search parameters.
- this alternate approach involves searching through variations of all parameters simultaneously rather then fixing all but one of the parameters as described above. This simultaneous search is accomplished by exhaustively computing the false alarm rate for a substantial number of combinations of candidate search parameters or by using a standard numerical search routine to find the best combination.
- FIGS. 8 ( a )-( l ) a series of model images are shown of a figurine object taken as it was rotating on a motorized turntable.
- a long focal length lens 75 mm on a C-mount camera
- the camera's automatic gain control and automatic white balance were also disabled to help make the images consistent.
- the model images with captured with a black background to make segmentation easier.
- an important number to choose for the present system and process is the number of image models to use for a given object.
- 12 images to cover 360° of rotation. This choice was based on an analysis of how well the model images match themselves. We began by taking model images of the object every 5° for a total of 72 images. Adjacent images were then compared to ensure a good degree of matching existed. It was found, however, that as few as 12 model images would still provide a good degree of matching between the adjacent model images. Thus, it was decided that 12 model images were adequate for modeling the full set of viewpoints around 360° for the tested embodiment.
- FIG. 11 shows that the present system and process finds the figurine modeled with the images of FIGS. 8 ( a )-( l ) despite significant occlusion.
- FIG. 12 the system and process was able to find the aforementioned figurine standing with one arm outstretched, even though the model images (of FIGS. 8 ( a )-( l )) show it sitting with arms at the sides. This demonstrates that the system and process can tolerate some flexing in an object.
Abstract
Description


Claims (27)
Priority Applications (1)
| Application Number | Priority Date | Filing Date | Title |
|---|---|---|---|
| US09/336,274 US6477272B1 (en) | 1999-06-18 | 1999-06-18 | Object recognition with co-occurrence histograms and false alarm probability analysis for choosing optimal object recognition process parameters |
Applications Claiming Priority (1)
| Application Number | Priority Date | Filing Date | Title |
|---|---|---|---|
| US09/336,274 US6477272B1 (en) | 1999-06-18 | 1999-06-18 | Object recognition with co-occurrence histograms and false alarm probability analysis for choosing optimal object recognition process parameters |
Publications (1)
| Publication Number | Publication Date |
|---|---|
| US6477272B1 true US6477272B1 (en) | 2002-11-05 |
Family
ID=23315352
Family Applications (1)
| Application Number | Title | Priority Date | Filing Date |
|---|---|---|---|
| US09/336,274 Expired - Lifetime US6477272B1 (en) | 1999-06-18 | 1999-06-18 | Object recognition with co-occurrence histograms and false alarm probability analysis for choosing optimal object recognition process parameters |
Country Status (1)
| Country | Link |
|---|---|
| US (1) | US6477272B1 (en) |
Cited By (24)
| Publication number | Priority date | Publication date | Assignee | Title |
|---|---|---|---|---|
| US20020041705A1 (en) * | 2000-08-14 | 2002-04-11 | National Instruments Corporation | Locating regions in a target image using color matching, luminance pattern matching and hue plane pattern matching |
| US6611622B1 (en) * | 1999-11-23 | 2003-08-26 | Microsoft Corporation | Object recognition system and process for identifying people and objects in an image of a scene |
| US6668084B1 (en) * | 1999-09-24 | 2003-12-23 | Ccs Inc. | Image recognition method |
| US20040170318A1 (en) * | 2003-02-28 | 2004-09-02 | Eastman Kodak Company | Method for detecting color objects in digital images |
| US6801657B1 (en) * | 1999-04-29 | 2004-10-05 | Mitsubiki Denki Kabushiki Kaisha | Method and apparatus for representing and searching for color images |
| US20050058350A1 (en) * | 2003-09-15 | 2005-03-17 | Lockheed Martin Corporation | System and method for object identification |
| US20060052686A1 (en) * | 2004-08-24 | 2006-03-09 | Li Zhang | Feature-based composing for 3D MR angiography images |
| US20080025629A1 (en) * | 2006-07-27 | 2008-01-31 | Pere Obrador | Image processing methods, image management systems, and articles of manufacture |
| US20080089591A1 (en) * | 2006-10-11 | 2008-04-17 | Hui Zhou | Method And Apparatus For Automatic Image Categorization |
| US20090304229A1 (en) * | 2008-06-06 | 2009-12-10 | Arun Hampapur | Object tracking using color histogram and object size |
| US20100100827A1 (en) * | 2008-10-17 | 2010-04-22 | Louis Hawthorne | System and method for managing wisdom solicited from user community |
| US20100100826A1 (en) * | 2008-10-17 | 2010-04-22 | Louis Hawthorne | System and method for content customization based on user profile |
| US20100107075A1 (en) * | 2008-10-17 | 2010-04-29 | Louis Hawthorne | System and method for content customization based on emotional state of the user |
| US20100113091A1 (en) * | 2008-10-31 | 2010-05-06 | Sharma Ravi K | Histogram methods and systems for object recognition |
| US20110016102A1 (en) * | 2009-07-20 | 2011-01-20 | Louis Hawthorne | System and method for identifying and providing user-specific psychoactive content |
| US20110081081A1 (en) * | 2009-10-05 | 2011-04-07 | Smith Gregory C | Method for recognizing objects in images |
| US20110154197A1 (en) * | 2009-12-18 | 2011-06-23 | Louis Hawthorne | System and method for algorithmic movie generation based on audio/video synchronization |
| US20120020550A1 (en) * | 2010-07-21 | 2012-01-26 | Sony Corporation | Image processing apparatus and method, and program |
| RU2458397C1 (en) * | 2011-03-23 | 2012-08-10 | Федеральное государственное военное образовательное учреждение высшего профессионального образования "Военный авиационный инженерный университет" (г. Воронеж) Министерства обороны Российской Федерации | Method of searching for and recognising objects on digital images |
| US9342500B2 (en) | 2010-03-15 | 2016-05-17 | Michael V. Liguori | Object memory management system |
| RU2623891C2 (en) * | 2015-10-12 | 2017-06-29 | Федеральное государственное казенное военное образовательное учреждение высшего профессионального образования "Военный учебно-научный центр Военно-воздушных сил "Военно-воздушная академия имени профессора Н.Е. Жуковского и Ю.А. Гагарина" (г. Воронеж) Министерства обороны Российской Федерации | Method of detecting objects, determining geometric shape and orientation thereof on images |
| US20180089187A1 (en) * | 2009-06-18 | 2018-03-29 | Canon Kabushiki Kaisha | Image recognition method and image recognition apparatus |
| CN115122602A (en) * | 2022-05-23 | 2022-09-30 | 宁波冬阳科技有限公司 | Intelligent control method and system for injection molding machine |
| US11605220B2 (en) | 2018-12-19 | 2023-03-14 | Zhejiang Dahua Technology Co., Ltd. | Systems and methods for video surveillance |
Citations (3)
| Publication number | Priority date | Publication date | Assignee | Title |
|---|---|---|---|---|
| US5612928A (en) * | 1992-05-28 | 1997-03-18 | Northrop Grumman Corporation | Method and apparatus for classifying objects in sonar images |
| US5671290A (en) * | 1991-09-27 | 1997-09-23 | E. I. Du Pont De Nemours And Company | Method and system of separately identifying clumped homogeneous objects in an image |
| US5982944A (en) * | 1991-09-27 | 1999-11-09 | E. I. Du Pont De Nemours And Company | Adaptive vision system using dual thresholding |
-
1999
- 1999-06-18 US US09/336,274 patent/US6477272B1/en not_active Expired - Lifetime
Patent Citations (3)
| Publication number | Priority date | Publication date | Assignee | Title |
|---|---|---|---|---|
| US5671290A (en) * | 1991-09-27 | 1997-09-23 | E. I. Du Pont De Nemours And Company | Method and system of separately identifying clumped homogeneous objects in an image |
| US5982944A (en) * | 1991-09-27 | 1999-11-09 | E. I. Du Pont De Nemours And Company | Adaptive vision system using dual thresholding |
| US5612928A (en) * | 1992-05-28 | 1997-03-18 | Northrop Grumman Corporation | Method and apparatus for classifying objects in sonar images |
Non-Patent Citations (14)
| Title |
|---|
| B. V. Funt and G. D. Finlayson, "Color Constant Color Indexing," IEEE Transactions on Pattern Analysis and Machine Intelligence, vol. 17, pp. 522-529, 1995. |
| D. Forsyth, J. L. Mundy, A. Zisserman, C. Coelho, A Heller, and C. Rothwell, "Invariant Descriptors for 3-D Object Recognition and Pose," IEEE Transactions on Pattern Analysis and Machine Intelligence, vol. 13, pp. 971-991, 1991. |
| D. P. Huttenlocher, G. A. Klanderman, and W. J. Ricklidge, "Comparing Images Using the Hausdorff Distance," IEEE Transactions on Pattern Analysis and Machine Intelligence, vol. 15, pp. 850-863, 1993. |
| Ennesser, F; Medioni, G., Finding Waldo, or focus of attention using local color information, pp. 805-809, vol. 17, Issue: 8, ISSN: 0162-8828. * |
| Ettelt, E.; Schmidt, G., Optimized template trees for appearance based object recognition, Oct. 11-14, 1998, pp. 4536-4541 vol. 5, ISBN: 0-7803-4778-1, IEEE Catalog No.: 98CH36218.* * |
| G. Pass and R. Zabih, "Histogram Refinement for Content-Based Image Retrieval," presented at IEEE Workshop on Applications of Computer Vision, Sarasota, Florida, 1996. |
| H. Murase and S. K. Nayar, "Visual Learning and Recognition of 3-D Objects from Appearance," International Journal of Computer Vision, vol. 14, pp. 5-24, 1995. |
| J. Huang, S. R. Kumar, M. Mitra, W.-J. Zhu. and R. Zabih, "Image Indexing Using Color Correlograms," presented at IEEE Conference on Computer Vision and Pattern Recognition, San Juan, Puerto Rico, 1997. |
| M. J. Swain and D. H. Ballard, "Color Indexing," International Journal of Computer Vision, vol. 7, pp. 11-32, 1991. |
| M. Turk and A. Pentland, "Eigenfaces for Recognition," Journal of Cognitive Neuroscience, vol. 3, pp. 71-86, 1991. |
| O. Kempthorne and L. Folks, in Probability, Statistics, and Data Analysis, Ames, Iowa: Iowa State University Press, 1971, pp. 108-121. |
| R. M. Haralick, K. Shanmugam and I. Dinstein, "Textural Features for Image Classification," IEEE Transactions on Systems, Man. and Cybernetics, vol. SMC-3, pp. 610-621, 1973. |
| S. Sclaroff and J. Isidoro, "Active Blobs," presented at Sixth International Conference on Computer Vision, Bombay, India, 1998. |
| Y. Lamdan and H. J. Wolfson, "Geometric Hashing: A General and Efficient Model-Based Recognition Scheme," presented at Second International Conference on Computer Vision, Tampa, Florida, 1988. |
Cited By (40)
| Publication number | Priority date | Publication date | Assignee | Title |
|---|---|---|---|---|
| US6801657B1 (en) * | 1999-04-29 | 2004-10-05 | Mitsubiki Denki Kabushiki Kaisha | Method and apparatus for representing and searching for color images |
| US6668084B1 (en) * | 1999-09-24 | 2003-12-23 | Ccs Inc. | Image recognition method |
| US7092566B2 (en) * | 1999-11-23 | 2006-08-15 | Microsoft Corporation | Object recognition system and process for identifying people and objects in an image of a scene |
| US6611622B1 (en) * | 1999-11-23 | 2003-08-26 | Microsoft Corporation | Object recognition system and process for identifying people and objects in an image of a scene |
| US20030215134A1 (en) * | 1999-11-23 | 2003-11-20 | John Krumm | Object recognition system and process for identifying people and objects in an image of a scene |
| US20050089223A1 (en) * | 1999-11-23 | 2005-04-28 | Microsoft Corporation | Object recognition system and process for identifying people and objects in an image of a scene |
| US6952496B2 (en) * | 1999-11-23 | 2005-10-04 | Microsoft Corporation | Object recognition system and process for identifying people and objects in an image of a scene |
| US20020041705A1 (en) * | 2000-08-14 | 2002-04-11 | National Instruments Corporation | Locating regions in a target image using color matching, luminance pattern matching and hue plane pattern matching |
| US7039229B2 (en) * | 2000-08-14 | 2006-05-02 | National Instruments Corporation | Locating regions in a target image using color match, luminance pattern match and hill-climbing techniques |
| US20040170318A1 (en) * | 2003-02-28 | 2004-09-02 | Eastman Kodak Company | Method for detecting color objects in digital images |
| US7263220B2 (en) | 2003-02-28 | 2007-08-28 | Eastman Kodak Company | Method for detecting color objects in digital images |
| US20050058350A1 (en) * | 2003-09-15 | 2005-03-17 | Lockheed Martin Corporation | System and method for object identification |
| US20060052686A1 (en) * | 2004-08-24 | 2006-03-09 | Li Zhang | Feature-based composing for 3D MR angiography images |
| US8265354B2 (en) * | 2004-08-24 | 2012-09-11 | Siemens Medical Solutions Usa, Inc. | Feature-based composing for 3D MR angiography images |
| US7848577B2 (en) * | 2006-07-27 | 2010-12-07 | Hewlett-Packard Development Company, L.P. | Image processing methods, image management systems, and articles of manufacture |
| US20080025629A1 (en) * | 2006-07-27 | 2008-01-31 | Pere Obrador | Image processing methods, image management systems, and articles of manufacture |
| US20080089591A1 (en) * | 2006-10-11 | 2008-04-17 | Hui Zhou | Method And Apparatus For Automatic Image Categorization |
| US8243987B2 (en) | 2008-06-06 | 2012-08-14 | International Business Machines Corporation | Object tracking using color histogram and object size |
| US20090304229A1 (en) * | 2008-06-06 | 2009-12-10 | Arun Hampapur | Object tracking using color histogram and object size |
| US20100107075A1 (en) * | 2008-10-17 | 2010-04-29 | Louis Hawthorne | System and method for content customization based on emotional state of the user |
| US20100100826A1 (en) * | 2008-10-17 | 2010-04-22 | Louis Hawthorne | System and method for content customization based on user profile |
| US20100100827A1 (en) * | 2008-10-17 | 2010-04-22 | Louis Hawthorne | System and method for managing wisdom solicited from user community |
| US20100113091A1 (en) * | 2008-10-31 | 2010-05-06 | Sharma Ravi K | Histogram methods and systems for object recognition |
| US8004576B2 (en) | 2008-10-31 | 2011-08-23 | Digimarc Corporation | Histogram methods and systems for object recognition |
| US8767084B2 (en) | 2009-05-19 | 2014-07-01 | Digimarc Corporation | Histogram methods and systems for object recognition |
| US9811757B2 (en) | 2009-05-19 | 2017-11-07 | Digimarc Corporation | Histogram methods and systems for object recognition |
| US9135520B2 (en) | 2009-05-19 | 2015-09-15 | Digimarc Corporation | Histogram methods and systems for object recognition |
| US10891329B2 (en) * | 2009-06-18 | 2021-01-12 | Canon Kabushiki Kaisha | Image recognition method and image recognition apparatus |
| US20180089187A1 (en) * | 2009-06-18 | 2018-03-29 | Canon Kabushiki Kaisha | Image recognition method and image recognition apparatus |
| US20110016102A1 (en) * | 2009-07-20 | 2011-01-20 | Louis Hawthorne | System and method for identifying and providing user-specific psychoactive content |
| US8340420B2 (en) | 2009-10-05 | 2012-12-25 | National Taiwan University | Method for recognizing objects in images |
| US20110081081A1 (en) * | 2009-10-05 | 2011-04-07 | Smith Gregory C | Method for recognizing objects in images |
| US20110154197A1 (en) * | 2009-12-18 | 2011-06-23 | Louis Hawthorne | System and method for algorithmic movie generation based on audio/video synchronization |
| US9342500B2 (en) | 2010-03-15 | 2016-05-17 | Michael V. Liguori | Object memory management system |
| US8873800B2 (en) * | 2010-07-21 | 2014-10-28 | Sony Corporation | Image processing apparatus and method, and program |
| US20120020550A1 (en) * | 2010-07-21 | 2012-01-26 | Sony Corporation | Image processing apparatus and method, and program |
| RU2458397C1 (en) * | 2011-03-23 | 2012-08-10 | Федеральное государственное военное образовательное учреждение высшего профессионального образования "Военный авиационный инженерный университет" (г. Воронеж) Министерства обороны Российской Федерации | Method of searching for and recognising objects on digital images |
| RU2623891C2 (en) * | 2015-10-12 | 2017-06-29 | Федеральное государственное казенное военное образовательное учреждение высшего профессионального образования "Военный учебно-научный центр Военно-воздушных сил "Военно-воздушная академия имени профессора Н.Е. Жуковского и Ю.А. Гагарина" (г. Воронеж) Министерства обороны Российской Федерации | Method of detecting objects, determining geometric shape and orientation thereof on images |
| US11605220B2 (en) | 2018-12-19 | 2023-03-14 | Zhejiang Dahua Technology Co., Ltd. | Systems and methods for video surveillance |
| CN115122602A (en) * | 2022-05-23 | 2022-09-30 | 宁波冬阳科技有限公司 | Intelligent control method and system for injection molding machine |
Similar Documents
| Publication | Publication Date | Title |
|---|---|---|
| US6532301B1 (en) | Object recognition with occurrence histograms | |
| US6477272B1 (en) | Object recognition with co-occurrence histograms and false alarm probability analysis for choosing optimal object recognition process parameters | |
| Chang et al. | Object recognition with color cooccurrence histograms | |
| US6584221B1 (en) | Method for image retrieval with multiple regions of interest | |
| US7027643B2 (en) | Systems and methods for automatic scale selection in real-time imaging | |
| US9141871B2 (en) | Systems, methods, and software implementing affine-invariant feature detection implementing iterative searching of an affine space | |
| US6807286B1 (en) | Object recognition using binary image quantization and hough kernels | |
| Han et al. | Fuzzy color histogram and its use in color image retrieval | |
| Shakhnarovich et al. | Fast pose estimation with parameter-sensitive hashing | |
| Murillo et al. | Surf features for efficient robot localization with omnidirectional images | |
| US7254256B2 (en) | Method and computer program product for locating facial features | |
| US7957584B2 (en) | Fast object detection for augmented reality systems | |
| US7489804B2 (en) | Apparatus and method for trajectory-based identification of digital data content | |
| US20070071323A1 (en) | Apparatus and method for processing user-specified search image points | |
| US20120301014A1 (en) | Learning to rank local interest points | |
| JP2001307096A (en) | Image recognition device and method | |
| EP1631933A1 (en) | Human figure contour outlining in images | |
| Worthington et al. | Object recognition using shape-from-shading | |
| US6947869B2 (en) | Efficient near neighbor search (ENN-search) method for high dimensional data sets with noise | |
| Huet et al. | Shape recognition from large image libraries by inexact graph matching | |
| US6788818B1 (en) | System and process for optimizing false alarm probability for histogram matching | |
| Fu | Application of pattern recognition to remote sensing | |
| Pajares et al. | The non-parametric Parzen's window in stereo vision matching | |
| Marlinda et al. | Matching Images On The Face Of A Buddha Statue Using The Scale Invariant Feature Transform (SIFT) Method | |
| Winters et al. | Information sampling for appearance based 3d object recognition and pose estimation |
Legal Events
| Date | Code | Title | Description |
|---|---|---|---|
| AS | Assignment |
Owner name: MICROSOFT CORPORATION, WASHINGTON Free format text: ASSIGNMENT OF ASSIGNORS INTEREST;ASSIGNOR:KRUMM, JOHN;REEL/FRAME:010150/0241 Effective date: 19990728 |
|
| STCF | Information on status: patent grant |
Free format text: PATENTED CASE |
|
| CC | Certificate of correction | ||
| CC | Certificate of correction | ||
| CC | Certificate of correction | ||
| FPAY | Fee payment |
Year of fee payment: 4 |
|
| FPAY | Fee payment |
Year of fee payment: 8 |
|
| FPAY | Fee payment |
Year of fee payment: 12 |
|
| AS | Assignment |
Owner name: MICROSOFT TECHNOLOGY LICENSING, LLC, WASHINGTON Free format text: ASSIGNMENT OF ASSIGNORS INTEREST;ASSIGNOR:MICROSOFT CORPORATION;REEL/FRAME:034541/0001 Effective date: 20141014 |
|
| AS | Assignment |
Owner name: MICROSOFT CORPORATION, WASHINGTON Free format text: ASSIGNMENT OF ASSIGNORS INTEREST;ASSIGNOR:CHANG, PENG;REEL/FRAME:041234/0720 Effective date: 20000509 |