US6505125B1 - Methods and computer software products for multiple probe gene expression analysis - Google Patents
Methods and computer software products for multiple probe gene expression analysis Download PDFInfo
- Publication number
- US6505125B1 US6505125B1 US09/670,510 US67051000A US6505125B1 US 6505125 B1 US6505125 B1 US 6505125B1 US 67051000 A US67051000 A US 67051000A US 6505125 B1 US6505125 B1 US 6505125B1
- Authority
- US
- United States
- Prior art keywords
- probes
- nucleic acid
- hybridization
- probe
- experiments
- Prior art date
- Legal status (The legal status is an assumption and is not a legal conclusion. Google has not performed a legal analysis and makes no representation as to the accuracy of the status listed.)
- Expired - Lifetime, expires
Links
Images


Classifications
-
- C—CHEMISTRY; METALLURGY
- C12—BIOCHEMISTRY; BEER; SPIRITS; WINE; VINEGAR; MICROBIOLOGY; ENZYMOLOGY; MUTATION OR GENETIC ENGINEERING
- C12Q—MEASURING OR TESTING PROCESSES INVOLVING ENZYMES, NUCLEIC ACIDS OR MICROORGANISMS; COMPOSITIONS OR TEST PAPERS THEREFOR; PROCESSES OF PREPARING SUCH COMPOSITIONS; CONDITION-RESPONSIVE CONTROL IN MICROBIOLOGICAL OR ENZYMOLOGICAL PROCESSES
- C12Q1/00—Measuring or testing processes involving enzymes, nucleic acids or microorganisms; Compositions therefor; Processes of preparing such compositions
- C12Q1/68—Measuring or testing processes involving enzymes, nucleic acids or microorganisms; Compositions therefor; Processes of preparing such compositions involving nucleic acids
- C12Q1/6809—Methods for determination or identification of nucleic acids involving differential detection
-
- C—CHEMISTRY; METALLURGY
- C12—BIOCHEMISTRY; BEER; SPIRITS; WINE; VINEGAR; MICROBIOLOGY; ENZYMOLOGY; MUTATION OR GENETIC ENGINEERING
- C12Q—MEASURING OR TESTING PROCESSES INVOLVING ENZYMES, NUCLEIC ACIDS OR MICROORGANISMS; COMPOSITIONS OR TEST PAPERS THEREFOR; PROCESSES OF PREPARING SUCH COMPOSITIONS; CONDITION-RESPONSIVE CONTROL IN MICROBIOLOGICAL OR ENZYMOLOGICAL PROCESSES
- C12Q1/00—Measuring or testing processes involving enzymes, nucleic acids or microorganisms; Compositions therefor; Processes of preparing such compositions
- C12Q1/68—Measuring or testing processes involving enzymes, nucleic acids or microorganisms; Compositions therefor; Processes of preparing such compositions involving nucleic acids
- C12Q1/6813—Hybridisation assays
- C12Q1/6834—Enzymatic or biochemical coupling of nucleic acids to a solid phase
-
- G—PHYSICS
- G16—INFORMATION AND COMMUNICATION TECHNOLOGY [ICT] SPECIALLY ADAPTED FOR SPECIFIC APPLICATION FIELDS
- G16B—BIOINFORMATICS, i.e. INFORMATION AND COMMUNICATION TECHNOLOGY [ICT] SPECIALLY ADAPTED FOR GENETIC OR PROTEIN-RELATED DATA PROCESSING IN COMPUTATIONAL MOLECULAR BIOLOGY
- G16B25/00—ICT specially adapted for hybridisation; ICT specially adapted for gene or protein expression
- G16B25/10—Gene or protein expression profiling; Expression-ratio estimation or normalisation
-
- G—PHYSICS
- G16—INFORMATION AND COMMUNICATION TECHNOLOGY [ICT] SPECIALLY ADAPTED FOR SPECIFIC APPLICATION FIELDS
- G16B—BIOINFORMATICS, i.e. INFORMATION AND COMMUNICATION TECHNOLOGY [ICT] SPECIALLY ADAPTED FOR GENETIC OR PROTEIN-RELATED DATA PROCESSING IN COMPUTATIONAL MOLECULAR BIOLOGY
- G16B40/00—ICT specially adapted for biostatistics; ICT specially adapted for bioinformatics-related machine learning or data mining, e.g. knowledge discovery or pattern finding
- G16B40/10—Signal processing, e.g. from mass spectrometry [MS] or from PCR
-
- G—PHYSICS
- G16—INFORMATION AND COMMUNICATION TECHNOLOGY [ICT] SPECIALLY ADAPTED FOR SPECIFIC APPLICATION FIELDS
- G16B—BIOINFORMATICS, i.e. INFORMATION AND COMMUNICATION TECHNOLOGY [ICT] SPECIALLY ADAPTED FOR GENETIC OR PROTEIN-RELATED DATA PROCESSING IN COMPUTATIONAL MOLECULAR BIOLOGY
- G16B40/00—ICT specially adapted for biostatistics; ICT specially adapted for bioinformatics-related machine learning or data mining, e.g. knowledge discovery or pattern finding
Definitions
- Many biological functions are carried out by regulating the expression levels of various genes, either through changes in the copy number of the genetic DNA, through changes in levels of transcription (e.g. through control of initiation, provision of RNA precursors, RNA processing, etc.) of particular genes, or through changes in protein synthesis.
- control of the cell cycle and cell differentiation, as well as diseases are characterized by the variations in the transcription levels of a group of genes.
- the current invention provides methods and computer software products for analyzing data from gene expression monitoring experiments that employ multiple probes against a single target.
- methods for determining the relative level of a biological molecule in a plurality of experiments.
- a plurality of signals where each of the signals reflects the level of the biological molecule in one of the experiments are determined.
- the relative level of the molecule is then determined by calculating a principal component.
- the biological molecule is a nucleic acid such as a transcript of a gene.
- the signals reflect the hybridization of nucleic acid probes, at least 3 probes, preferably at least 5 probes, more preferably at least 10 probes, even more preferably at least 15 probes and in some instances at least 20 probes, with the target nucleic acid.
- the probes are immobilized on a solid substrate.
- the signals are derived from hybridization between perfect match probes (PM) designed to be complementary against the target nucleic acid and mismatch probes (MM) designed to contain at least one mismatch against the target nucleic acid.
- the signals are the hybridization intensity difference (PM ⁇ MM).
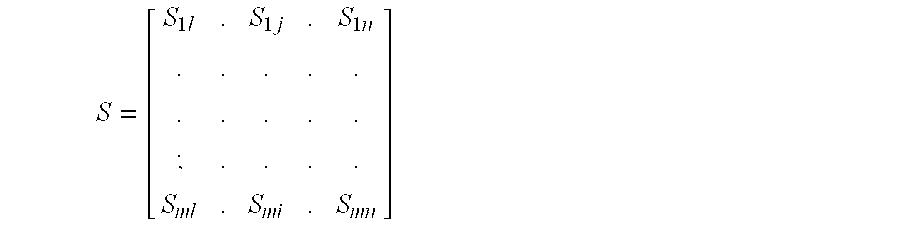
- S ij is the signal of the jth probe reflects the level of the molecule in the ith experiment.
- Eigenvectors, e i and their corresponding eigenvalues, ⁇ , of the matrix Tare calculated.
- the relative level of the molecule is indicated with e max , the eigenvector associated with the largest eigenvalue.
- the angles ( ⁇ j ) between the vector e max , and each of the signal vectors (S j ) are calculated.
- the probes may have detected a sequence variation from the reference sequence used to design the probes.
- the sequence variation may be the target region of a probe (j) associated with the ⁇ j which is different from others.
- methods for selecting nucleic acid probes from a pool of candidate nucleic acid probes are provided.
- hybridization intensities between each of the candidate probes with the target nucleic acid in a plurality of experiments are measured.
- the inner product of normalized eigenvector associated with the largest eigenvalue and normalized experimental hybridization intensity for each candidate probe is calculated.
- the probes with the highest inner product values are selected.
- the nucleic acid probes and the candidate nucleic acid probes may be oligonucleotide probes immobilized on a substrate.
- computer software products for analyzing the level of a biological molecule, preferably a transcript of a gene.
- the computer software product contains computer program code that inputs a plurality of signals.
- the signals reflect the level of the biological molecule in one of a plurality of experiments.
- the computer software product also contains computer program code that determines the relative level of the biological molecule by calculating at least one principal component.
- the computer program codes are stored in a computer readable media.
- the biological molecule is preferably a nucleic acid, such as a transcript of a gene, and the plurality of signals reflect the hybridization of a plurality of nucleic acid probes with the nucleic acid.
- the signals are derived from hybridization between perfect match probes (PM) designed to be complementary against a target nucleic acid and mismatch probes (MM) designed to contain at least one mismatch against the target nucleic acid.
- the signals may be the intensity difference (PM ⁇ MM).
- the computer software product also calculates eigenvectors, e i , and their corresponding eigenvalues, ⁇ , of said matrix T; and indicates the relative level with e max , the eigenvector associated with the largest eigenvalue.
- sequence variation indicates that sequence variation has been detected if any ⁇ j is substantially different from the others.
- the sequence variation is indicated as in the target region of a probe (j) associated with said any ⁇ j .
- a canonical vector is used to calculate a gene expression index (GEI) or other measurement of gene expression from intensity data obtained from multiple probes.
- S j is hybridization intensity for the jth probe and c j is the value for the jth probe.
- the GEI may then be used as a relative level of expression, for calculating the absolute amount of the transcript (with appropriate controls) and for making a qualitative or semi-qualitative calls (present, absent, etc.)
- the probes for a large number of genes are synthesized or deposited on a substrate to make a gene expression monitoring chip.
- the probes (preferably immobilized on a chip) are tested on various samples.
- the samples may represent various states of the expression of the target gene.
- the hybridization intensity values obtained constitutes a vector S of equation 1 for each target gene.
- the vector is of the size m ⁇ n. m is the number of samples tested and n is the number of probes for a target gene (the number of probes may be different for different target genes).
- a vector P may be calculated by multiplying the transposed S with S:
- P has the dimension of n ⁇ n.
- the eigenvector of P of matrix P associated with the largest eigenvalue may be used as a canonical vector.
- FIG. 1 illustrates an example of a computer system that may be utilized to execute the software of an embodiment of the invention.
- FIG. 2 illustrates a system block diagram of the computer system of FIG. 1 .
- FIG. 3 is a flow chart illustrating a gene expression data analysis process performed by one embodiment of the software of the invention.
- FIG. 4 shows the values of scaled PM ⁇ MM for all the 20 probe pairs in 17 experiments in the example.
- FIG. 5 shows the eigenvectors for the matrix in FIG. 4 .
- FIG. 6 shows the eigenvalues for the matrix in FIG. 4 .
- FIG. 7 shows comparison among three methods for analyzing relative gene expression
- FIG. 8 shows percentage changes of expression among experiments.
- FIG. 9 shows the matrix of the Example.
- FIG. 10 shows the eigenvectors for the matrix in FIG. 9 .
- FIG. 11 shows the eigenvalues for the matrix in FIG. 10 .
- FIG. 12 shows the comparison of several methods for gene expression analysis.
- the present invention may be embodied as a method, data processing system or program products. Accordingly, the present invention may take the form of data analysis systems, methods, analysis software and etc.
- Software written according to the present invention is to be stored in some form of computer readable medium, such as memory, or CD ROM, or transmitted over a network, and executed by a processor.
- FIG. 1 illustrates an example of a computer system that may be used to execute the software of an embodiment of the invention.
- FIG. 1 shows a computer system 1 that includes a display 3 , screen 5 , cabinet 7 , keyboard 9 , and mouse 11 .
- Mouse 11 may have one or more buttons for interacting with a graphic user interface.
- Cabinet 7 houses a CD-ROM or DVD-ROM drive 13 , system memory and a hard drive (see, FIG. 2) which may be utilized to store and retrieve software programs incorporating computer code that implements the invention, data for use with the invention and the like.
- a CD 15 is shown as an exemplary computer readable medium, other computer readable storage media including floppy disk, tape, flash memory, system memory, and hard drive may be utilized.
- a data signal embodied in a carrier wave (e.g., in a network including the internet) may be the computer readable storage medium.
- FIG. 2 shows a system block diagram of computer system 1 used to execute the software of an embodiment of the invention.
- computer system 1 includes monitor 3 , and keyboard 9 , and mouse 11 .
- Computer system 1 further includes subsystems such as a central processor 51 , system memory 53 , fixed storage 55 (e.g., hard drive), removable storage 57 (e.g., CD-ROM), display adapter 59 , sound card 61 , speakers 63 , and network interface 65 .
- Other computer systems suitable for use with the invention may include additional or fewer subsystems.
- another computer system may include more than one processor 51 or a cache memory.
- Computer systems suitable for use with the invention may also be embedded in a measurement instrument. The embedded systems may control the operation of, for example, a GeneChip® Probe array scanner as well as executing computer codes of the invention.
- This invention provides methods, systems and computer software products for analyzing the level of transcripts using nucleic acid arrays.
- the methods, systems and computer software products are also useful for analyzing any biological variables (such as level of proteins, activities of enzymes, etc.) where such variables are detected by at least two ways of measurement using two probes, sensors or the like.
- the transcription pattern (the form and level of transcripts) may be determined by examining a sample containing the transcripts.
- a biological sample from cells of interest is obtained and a nucleic acid sample is prepared.
- nucleic acid samples may contain transcripts of interest or alternatively, may contain nucleic acids derived from the transcripts of interest.
- a nucleic acid derived from a transcript refers to a nucleic acid for whose synthesis the mRNA transcript or a subsequence thereof has ultimately served as a template.
- a eDNA reverse transcribed from a transcript, an RNA transcribed from that cDNA, a DNA amplified from the cDNA, an RNA transcribed from the amplified DNA, etc. are all derived from the transcript and detection of such derived products is indicative of the presence and/or abundance of the original transcript in a sample.
- suitable samples include, but are not limited to, transcripts of the gene or genes, cDNA reverse transcribed from the transcript, cRNA transcribed from the cDNA, DNA amplified from the genes, RNA transcribed from amplified DNA, and the like.
- Transcripts may include, but not limited to pre-mRNA nascent transcript(s), transcript processing intermediates, mature mRNA(s) and degradation products.
- such a sample is a homogenate of cells or tissues or other biological samples.
- such sample is a total RNA preparation of a biological sample.
- such a nucleic acid sample is the total mRNA isolated from a biological sample.
- the total mRNA prepared with most methods includes not only the mature mRNA, but also the RNA processing intermediates and nascent pre-mRNA transcripts.
- total mRNA purified with poly (T) column contains RNA molecules with poly (A) tails. Those poly A+ RNA molecules could be mature mRNA, RNA processing intermediates, nascent transcripts or degradation intermediates.
- Biological samples may be of any biological tissue or fluid or cells. Typical samples include, but are not limited to, sputum, blood, blood cells (e.g., white cells), tissue or fine needle biopsy samples, urine, peritoneal fluid, and pleural fluid, or cells therefrom. Biological samples may also include sections of tissues such as frozen sections taken for histological purposes.
- Another typical source of biological samples are cell cultures where gene expression states can be manipulated to explore the relationship among genes.
- RNase present in homogenates before homogenates can be used for hybridization.
- Methods of inhibiting or destroying nucleases are well known in the art.
- cells or tissues are homogenized in the presence of chaotropic agents to inhibit nuclease.
- RNase are inhibited or destroyed by heart treatment followed by proteinase treatment.
- the total RNA is isolated from a given sample using, for example, an acid guanidinium-phenol-chloroform extraction method and polyA + mRNA is isolated by oligo dT column chromatography or by using (dT)n magnetic beads (see, e.g., Sambrook et al., Molecular Cloning: A Laboratory Manual (2nd ed.), Vols. 1-3, Cold Spring Harbor Laboratory, (1989), or Current Protocols in Molecular Biology, F. Ausubel et al., ed. Greene Publishing and Wiley-lnterscience, New York (1987)).
- total RNA is isolated from mammalian cells using RNeasy Total RNA isolation kit (QIAGEN). If mammalian tissue is used as the source of RNA, a commercial reagent such as TRIzol Reagent (GIBCOL Life Technologies). A second cleanup after the ethanol precipitation step in the TRIzol extraction using Rneasy total RNA isolation kit may be beneficial.
- Good quality mRNA may be obtained by, for example, first isolating total RNA and then isolating the mRNA from the total RNA using Oligotex mRNA kit (QIAGEN).
- Total RNA from prokaryotes such as E. coli. cells, may be obtained by following the protocol for MasterPure complete DNA/RNA purification kit from Epicentre Technologies (Madison, Wis.).
- Quantitative amplification involves simultaneously co-amplifying a known quantity of a control sequence using the same primers. This provides an internal standard that may be used to calibrate the PCR reaction. The high density array may then include probes specific to the internal standard for quantification of the amplified nucleic acid.
- PCR polymerase chain reaction
- LCR ligase chain reaction
- RT-PCR typically incorporates preliminary steps to isolate total RNA or mRNA for subsequent use as an amplification template.
- One tube mRNA capture method may be used to prepare poly(A)+ RNA samples suitable for immediate RT-PCR in the same tube (Boehringer Mannheim). The captured mRNA can be directly subjected to RT-PCR by adding a reverse transcription mix and, subsequently, a PCR mix.
- the sample mRNA is reverse transcribed with a reverse transcriptase and a primer consisting of oligo dT and a sequence encoding the phage T7 promoter to provide a single stranded DNA template.
- the second DNA strand is polymerized using a DNA polymerase with or without primers (See, U.S. patent application Ser. No. 09/102,167, and U.S. Provisional Application Serial No. 60/172,340, both incorporated herein by reference for all purposes).
- T7 RNA polymerase is added and RNA is transcribed from the cDNA template. Successive rounds of transcription from each single cDNA template results in amplified RNA.
- in vitro polymerization Methods of in vitro polymerization are well known to those of skill in the art (see, e.g., Sambrook, supra.) and this particular method is described in detail by Van Gelder, et al., Proc. Natl. Acad. Sci. USA, 87: 1663-1667 (1990). Moreover, Eberwine et al. Proc. Natl. Acad. Sci. USA, 89: 3010-3014 provide a protocol that uses two rounds of amplification via in vitro transcription to achieve greater than 10 6 fold amplification of the original starting material thereby permitting expression monitoring even where biological samples are limited.
- the in-vitro transcription reaction may be coupled with labeling of the resulting cRNA with biotin using Bioarray high yield RNA transcript labeling kit (Enzo P/N 900182).
- the resulting cRNA may be fragmented.
- One preferred method for fragmentation employs Rnase free RNA fragmentation buffer (200 mM tris-acetate, pH 8.1, 500 mM potassium acetate, 150 mM magnesium acetate). Approximately 20 ⁇ g of cRNA is mixed with 8 ⁇ L of the fragmentation buffer. Rnase free water is added to make the volume to 40 ⁇ L. The mixture may be incubated at 94° C. for 35 minutes and chilled in ice.
- the direct transcription method described above provides an antisense (aRNA) pool.
- aRNA antisense
- the oligonucleotide probes provided in the array are chosen to be complementary to subsequences of the antisense nucleic acids.
- the target nucleic acid pool is a pool of sense nucleic acids
- the oligonucleotide probes are selected to be complementary to subsequences of the sense nucleic acids.
- the probes may be of either sense as the target nucleic acids include both sense and antisense strands.
- the protocols cited above include methods of generating pools of either sense or antisense nucleic acids. Indeed, one approach can be used to generate either sense or antisense nucleic acids as desired.
- the cDNA can be directionally cloned into a vector (e.g., Stratagene's p Bluscript II KS (+) phagemid) such that it is flanked by the T3 and T7 promoters. In vitro transcription with the T3 polymerase will produce RNA of one sense (the sense depending on the orientation of the insert), while in vitro transcription with the T7 polymerase will produce RNA having the opposite sense.
- a vector e.g., Stratagene's p Bluscript II KS (+) phagemid
- In vitro transcription with the T3 polymerase will produce RNA of one sense (the sense depending on the orientation of the insert), while in vitro transcription with the T7 polymerase will produce RNA having the opposite sense.
- Other suitable cloning systems include phage lambda
- the biological sample should contain nucleic acids that reflects the level of at least some of the transcripts present in the cell, tissue or organ of the species of interest.
- the biological sample may be prepared from cell, tissue or organs of a particular status. For example, a total RNA preparation from the pituitary of a dog when the dog is pregnant.
- samples may be prepared from E. Coli cells after the cells are treated with IPTG. Because certain genes may only be expressed under certain conditions, biological samples derived under various conditions may be needed to observe all transcripts.
- the transcriptional annotation may be specific for a particular physiological, pharmacological or toxicological condition. For example, certain regions of a gene may only be transcribed under specific physiological conditions. Transcript annotation obtained using biological samples from the specific physiological conditions may not be applicable to other physiological conditions.
- One preferred method for detection of transcripts uses high density oligonucleotide probe arrays.
- High density oligonucleotide probe arrays and their use for transcript detection are described in, for example, U.S. Pat. Nos. 5,800,992, 6,040,193 and 5,831,070.
- the high density array will typically include a number of probes that specifically hybridize to the sequences of interest including potential and putative transcripts.
- the array will include one or more control probes.
- the high density array chip includes test probes.
- Probes could be oligonucleotides that range from about 5 to about 45 or 5 to about 500 nucleotides, more preferably from about 10 to about 40 nucleotides and most preferably from about 15 to about 40 nucleotides in length. In other particularly preferred embodiments the probes are 20 or 25 nucleotides in length.
- test probes are double or single strand DNA sequences. DNA sequences are isolated or cloned from nature sources or amplified from nature sources using nature nucleic acid as templates. These probes have sequences complementary to particular subsequences of the genes whose expression they are designed to detect. Thus, the test probes are capable of specifically hybridizing to the target nucleic acid they are to detect.
- the high density array can contain a number of control probes.
- the control probes may be: 1) Normalization controls; 2) Expression level controls; and 3) Mismatch controls which are designed to contain at least one base that is different from that of a target sequence or not complementary with the target sequence.
- Normalization controls are oligonucleotide or other nucleic acid probes that are complementary to labeled reference oligonucleotides or other nucleic acid sequences that are added to the nucleic acid sample.
- the signals obtained from the normalization controls after hybridization provide a control for variations in hybridization conditions, label intensity, “reading” efficiency and other factors that may cause the signal of a perfect hybridization to vary between arrays.
- signals (e.g., fluorescence intensity) read from all other probes in the array are divided by the signal (e.g., fluorescence intensity) from the control probes thereby normalizing the measurements.
- Virtually any probe may serve as a normalization control.
- Preferred normalization probes are selected to reflect the average length of the other probes present in the array, however, they can be selected to cover a range of lengths.
- the normalization control(s) can also be selected to reflect the (average) base composition of the other probes in the array, however in a preferred embodiment, only one or a few normalization probes are used and they are selected such that they hybridize well (i.e. no secondary structure) and do not match any target-specific probes.
- Expression level controls are probes that hybridize specifically with constitutively expressed genes in the biological sample. Virtually any constitutively expressed gene provides a suitable target for expression level controls. Typically expression level control probes have sequences complementary to subsequences of constitutively expressed “housekeeping genes” including, but not limited to the ⁇ -actin gene, the transferrin receptor gene, the GAPDH gene, and the like.
- Mismatch controls may also be provided for the probes to the target genes, for expression level controls or for normalization controls.
- Mismatch controls are oligonucleotide probes or other nucleic acid probes designed to be identical to their corresponding test, target or control probes except for the presence of one or more mismatched bases.
- a mismatched base is a base selected so that it is not complementary to the corresponding base in the target sequence to which the probe would otherwise specifically hybridize.
- One or more mismatches are selected such that under appropriate hybridization conditions (e.g. stringent conditions) the test or control probe would be expected to hybridize with its target sequence, but the mismatch probe would not hybridize (or would hybridize to a significantly lesser extent).
- Preferred mismatch probes contain a central mismatch.
- a corresponding mismatch probe will have the identical sequence except for a single base mismatch (e.g., substituting a G, a C or a T for an A) at any of positions 6 through 14 (the central mismatch).
- Mismatch probes thus provide a control for non-specific binding or cross-hybridization to a nucleic acid in the sample other than the target to which the probe is directed.
- the difference in intensity between the perfect match and the mismatch probe (I(PM) ⁇ I(MM)) provides a good measure of the concentration of the hybridized material.
- the high density array may also include sample preparation/amplification control probes. These are probes that are complementary to subsequences of control genes selected because they do not normally occur in the nucleic acids of the particular biological sample being assayed. Suitable sample preparation/amplification control probes include, for example, probes to bacterial genes (e.g., Bio B) where the sample in question is a biological from a eukaryote.
- sample preparation/amplification control probes include, for example, probes to bacterial genes (e.g., Bio B) where the sample in question is a biological from a eukaryote.
- RNA sample is then spiked with a known amount of the nucleic acid to which the sample preparation/amplification control probe is directed before processing. Quantification of the hybridization of the sample preparation/amplification control probe then provides a measure of alteration in the abundance of the nucleic acids caused by processing steps (e.g. PCR, reverse transcription, in vitro transcription, etc.).
- processing steps e.g. PCR, reverse transcription, in vitro transcription, etc.
- oligonucleotide probes in the high density array are selected to bind specifically to the nucleic acid target to which they are directed with minimal non-specific binding or cross-hybridization under the particular hybridization conditions utilized. Because the high density arrays of this invention can contain in excess of 1,000,000 different probes, it is possible to provide every probe of a characteristic length that binds to a particular nucleic acid sequence. Thus, for example, the high density array can contain every possible 20 mer sequence complementary to an IL-2 mRNA.
- probes directed to these subsequences are expected to cross hybridize with occurrences of their complementary sequence in other regions of the sample genome.
- other probes simply may not hybridize effectively under the hybridization conditions (e.g., due to secondary structure, or interactions with the substrate or other probes).
- the probes that show such poor specificity or hybridization efficiency are identified and may not be included either in the high density array itself (e.g., during fabrication of the array) or in the post-hybridization data analysis.
- Probes as short as 15, 20, or 25 nucleotide are sufficient to hybridize to a subsequence of a gene and that, for most genes, there is a set of probes that performs well across a wide range of target nucleic acid concentrations. In a preferred embodiment, it is desirable to choose a preferred or “optimum” subset of probes for each gene before synthesizing the high density array.
- the expression of a particular transcript may be detected by a plurality of probes, typically, 5, 10, 15, 20, 30 or 40 probes.
- Each of the probes may target different sub-regions of the transcript. However, probes may overlap over targeted regions.
- each target sub-region is detected using two probes: a perfect match (PM) probe that is designed to be completely complementary to a reference or target sequence.
- a PM probe may be substantially complementary to the reference sequence.
- a mismatch (MM) probe is a probe that is designed to be complementary to a reference sequence except for some mismatches that may significantly affect the hybridization between the probe and its target sequence.
- MM probes are designed to be complementary to a reference sequence except for a homomeric base mismatch at the central(e.g., 13 th in a 25 base probe) position.
- Mismatch probes are normally used as controls for cross-hybridization.
- a probe pair is usually composed of a PM and its corresponding MM probe. The difference between PM and MM provides an intensity difference in a probe pair.
- Mismatch probes are not essential in many embodiments of the invention.
- oligonucleotide analogue array can be synthesized on a solid substrate by a variety of methods, including, but not limited to, light-directed chemical coupling, and mechanically directed coupling. See Pirrung et al., U.S. Pat. No.
- VLSIPSTM technology as described in the above-noted U.S. Pat. No. 5,143,854 and PCT patent publication Nos. WO 90/15070 and 92/10092, is considered pioneering technology in the fields of combinatorial synthesis and screening of combinatorial libraries.
- a glass surface is derivatized with a silane reagent containing a functional group, e.g., a hydroxyl or amine group blocked by a photolabile protecting group.
- a functional group e.g., a hydroxyl or amine group blocked by a photolabile protecting group.
- Photolysis through a photolithogaphic mask is used selectively to expose functional groups which are then ready to react with incoming 5′-photoprotected nucleoside phosphoramidites.
- the phosphoramidites react only with those sites which are illuminated (and thus exposed by removal of the photolabile blocking group).
- the phosphoramidites only add to those areas selectively exposed from the preceding step. These steps are repeated until the desired array of sequences have been synthesized on the solid surface. Combinatorial synthesis of different oligonucleotide analogues at different locations on the array is determined by the pattern of illumination during synthesis and the order of addition of coupling reagents.
- Peptide nucleic acids are commercially available from, e.g., Biosearch, Inc. (Bedford, MA) which comprise a polyamide backbone and the bases found in naturally occurring nucleosides. Peptide nucleic acids are capable of binding to nucleic acids with high specificity, and are considered “oligonucleotide analogues” for purposes of this disclosure.
- a typical “flow channel” method applied to the compounds and libraries of the present invention can generally be described as follows. Diverse polymer sequences are synthesized at selected regions of a substrate or solid support by forming flow channels on a surface of the substrate through which appropriate reagents flow or in which appropriate reagents are placed. For example, assume a monomer “A” is to be bound to the substrate in a first group of selected regions. If necessary, all or part of the surface of the substrate in all or a part of the selected regions is activated for binding by, for example, flowing appropriate reagents through all or some of the channels, or by washing the entire substrate with appropriate reagents.
- a reagent having the monomer A flows through or is placed in all or some of the channel(s).
- the channels provide fluid contact to the first selected regions, thereby binding the monomer A on the substrate directly or indirectly (via a spacer) in the first selected regions.
- a monomer B is coupled to second selected regions, some of which may be included among the first selected regions.
- the second selected regions will be in fluid contact with a second flow channel(s) through translation, rotation, or replacement of the channel block on the surface of the substrate; through opening or closing a selected valve; or through deposition of a layer of chemical or photoresist.
- a step is performed for activating at least the second regions.
- the monomer B is flowed through or placed in the second flow channel(s), binding monomer B at the second selected locations.
- the resulting sequences bound to the substrate at this stage of processing will be, for example, A, B, and AB. The process is repeated to form a vast array of sequences of desired length at known locations on the substrate.
- monomer A can be flowed through some of the channels, monomer B can be flowed through other channels, monomer C can be flowed through still other channels, etc.
- monomer A can be flowed through some of the channels, monomer B can be flowed through other channels, monomer C can be flowed through still other channels, etc.
- a protective coating such as a hydrophilic or hydrophobic coating (depending upon the nature of the solvent) is utilized over portions of the substrate to be protected, sometimes in combination with materials that facilitate wetting by the reactant solution in other regions. In this manner, the flowing solutions are further prevented from passing outside of their designated flow paths.
- High density nucleic acid arrays can be fabricated by depositing presynthezied or nature nucleic acids in predefined positions. As disclosed in U.S. Pat. No. 5,040,138, and its parent applications, previously incorporated by reference for all purposes, synthesized or nature nucleic acids are deposited on specific locations of a substrate by light directed targeting and oligonucleotide directed targeting. Nucleic acids can also be directed to specific locations in much the same manner as the flow channel methods. For example, a nucleic acid A can be delivered to and coupled with a first group of reaction regions which have been appropriately activated. Thereafter, a nucleic acid B can be delivered to and reacted with a second group of activated reaction regions. Nucleic acids are deposited in selected regions.
- Typical dispensers include a micropipette or capillary pin to deliver nucleic acid to the substrate and a robotic system to control the position of the micropipette with respect to the substrate.
- the dispenser includes a series of tubes, a manifold, an array of pipettes or capillary pins, or the like so that various reagents can be delivered to the reaction regions simultaneously.
- Nucleic acid hybridization simply involves contacting a probe and target nucleic acid under conditions where the probe and its complementary target can form stable hybrid duplexes through complementary base pairing. The nucleic acids that do not form hybrid duplexes are then washed away leaving the hybridized nucleic acids to be detected, typically through detection of an attached detectable label. It is generally recognized that nucleic acids are denatured by increasing the temperature or decreasing the salt concentration of the buffer containing the nucleic acids. Under low stringency conditions (e.g., low temperature and/or high salt) hybrid duplexes (e.g., DNA:DNA, RNA:RNA, or RNA:DNA) will form even where the annealed sequences are not perfectly complementary. Thus specificity of hybridization is reduced at lower stringency. Conversely, at higher stringency (e.g., higher temperature or lower salt) successful hybridization requires fewer mismatches.
- low stringency conditions e.g., low temperature and/or high salt
- hybridization conditions may be selected to provide any degree of stringency.
- hybridization is performed at low stringency in this case in 6 ⁇ SSPE-T at 37 C. (0.005% Triton X-100) to ensure hybridization and then subsequent washes are performed at higher stringency (e.g., 1 ⁇ SSPE-T at 37 C.) to eliminate mismatched hybrid duplexes.
- Successive washes may be performed at increasingly higher stringency (e.g., down to as low as 0.25 ⁇ SSPE-T at 37 C. to 50 C.) until a desired level of hybridization specificity is obtained.
- Stringency can also be increased by addition of agents such as formamide.
- Hybridization specificity may be evaluated by comparison of hybridization to the test probes with hybridization to the various controls that can be present (e.g., expression level control, normalization control, mismatch controls, etc.).
- the wash is performed at the highest stringency that produces consistent results and that provides a signal intensity greater than approximately 10% of the background intensity.
- the hybridized array may be washed at successively higher stringency solutions and read between each wash. Analysis of the data sets thus produced will reveal a wash stringency above which the hybridization pattern is not appreciably altered and which provides adequate signal for the particular oligonucleotide probes of interest.
- background signal is reduced by the use of a detergent (e.g., C-TAB) or a blocking reagent (e.g., sperm DNA, cot-1 DNA, etc.) during the hybridization to reduce non-specific binding.
- a detergent e.g., C-TAB
- a blocking reagent e.g., sperm DNA, cot-1 DNA, etc.
- the hybridization is performed in the presence of about 0.5 mg/ml DNA (e.g., herring sperm DNA).
- the use of blocking agents in hybridization is well known to those of skill in the art (see, e.g., Chapter 8 in P. Tijssen, supra.)
- duplexes formed between RNAs or DNAs are generally in the order of RNA:RNA>RNA:DNA>DNA:DNA, in solution.
- Long probes have better duplex stability with a target, but poorer mismatch discrimination than shorter probes (mismatch discrimination refers to the measured hybridization signal ratio between a perfect match probe and a single base mismatch probe).
- Shorter probes e.g., 8-mers discriminate mismatches very well, but the overall duplex stability is low.
- T m thermal stability
- A-T duplexes have a lower T m than guanine-cytosine (G-C) duplexes, due in part to the fact that the A-T duplexes have 2 hydrogen bonds per base-pair, while the G-C duplexes have 3 hydrogen bonds per base pair.
- oligonucleotide arrays in which there is a non-uniform distribution of bases, it is not generally possible to optimize hybridization for each oligonucleotide probe simultaneously.
- TMACI salt tetramethyl ammonium chloride
- Altered duplex stability conferred by using oligonucleotide analogue probes can be ascertained by following, e.g., fluorescence signal intensity of oligonucleotide analogue arrays hybridized with a target oligonucleotide over time.
- the data allow optimization of specific hybridization conditions at, e.g., room temperature. (for simplified diagnostic applications in the future).
- Another way of verifying altered duplex stability is by following the signal intensity generated upon hybridization with time. Previous experiments using DNA targets and DNA chips have shown that signal intensity increases with time, and that the more stable duplexes generate higher signal intensities faster than less stable duplexes. The signals reach a plateau or “saturate” after a certain amount of time due to all of the binding sites becoming occupied. These data allow for optimization of hybridization, and determination of the best conditions at a specified temperature.
- the hybridized nucleic acids are detected by detecting one or more labels attached to the sample nucleic acids.
- the labels may be incorporated by any of a number of means well known to those of skill in the art. However, in a preferred embodiment, the label is simultaneously incorporated during the amplification step in the preparation of the sample nucleic acids.
- PCR polymerase chain reaction
- transcription amplification as described above, using a labeled nucleotide (e.g. fluorescein-labeled UTP and/or CTP) incorporates a label into the transcribed nucleic acids.
- cRNAs synthesized using a RNA sample as a template cRNAs are synthesized using the cDNAs as templates using in vitro transcription (IVT).
- IVT in vitro transcription
- a biotin label may be incorporated during the IVT reaction (Enzo Bioarray high yield labeling kit).
- a label may be added directly to the original nucleic acid sample (e.g., mRNA, polyA mRNA, cDNA, etc.) or to the amplification product after the amplification is completed.
- Means of attaching labels to nucleic acids are well known to those of skill in the art and include, for example nick translation or end-labeling (e.g. with a labeled RNA) by kinasing of the nucleic acid and subsequent attachment (ligation) of a nucleic acid linker joining the sample nucleic acid to a label (e.g., a fluorophore).
- Detectable labels suitable for use in the present invention include any composition detectable by spectroscopic, photochemical, biochemical, immunochemical, electrical, optical or chemical means.
- Useful labels in the present invention include biotin for staining with labeled streptavidin conjugate, magnetic beads (e.g., Dynabeads TM), fluorescent dyes (e.g., fluorescein, texas red, rhodamine, green fluorescent protein, and the like), radiolabels (e.g., 3 H, 125 I, 35 S, 14 C, or 32 P), enzymes (e.g., horse radish peroxidase, alkaline phosphatase and others commonly used in an ELISA), and colorimetric labels such as colloidal gold or colored glass or plastic (e.g., polystyrene, polypropylene, latex, etc.) beads.
- Patents teaching the use of such labels include U.S. Pat. Nos. 3,817,837; 3,850,752;
- radiolabels may be detected using photographic film or scintillation counters
- fluorescent markers may be detected using a photodetector to detect emitted light
- Enzymatic labels are typically detected by providing the enzyme with a substrate and detecting the reaction product produced by the action of the enzyme on the substrate, and colorimetric labels are detected by simply visualizing the colored label.
- One particularly preferred method uses colloidal gold label that can be detected by measuring scattered light.
- the label may be added to the target (sample) nucleic acid(s) prior to, or after the hybridization.
- direct labels are detectable labels that are directly attached to or incorporated into the target (sample) nucleic acid prior to hybridization.
- indirect labels are joined to the hybrid duplex after hybridization.
- the indirect label is attached to a binding moiety that has been attached to the target nucleic acid prior to the hybridization.
- the target nucleic acid may be biotinylated before the hybridization. After hybridization, an aviden-conjugated fluorophore will bind the biotin bearing hybrid duplexes providing a label that is easily detected.
- Fluorescent labels are preferred and easily added during an in vitro transcription reaction.
- fluorescein labeled UTP and CTP are incorporated into the RNA produced in an in vitro transcription reaction as described above.
- Means of detecting labeled target (sample) nucleic acids hybridized to the probes of the high density array are known to those of skill in the art. Thus, for example, where a calorimetric label is used, simple visualization of the label is sufficient. Where a radioactive labeled probe is used, detection of the radiation (e.g. with photographic film or a solid state detector) is sufficient.
- the target nucleic acids are labeled with a fluorescent label and the localization of the label on the probe array is accomplished with fluorescent microscopy.
- the hybridized array is excited with a light source at the excitation wavelength of the particular fluorescent label and the resulting fluorescence at the emission wavelength is detected.
- the excitation light source is a laser appropriate for the excitation of the fluorescent label.
- the confocal microscope may be automated with a computer-controlled stage to automatically scan the entire high density array.
- the microscope may be equipped with a phototransducer (e.g., a photomultiplier, a solid state array, a CCD camera, etc.) attached to an automated data acquisition system to automatically record the fluorescence signal produced by hybridization to each oligonucleotide probe on the array.
- a phototransducer e.g., a photomultiplier, a solid state array, a CCD camera, etc.
- Such automated systems are described at length in U.S. Pat. No: 5,143,854, PCT Application 20 92/10092, and U.S. application Ser. No. 08/195,889 filed on Feb. 10, 1994.
- Use of laser illumination in conjunction with automated confocal microscopy for signal detection permits detection at a resolution of better than about 100 ⁇ m, more preferably better than about 50 ⁇ m, and most preferably better than about 25 ⁇ m.
- hybridization signals will vary in strength with efficiency of hybridization, the amount of label on the sample nucleic acid and the amount of the particular nucleic acid in the sample.
- nucleic acids present at very low levels e.g., ⁇ 1 pM
- concentration e.g., ⁇ 1 pM
- the signal becomes virtually indistinguishable from the background.
- a threshold intensity value may be selected below in which a signal is not counted as being essentially indistinguishable from the background.
- a single stranded DNA oligonucleotide designed to be complementary to a specific sequence is synthesized directly on the surface of the array using photolithography and combinatorial chemistry.
- a single square-shaped feature on an array contains one type of probe.
- Each probe cell may be of specific size such as 5, 16, 24 or 50 ⁇ m.
- the oligonucleotide probes on an array suitable for the embodiments of the invention may be pre-synthesized and then deposited on a substrate.
- the oligonucleotide probes may be synthesized using combinatorial chemistry in conjunction with an ink-jet like liquid deposition device.
- the method of the invention will be explained in great details using the above terminology associated with Affymetrix GeneChip® probe arrays.
- One of skill in the art would appreciate that the method of the invention is generally applicable to biological analysis using multiple probes (or other means of obtaining multiple measurements against one biological variable, such as level of a transcript, etc.).
- a typical situation for current implementation and usage for the GeneChip® probe array expression analysis is that there are 10, 15 or 20 probe pairs for each gene and a group of experiments to be compared among each other. It is apparent to those skilled in the art, the current invention is not limited to the number of probe pairs.
- the methods, systems and inventions are used to analyze data from experiments that employ at least two probe pairs, more preferably more than five probe pairs. Due to the nature of nucleic hybridization in complicated samples, certain probe pairs behaved abnormally in certain experiments.
- the methods for gene expression analysis employ principal component analysis to analyze results from experiments employing multiple probes.
- Principal component analysis is a statistical protocol to extract the main relations in data of high dimensionality.
- a common way to find the Principal Components of a data set is by calculating the eigenvectors of the data correlation matrix. These vectors give the directions in which the data cloud is stretched most.
- the projections of the data on the eigenvectors are the Principal Components.
- the corresponding eigenvalues give an indication of the amount of information the respective Principal Components represent.
- Principal Components corresponding to large eigenvalues represent much information in the data set and thus tell us much about the relations between the data points.
- Principal component analysis is described in, e.g., Jolliffe, Principal Component Analysis, Springer Verlag, 1986, ISBN 0-387-96269-7, incorporated by reference herein for all purposes.
- the dynamic change of the expression of a large number of genes during a physiological or pharmacological change is determined.
- the expression of genes may be monitored during treatment by drug candidates.
- the transcript levels of genes may be determined in a number of biological samples, each of which represents one treatment.
- the measurement of transcripts in one biological sample is referred to as one experiment.
- methods, systems and computer software are provided to analyze gene expression monitoring experiments to better understand the dynamic changes of gene expression among experiments.
- a square matrix T formed by the multiplication of S and its transpose matrix is computed:
- T has the dimension of m ⁇ m.
- the eigenectors, e, and their corresponding eigenvalues, ⁇ , of the matrix T are computed, resulting in a matrix of eigenvectors:
- the eigenvector associated with the largest egienvalue gives the best estimate of the relative ratio of the expression levels for the m experiments of this particular gene.
- i runs from 1 to 17 andj runs from 1 to 20.
- S ij forms a 17 by 20 matrix.
- the principal components can then be obtained by the following: first, a square matrix T formed by the multiplication of S and its transpose matrix is computed. T is of the dimension i by i, in this case 17 by 17. Next, the eigenvalues and eigenvectors of matrix T are computed. The eigenvector associated with the largest eigenvalue gives the best estimate of the relative ratio of the expression levels for the 17 experiments for this gene.
- the eigenvector, e max associated with the largest eigenvalue may be compared with the intensity data (matrix S).
- the angle between e max and each of the vectors Sj (for each probe pair) should be similar. If the intensity data vector for a particular probe deviates from other probes and if the probe has been previously shown to effectively detect the expression of the gene, the deviated probe may indicate that sequence variations from the target transcript. Sequence variations may be the result of polymorphism, splice variants and etc. Therefore, by comparing the angle betweem e max and Sj, potential polymorphism and splice variants may be detected.
- expression character may be categorized as p/m/n/sat (present/marginal/not detected/saturated) according to the level of transcripts.
- the intensity difference between PM ⁇ MM is used as the element of each measurement, however, in some other embodiments, all the PM and MM probes are treated as independent measurements, the corresponding canonical vectors derived above also provide finger prints for the existence of the targeted transcript sequences.
- An exemplary software product contains computer program code that inputs hybridization intensity data, and each intensity reflects the hybridization of jth probe (or probe pair) in the ith experiment for gene k (step 301).
- the program also contains code for forming a matrix T for gene k in the memory of a computer (step 302).
- Program code in the computer software product then calculates eigenvectors and eigenvalues of matrix T (step 303).
- the relative expression of gene K is indicated using the eigenvector associated with the largest eigenvalue (304) by program codes in the computer software. The process may be repeated until the relative expressions of all genes are analyzed (305).
- selection of probes of good performance may be critical to obtaining good quality data.
- methods are provided to select the best probes from a pool of candidate probes based upon the performance of the probes.
- a pool of at least 4, preferably more than 10 and more preferably more than 20 candidate probes are designed to measure the expression of a target gene.
- the expression of the target gene in a variety of biological samples reflecting the various states of the expression of the target gene is measured using the pool of candidate probes. Such samples may be obtained from various tissues of an organism and/or from organisms subjected to various environmental conditions.
- the intensity data obtained from the experiments may be analyzed according to the methods described in the previous section to obtain the eigenvector, e max .
- the inner product of normalized (or unitized) eigenvector and normalized experimental values for each probe gives an objective measure of the performance of the probe (the larger, the better). Probes can then be selected based upon their performance.
- the expression of a gene in a particular sample is determined based upon the hybridization intensity of the probes.
- S j is hybridization intensity for the jth probe and c j is the value for the jth probe.
- the GEI may then be used as a relative level of expression, for calculating absolute amounts of the transcript (with appropriate controls) and for making a qualitative or semi-quantative calls (present, absent, etc.)
- the probes for a large number of genes are synthesized or deposited on a substrate to make a gene expression monitoring chip.
- the probes (preferably immobilized on a chip) are tested on various samples.
- the samples may represent various states of the expression of the target gene.
- the hybridization intensity values obtained constitutes a vector S of equation 1 for each target gene.
- the vector is of the size m ⁇ n. m is the number of samples tested and n is the number of probes for a target gene (the number of probes may be different for different target genes).
- a vector P may be calculated by multiplying the transposed S with S:
- P has the dimension of n ⁇ n.
- the eigenvector of P of matrix P associated with the largest eigenvalue may be used as a canonical vector.
- yeast gene YAR007C/RFA1 was chosen as an example.
- the YAR007C/RFA1 gene was measured using 20 probe pairs. Each probe pair has a probe (PM) that is designed to be complementary to a target region of the YAR007CRFA1 gene transcript. Another probe in the pair is the same as the PM probe except for one single base that is different from the PM probe.
- PM probe
- FIG. 4 lists the values of scaled PM ⁇ MM for all the 20 probe pairs in the 17 samples.
- the matrix S shown in FIG. 4, has the dimension of 17 ⁇ 20 elements for 20 probe pairs and 17 experiments.
- FIG. 6 shows the eigenvalues in descending order
- the probability that the relative ratio is given by the ith column vector in the eigenvectors show in FIG. 5 is (Li*Li)/(L1*L1+L2*L2+L3*L3+ . . . +L17*L17). In this case the probability is almost 1 for L1 as L1 is the uniquely largest one and far exceeds the rest of the eigenvalues.
- FIGS. 7 and 8 show the comparison of using eigenvector associated with the largest eigenvalue with other methods.
- all_avg indicates the results from straight average of the 20 probes
- eigenvec indicates the results from the method disclosed here
- sol_avgdif gives the results using the Super Olympic scheme (described later).
- the columns under percentage are the normalized values for comparison and retabulated in FIG. 8 for convenience.
- the yeast cell cycle data were also used to establish a vector whose elements form a “canonical” response of the hybridization experiment.
- the exemplar data is listed in FIG. 9 in the transposed form of the matrix in FIG. 4, (i. e. instead of matrix S (17 by 20) above, a matrix P (20 by 17) is shown in FIG. 9 .
- the eigenvector (FIG. 10) associated with the largest eigenvalue (FIG. 11) can be used as the canonical vector.
- FIG. 12 shows the comparison of three different methods for analyzing multiple probe experiments.
- Straight average uses the average of the intensity difference for each probe pair.
- the maximum and the minimum of the, say 20, measurements (pm-mm) were discarded.
- the mean and standard deviation of the intensity difference for remaining probe pairs were calculated.
- the results of principal component method are generally in agreement with either straight average or super Olympic values.
- the present inventions provide methods and computer software products for analyzing gene expression profiles. It is to be understood that the above description is intended to be illustrative and not restrictive. Many variations of the invention will be apparent to those of skill in the art upon reviewing the above description. By way of example, the invention has been described primarily with reference to the use of a high density oligonucleotide array, but it will be readily recognized by those of skill in the art that other nucleic acid arrays, other methods of measuring transcript levels and gene expression monitoring at the protein level could be used. The scope of the invention should, therefore, be determined not with reference to the above description, but should instead be determined with reference to the appended claims, along with the full scope of equivalents to which such claims are entitled.
Abstract
Description


Claims (32)


Priority Applications (4)
| Application Number | Priority Date | Filing Date | Title |
|---|---|---|---|
| US09/670,510 US6505125B1 (en) | 1999-09-28 | 2000-09-26 | Methods and computer software products for multiple probe gene expression analysis |
| AU77309/00A AU7730900A (en) | 1999-09-28 | 2000-09-28 | Methods and computer software products for multiple probe gene expression analysis |
| PCT/US2000/026732 WO2001023614A1 (en) | 1999-09-28 | 2000-09-28 | Methods and computer software products for multiple probe gene expression analysis |
| US10/315,923 US20030216868A1 (en) | 1999-09-28 | 2002-12-09 | Methods and computer software products for multiple probe gene expression analysis |
Applications Claiming Priority (3)
| Application Number | Priority Date | Filing Date | Title |
|---|---|---|---|
| US15635399P | 1999-09-28 | 1999-09-28 | |
| US20895600P | 2000-05-31 | 2000-05-31 | |
| US09/670,510 US6505125B1 (en) | 1999-09-28 | 2000-09-26 | Methods and computer software products for multiple probe gene expression analysis |
Related Child Applications (1)
| Application Number | Title | Priority Date | Filing Date |
|---|---|---|---|
| US10/315,923 Continuation US20030216868A1 (en) | 1999-09-28 | 2002-12-09 | Methods and computer software products for multiple probe gene expression analysis |
Publications (1)
| Publication Number | Publication Date |
|---|---|
| US6505125B1 true US6505125B1 (en) | 2003-01-07 |
Family
ID=27387852
Family Applications (2)
| Application Number | Title | Priority Date | Filing Date |
|---|---|---|---|
| US09/670,510 Expired - Lifetime US6505125B1 (en) | 1999-09-28 | 2000-09-26 | Methods and computer software products for multiple probe gene expression analysis |
| US10/315,923 Abandoned US20030216868A1 (en) | 1999-09-28 | 2002-12-09 | Methods and computer software products for multiple probe gene expression analysis |
Family Applications After (1)
| Application Number | Title | Priority Date | Filing Date |
|---|---|---|---|
| US10/315,923 Abandoned US20030216868A1 (en) | 1999-09-28 | 2002-12-09 | Methods and computer software products for multiple probe gene expression analysis |
Country Status (3)
| Country | Link |
|---|---|
| US (2) | US6505125B1 (en) |
| AU (1) | AU7730900A (en) |
| WO (1) | WO2001023614A1 (en) |
Cited By (43)
| Publication number | Priority date | Publication date | Assignee | Title |
|---|---|---|---|---|
| US20020183936A1 (en) * | 2001-01-24 | 2002-12-05 | Affymetrix, Inc. | Method, system, and computer software for providing a genomic web portal |
| WO2003072065A2 (en) * | 2002-02-28 | 2003-09-04 | Iconix Pharmaceuticals, Inc. | Drug signatures |
| US20030170734A1 (en) * | 2000-04-28 | 2003-09-11 | Stephen Williams | Multiplexed assays using electrophoretically separated molecular tags |
| US20030203408A1 (en) * | 2002-04-02 | 2003-10-30 | Stephen Williams | Computer-implemented method for identifying peaks in electropherogram data |
| US20040101894A1 (en) * | 2002-10-01 | 2004-05-27 | Thomas Albert | Microarrays having multiple oligonucleotides in single array features |
| US20040101949A1 (en) * | 2002-09-30 | 2004-05-27 | Green Roland D. | Parallel loading of arrays |
| US20040161797A1 (en) * | 1999-06-14 | 2004-08-19 | Kauvar Lawrence M. | Protein localization assays for toxicity and antidotes thereto |
| US20040224380A1 (en) * | 2002-04-01 | 2004-11-11 | Fluidigm Corp. | Microfluidic particle-analysis systems |
| US20050064462A1 (en) * | 2003-06-17 | 2005-03-24 | Bernd Stein | Methods, compositions, and kits for predicting the effect of compounds on hot flash symptoms |
| US20050069863A1 (en) * | 2003-09-29 | 2005-03-31 | Jorge Moraleda | Systems and methods for analyzing gene expression data for clinical diagnostics |
| US20050071143A1 (en) * | 2003-09-29 | 2005-03-31 | Quang Tran | Knowledge-based storage of diagnostic models |
| US20050115837A1 (en) * | 2003-12-01 | 2005-06-02 | Dean Burgi | Analyte identification in transformed electropherograms |
| US20050196785A1 (en) * | 2001-03-05 | 2005-09-08 | California Institute Of Technology | Combinational array for nucleic acid analysis |
| US20050221373A1 (en) * | 2001-04-06 | 2005-10-06 | California Institute Of Technology | Nucleic acid amplification using microfluidic devices |
| US20060035250A1 (en) * | 2004-06-10 | 2006-02-16 | Georges Natsoulis | Necessary and sufficient reagent sets for chemogenomic analysis |
| US20060057066A1 (en) * | 2004-07-19 | 2006-03-16 | Georges Natsoulis | Reagent sets and gene signatures for renal tubule injury |
| US20060086309A1 (en) * | 2002-06-24 | 2006-04-27 | Fluiding Corporation | Recirculating fluidic network and methods for using the same |
| EP1655598A2 (en) | 2004-10-29 | 2006-05-10 | Affymetrix, Inc. | System, method, and product for multiple wavelength detection using single source excitation |
| US20070021918A1 (en) * | 2004-04-26 | 2007-01-25 | Georges Natsoulis | Universal gene chip for high throughput chemogenomic analysis |
| US20070141599A1 (en) * | 1997-09-23 | 2007-06-21 | California Institute Of Technology | Methods and systems for molecular fingerprinting |
| US20070198653A1 (en) * | 2005-12-30 | 2007-08-23 | Kurt Jarnagin | Systems and methods for remote computer-based analysis of user-provided chemogenomic data |
| US20090087841A1 (en) * | 2005-05-27 | 2009-04-02 | Monogram Biosciences, Inc. | Methods and compositions for determining resistance of hiv-1 to protease inhibitors |
| US20090136915A1 (en) * | 2005-06-06 | 2009-05-28 | Monogram Biosciences, Inc. | Methods and compositions for determining altered susceptibility of HIV-1 to anti-HIV drugs |
| US20090181390A1 (en) * | 2008-01-11 | 2009-07-16 | Signosis, Inc. A California Corporation | High throughput detection of micrornas and use for disease diagnosis |
| US20090215028A1 (en) * | 2005-02-18 | 2009-08-27 | Ellen Paxinos | Methods and Compositions for Determining Anti-HIV Drug Susceptibility and Replication Capacity of HIV |
| US20090220939A1 (en) * | 2005-06-06 | 2009-09-03 | Monogram Biosciences, Inc. | Methods for determing resistance or susceptibility to hi entry inhibitors |
| US20100021885A1 (en) * | 2006-09-18 | 2010-01-28 | Mark Fielden | Reagent sets and gene signatures for non-genotoxic hepatocarcinogenicity |
| US20100081965A1 (en) * | 2008-10-01 | 2010-04-01 | John Mugan | Needle biopsy device |
| US20100120077A1 (en) * | 2002-04-01 | 2010-05-13 | Fluidigm Corporation | Microfluidic particle-analysis systems |
| US20100121218A1 (en) * | 2008-10-01 | 2010-05-13 | Boston Endoscopic Engineering Corporation | Device for needle biopsy with integrated needle protection |
| US20100154890A1 (en) * | 2002-09-25 | 2010-06-24 | California Institute Of Technology | Microfluidic Large Scale Integration |
| WO2011057061A1 (en) | 2009-11-06 | 2011-05-12 | The Board Of Trustees Of The Leland Stanford Junior University | Non-invasive diagnosis of graft rejection in organ transplant patients |
| EP2366801A1 (en) | 2006-06-14 | 2011-09-21 | Verinata Health, Inc | Methods for the diagnosis of fetal abnormalities |
| US8178291B2 (en) | 2005-02-18 | 2012-05-15 | Monogram Biosciences, Inc. | Methods and compositions for determining hypersusceptibility of HIV-1 to non-nucleoside reverse transcriptase inhibitors |
| WO2013043922A1 (en) | 2011-09-22 | 2013-03-28 | ImmuMetrix, LLC | Compositions and methods for analyzing heterogeneous samples |
| US8871446B2 (en) | 2002-10-02 | 2014-10-28 | California Institute Of Technology | Microfluidic nucleic acid analysis |
| US20150048860A1 (en) * | 2013-08-15 | 2015-02-19 | International Business Machines Corporation | Determining intra-die variation of an integrated circuit |
| US8977506B2 (en) | 2003-09-29 | 2015-03-10 | Response Genetics, Inc. | Systems and methods for detecting biological features |
| US9332973B2 (en) | 2008-10-01 | 2016-05-10 | Covidien Lp | Needle biopsy device with exchangeable needle and integrated needle protection |
| US9581595B2 (en) | 2007-02-26 | 2017-02-28 | Laboratory Corporation Of America Holdings | Compositions and methods for determining whether a subject would benefit from co-receptor inhibitor therapy |
| US9782565B2 (en) | 2008-10-01 | 2017-10-10 | Covidien Lp | Endoscopic ultrasound-guided biliary access system |
| US10722858B2 (en) | 2013-03-15 | 2020-07-28 | Lineage Biosciences, Inc. | Methods and compositions for tagging and analyzing samples |
| US11298113B2 (en) | 2008-10-01 | 2022-04-12 | Covidien Lp | Device for needle biopsy with integrated needle protection |
Families Citing this family (5)
| Publication number | Priority date | Publication date | Assignee | Title |
|---|---|---|---|---|
| US6960439B2 (en) | 1999-06-28 | 2005-11-01 | Source Precision Medicine, Inc. | Identification, monitoring and treatment of disease and characterization of biological condition using gene expression profiles |
| WO2003040404A1 (en) | 2001-11-09 | 2003-05-15 | Source Precision Medicine, Inc. | Identification, monitoring and treatment of disease and characterization of biological condition using gene expression profiles |
| WO2012107786A1 (en) * | 2011-02-09 | 2012-08-16 | Rudjer Boskovic Institute | System and method for blind extraction of features from measurement data |
| WO2018089438A1 (en) * | 2016-11-08 | 2018-05-17 | President And Fellows Of Harvard College | Multiplexed imaging using merfish, expansion microscopy, and related technologies |
| US11788123B2 (en) | 2017-05-26 | 2023-10-17 | President And Fellows Of Harvard College | Systems and methods for high-throughput image-based screening |
Citations (6)
| Publication number | Priority date | Publication date | Assignee | Title |
|---|---|---|---|---|
| WO1997010365A1 (en) | 1995-09-15 | 1997-03-20 | Affymax Technologies N.V. | Expression monitoring by hybridization to high density oligonucleotide arrays |
| WO1997027317A1 (en) | 1996-01-23 | 1997-07-31 | Affymetrix, Inc. | Nucleic acid analysis techniques |
| EP0848067A2 (en) | 1996-12-12 | 1998-06-17 | Affymetrix, Inc. (a California Corporation) | Computer-aided techniques for analyzing biological sequences |
| US5840484A (en) | 1992-07-17 | 1998-11-24 | Incyte Pharmaceuticals, Inc. | Comparative gene transcript analysis |
| US5871697A (en) | 1995-10-24 | 1999-02-16 | Curagen Corporation | Method and apparatus for identifying, classifying, or quantifying DNA sequences in a sample without sequencing |
| US6300063B1 (en) * | 1995-11-29 | 2001-10-09 | Affymetrix, Inc. | Polymorphism detection |
Family Cites Families (1)
| Publication number | Priority date | Publication date | Assignee | Title |
|---|---|---|---|---|
| US6329140B1 (en) * | 1996-09-19 | 2001-12-11 | Affymetrix, Inc. | Identification of molecular sequence signatures and methods involving the same |
-
2000
- 2000-09-26 US US09/670,510 patent/US6505125B1/en not_active Expired - Lifetime
- 2000-09-28 WO PCT/US2000/026732 patent/WO2001023614A1/en active Application Filing
- 2000-09-28 AU AU77309/00A patent/AU7730900A/en not_active Abandoned
-
2002
- 2002-12-09 US US10/315,923 patent/US20030216868A1/en not_active Abandoned
Patent Citations (6)
| Publication number | Priority date | Publication date | Assignee | Title |
|---|---|---|---|---|
| US5840484A (en) | 1992-07-17 | 1998-11-24 | Incyte Pharmaceuticals, Inc. | Comparative gene transcript analysis |
| WO1997010365A1 (en) | 1995-09-15 | 1997-03-20 | Affymax Technologies N.V. | Expression monitoring by hybridization to high density oligonucleotide arrays |
| US5871697A (en) | 1995-10-24 | 1999-02-16 | Curagen Corporation | Method and apparatus for identifying, classifying, or quantifying DNA sequences in a sample without sequencing |
| US6300063B1 (en) * | 1995-11-29 | 2001-10-09 | Affymetrix, Inc. | Polymorphism detection |
| WO1997027317A1 (en) | 1996-01-23 | 1997-07-31 | Affymetrix, Inc. | Nucleic acid analysis techniques |
| EP0848067A2 (en) | 1996-12-12 | 1998-06-17 | Affymetrix, Inc. (a California Corporation) | Computer-aided techniques for analyzing biological sequences |
Non-Patent Citations (5)
| Title |
|---|
| "trends guide to bioinformatics", Trends Supplement, Elsevier Science 1998, pps. 1-38. |
| Gaasterland et al., "Making the most of microarray data", Nature Genetics, vol. 24, Mar. 2000, pps. 204-206. |
| Hilsenbeck et al, Statistical Analysis of Array Expression Data as Applied to the Problem of Tamoxifen Resistance, Jan. 1999, Journal of the National Cancer Institute, vol. 91, No. 5, pp. 453-459.* * |
| Larry Hatcher, A Step-by-Step Approach to Using the SAS System for Factor Analysis and Structural Equation Modeling, SAS Publishing, 1994, Chapter One, pp. 1-56.* * |
| Lockhart et al, Expression monitoring by hybridization to high-density oligonucleotide arrays, Dec. 1996, Nature Biotechnology, vol. 14, pp. 1675-1680.* * |
Cited By (93)
| Publication number | Priority date | Publication date | Assignee | Title |
|---|---|---|---|---|
| US20100196892A1 (en) * | 1997-09-23 | 2010-08-05 | California Institute Of Technology | Methods and Systems for Molecular Fingerprinting |
| US20070141599A1 (en) * | 1997-09-23 | 2007-06-21 | California Institute Of Technology | Methods and systems for molecular fingerprinting |
| US7504230B2 (en) * | 1999-06-14 | 2009-03-17 | Trelolis Bioscience, Inc. | Method of identifying a useful set of signal transduction proteins from a multiplicity of potentially useful proteins |
| US20040161797A1 (en) * | 1999-06-14 | 2004-08-19 | Kauvar Lawrence M. | Protein localization assays for toxicity and antidotes thereto |
| US20030170734A1 (en) * | 2000-04-28 | 2003-09-11 | Stephen Williams | Multiplexed assays using electrophoretically separated molecular tags |
| US9926521B2 (en) | 2000-06-27 | 2018-03-27 | Fluidigm Corporation | Microfluidic particle-analysis systems |
| US20020183936A1 (en) * | 2001-01-24 | 2002-12-05 | Affymetrix, Inc. | Method, system, and computer software for providing a genomic web portal |
| US20050196785A1 (en) * | 2001-03-05 | 2005-09-08 | California Institute Of Technology | Combinational array for nucleic acid analysis |
| US8486636B2 (en) | 2001-04-06 | 2013-07-16 | California Institute Of Technology | Nucleic acid amplification using microfluidic devices |
| US7833708B2 (en) | 2001-04-06 | 2010-11-16 | California Institute Of Technology | Nucleic acid amplification using microfluidic devices |
| US8936764B2 (en) | 2001-04-06 | 2015-01-20 | California Institute Of Technology | Nucleic acid amplification using microfluidic devices |
| US20050221373A1 (en) * | 2001-04-06 | 2005-10-06 | California Institute Of Technology | Nucleic acid amplification using microfluidic devices |
| WO2003072065A3 (en) * | 2002-02-28 | 2004-10-14 | Iconix Pharm Inc | Drug signatures |
| US20030180808A1 (en) * | 2002-02-28 | 2003-09-25 | Georges Natsoulis | Drug signatures |
| WO2003072065A2 (en) * | 2002-02-28 | 2003-09-04 | Iconix Pharmaceuticals, Inc. | Drug signatures |
| US8658418B2 (en) | 2002-04-01 | 2014-02-25 | Fluidigm Corporation | Microfluidic particle-analysis systems |
| US20100120077A1 (en) * | 2002-04-01 | 2010-05-13 | Fluidigm Corporation | Microfluidic particle-analysis systems |
| US20040224380A1 (en) * | 2002-04-01 | 2004-11-11 | Fluidigm Corp. | Microfluidic particle-analysis systems |
| US20030203408A1 (en) * | 2002-04-02 | 2003-10-30 | Stephen Williams | Computer-implemented method for identifying peaks in electropherogram data |
| US20060086309A1 (en) * | 2002-06-24 | 2006-04-27 | Fluiding Corporation | Recirculating fluidic network and methods for using the same |
| US20100154890A1 (en) * | 2002-09-25 | 2010-06-24 | California Institute Of Technology | Microfluidic Large Scale Integration |
| US9714443B2 (en) | 2002-09-25 | 2017-07-25 | California Institute Of Technology | Microfabricated structure having parallel and orthogonal flow channels controlled by row and column multiplexors |
| US8129196B2 (en) | 2002-09-30 | 2012-03-06 | Roche Nimblegen, Inc. | Parallel loading of arrays |
| US20040101949A1 (en) * | 2002-09-30 | 2004-05-27 | Green Roland D. | Parallel loading of arrays |
| US7482170B2 (en) | 2002-09-30 | 2009-01-27 | Roche Nimblegen, Inc. | Parallel loading of arrays |
| US20040101894A1 (en) * | 2002-10-01 | 2004-05-27 | Thomas Albert | Microarrays having multiple oligonucleotides in single array features |
| US9579650B2 (en) | 2002-10-02 | 2017-02-28 | California Institute Of Technology | Microfluidic nucleic acid analysis |
| US10940473B2 (en) | 2002-10-02 | 2021-03-09 | California Institute Of Technology | Microfluidic nucleic acid analysis |
| US10328428B2 (en) | 2002-10-02 | 2019-06-25 | California Institute Of Technology | Apparatus for preparing cDNA libraries from single cells |
| US8871446B2 (en) | 2002-10-02 | 2014-10-28 | California Institute Of Technology | Microfluidic nucleic acid analysis |
| US20050064462A1 (en) * | 2003-06-17 | 2005-03-24 | Bernd Stein | Methods, compositions, and kits for predicting the effect of compounds on hot flash symptoms |
| US8321137B2 (en) | 2003-09-29 | 2012-11-27 | Pathwork Diagnostics, Inc. | Knowledge-based storage of diagnostic models |
| US20050069863A1 (en) * | 2003-09-29 | 2005-03-31 | Jorge Moraleda | Systems and methods for analyzing gene expression data for clinical diagnostics |
| US8977506B2 (en) | 2003-09-29 | 2015-03-10 | Response Genetics, Inc. | Systems and methods for detecting biological features |
| US20050071143A1 (en) * | 2003-09-29 | 2005-03-31 | Quang Tran | Knowledge-based storage of diagnostic models |
| US20070158193A1 (en) * | 2003-12-01 | 2007-07-12 | Dean Burgi | Analyte Identification in Transformed Electropherograms |
| US20050115837A1 (en) * | 2003-12-01 | 2005-06-02 | Dean Burgi | Analyte identification in transformed electropherograms |
| US20070021918A1 (en) * | 2004-04-26 | 2007-01-25 | Georges Natsoulis | Universal gene chip for high throughput chemogenomic analysis |
| US20060035250A1 (en) * | 2004-06-10 | 2006-02-16 | Georges Natsoulis | Necessary and sufficient reagent sets for chemogenomic analysis |
| US7588892B2 (en) | 2004-07-19 | 2009-09-15 | Entelos, Inc. | Reagent sets and gene signatures for renal tubule injury |
| US20060057066A1 (en) * | 2004-07-19 | 2006-03-16 | Georges Natsoulis | Reagent sets and gene signatures for renal tubule injury |
| US20060199205A1 (en) * | 2004-07-19 | 2006-09-07 | Georges Natsoulis | Reagent sets and gene signatures for renal tubule injury |
| EP1655598A2 (en) | 2004-10-29 | 2006-05-10 | Affymetrix, Inc. | System, method, and product for multiple wavelength detection using single source excitation |
| EP2522757A1 (en) | 2005-02-18 | 2012-11-14 | Monogram BioSciences, Inc. | Methods and compositions for determining anti-HIV drug susceptibility and replication capacity of HIV |
| US8178291B2 (en) | 2005-02-18 | 2012-05-15 | Monogram Biosciences, Inc. | Methods and compositions for determining hypersusceptibility of HIV-1 to non-nucleoside reverse transcriptase inhibitors |
| US20090215028A1 (en) * | 2005-02-18 | 2009-08-27 | Ellen Paxinos | Methods and Compositions for Determining Anti-HIV Drug Susceptibility and Replication Capacity of HIV |
| US10202658B2 (en) | 2005-02-18 | 2019-02-12 | Monogram Biosciences, Inc. | Methods for determining hypersusceptibility of HIV-1 to non-nucleoside reverse transcriptase inhibitors |
| EP2458018A2 (en) | 2005-05-27 | 2012-05-30 | Monogram BioSciences, Inc. | Methods and compositions for determining resistance of HIV-1 to protease inhibitors |
| US20090087841A1 (en) * | 2005-05-27 | 2009-04-02 | Monogram Biosciences, Inc. | Methods and compositions for determining resistance of hiv-1 to protease inhibitors |
| EP2458019A2 (en) | 2005-05-27 | 2012-05-30 | Monogram BioSciences, Inc. | Methods and compositions for determining resistance of HIV-1 to protease inhibitors |
| US8637252B2 (en) | 2005-06-06 | 2014-01-28 | Monogram Biosciences, Inc. | Methods and compositions for determining altered susceptibility of HIV-1 to anti-HIV drugs |
| US20090220939A1 (en) * | 2005-06-06 | 2009-09-03 | Monogram Biosciences, Inc. | Methods for determing resistance or susceptibility to hi entry inhibitors |
| US11499200B2 (en) | 2005-06-06 | 2022-11-15 | Monogram Biosciences, Inc. | Methods for determining resistance or susceptibility to HIV entry inhibitors |
| US10385411B2 (en) | 2005-06-06 | 2019-08-20 | Monogram Biosciences, Inc. | Methods for determining resistance or susceptibility to HIV entry inhibitors |
| US8071284B2 (en) | 2005-06-06 | 2011-12-06 | Monogram Biosciences, Inc. | Methods and compositions for determining altered susceptibility of HIV-1 to anti-HIV drugs |
| US20090136915A1 (en) * | 2005-06-06 | 2009-05-28 | Monogram Biosciences, Inc. | Methods and compositions for determining altered susceptibility of HIV-1 to anti-HIV drugs |
| US9506121B2 (en) | 2005-06-06 | 2016-11-29 | Monogram Biosciences, Inc. | Methods for determining resistance or susceptibility to HIV entry inhibitors |
| US20070198653A1 (en) * | 2005-12-30 | 2007-08-23 | Kurt Jarnagin | Systems and methods for remote computer-based analysis of user-provided chemogenomic data |
| EP2366801A1 (en) | 2006-06-14 | 2011-09-21 | Verinata Health, Inc | Methods for the diagnosis of fetal abnormalities |
| EP4170042A1 (en) | 2006-06-14 | 2023-04-26 | Verinata Health, Inc. | Methods for the diagnosis of fetal abnormalities |
| US20100021885A1 (en) * | 2006-09-18 | 2010-01-28 | Mark Fielden | Reagent sets and gene signatures for non-genotoxic hepatocarcinogenicity |
| US10358683B2 (en) | 2007-02-26 | 2019-07-23 | Laboratory Corporation Of America Holdings | Compositions and methods for determining whether a subject would benefit from co-receptor inhibitor therapy |
| US9581595B2 (en) | 2007-02-26 | 2017-02-28 | Laboratory Corporation Of America Holdings | Compositions and methods for determining whether a subject would benefit from co-receptor inhibitor therapy |
| US20090181390A1 (en) * | 2008-01-11 | 2009-07-16 | Signosis, Inc. A California Corporation | High throughput detection of micrornas and use for disease diagnosis |
| US10076316B2 (en) | 2008-10-01 | 2018-09-18 | Covidien Lp | Needle biopsy device |
| US10888689B2 (en) | 2008-10-01 | 2021-01-12 | Covidien Lp | Endoscopic ultrasound-guided biliary access system |
| US9782565B2 (en) | 2008-10-01 | 2017-10-10 | Covidien Lp | Endoscopic ultrasound-guided biliary access system |
| US11298113B2 (en) | 2008-10-01 | 2022-04-12 | Covidien Lp | Device for needle biopsy with integrated needle protection |
| US9913630B2 (en) | 2008-10-01 | 2018-03-13 | Covidien Lp | Device for needle biopsy with integrated needle protection |
| US11039816B2 (en) | 2008-10-01 | 2021-06-22 | Covidien Lp | Needle biopsy device with exchangeable needle and integrated needle protection |
| US9186128B2 (en) | 2008-10-01 | 2015-11-17 | Covidien Lp | Needle biopsy device |
| US20100081965A1 (en) * | 2008-10-01 | 2010-04-01 | John Mugan | Needle biopsy device |
| US8968210B2 (en) | 2008-10-01 | 2015-03-03 | Covidien LLP | Device for needle biopsy with integrated needle protection |
| US9332973B2 (en) | 2008-10-01 | 2016-05-10 | Covidien Lp | Needle biopsy device with exchangeable needle and integrated needle protection |
| US20100121218A1 (en) * | 2008-10-01 | 2010-05-13 | Boston Endoscopic Engineering Corporation | Device for needle biopsy with integrated needle protection |
| US10988804B2 (en) | 2009-11-06 | 2021-04-27 | The Board Of Trustees Of The Leland Stanford Junior University | Nucleic acid sequencing apparatus for monitoring status of a transplant recipient |
| US11384389B2 (en) | 2009-11-06 | 2022-07-12 | The Board Of Trustees Of The Leland Stanford Junior University | Non-invasive diagnosis of graft rejection in organ transplant patients |
| US11597966B2 (en) | 2009-11-06 | 2023-03-07 | The Board Of Trustees Of The Leland Stanford Junior University | Non-invasive diagnosis of graft rejection in organ transplant patients |
| US11098350B2 (en) | 2009-11-06 | 2021-08-24 | The Board Of Trustees Of The Leland Stanford Junior University | Non-invasive diagnosis of graft rejection in organ transplant patients |
| US10329607B2 (en) | 2009-11-06 | 2019-06-25 | The Board Of Trustees Of The Leland Stanford Junior University | Non-invasive diagnosis of graft rejection in organ transplant patients |
| WO2011057061A1 (en) | 2009-11-06 | 2011-05-12 | The Board Of Trustees Of The Leland Stanford Junior University | Non-invasive diagnosis of graft rejection in organ transplant patients |
| US10968479B2 (en) | 2009-11-06 | 2021-04-06 | The Board Of Trustees Of The Leland Stanford Junior University | Non-invasive diagnosis of graft rejection in organ transplant patients |
| US10982275B2 (en) | 2009-11-06 | 2021-04-20 | The Board Of Trustees Of The Leland Stanford Junior University | Non-invasive diagnosis of graft rejection in organ transplant patients |
| US8703652B2 (en) | 2009-11-06 | 2014-04-22 | The Board Of Trustees Of The Leland Stanford Junior University | Non-invasive diagnosis of graft rejection in organ transplant patients |
| US11390918B2 (en) | 2009-11-06 | 2022-07-19 | The Board Of Trustees Of The Leland Stanford Junior University | Non-invasive diagnosis of graft rejection in organ transplant patients |
| EP3719140A1 (en) | 2009-11-06 | 2020-10-07 | The Board Of Trustees Of The Leland Stanford Junior University | Non-invasive diagnosis of graft rejection in organ transplant patients |
| US10494669B2 (en) | 2009-11-06 | 2019-12-03 | The Board Of Trustees Of The Leland Stanford Junior University | Non-invasive diagnosis of graft rejection in organ transplant patients |
| US9845497B2 (en) | 2009-11-06 | 2017-12-19 | The Board Of Trustees Of The Leland Stanford Junior University | Non-invasive diagnosis of graft rejection in organ transplant patients |
| WO2013043922A1 (en) | 2011-09-22 | 2013-03-28 | ImmuMetrix, LLC | Compositions and methods for analyzing heterogeneous samples |
| US11161087B2 (en) | 2013-03-15 | 2021-11-02 | Lineage Biosciences, Inc. | Methods and compositions for tagging and analyzing samples |
| US10722858B2 (en) | 2013-03-15 | 2020-07-28 | Lineage Biosciences, Inc. | Methods and compositions for tagging and analyzing samples |
| US9255962B2 (en) * | 2013-08-15 | 2016-02-09 | GlobalFoundries, Inc. | Determining intra-die variation of an integrated circuit |
| US20150048860A1 (en) * | 2013-08-15 | 2015-02-19 | International Business Machines Corporation | Determining intra-die variation of an integrated circuit |
Also Published As
| Publication number | Publication date |
|---|---|
| US20030216868A1 (en) | 2003-11-20 |
| WO2001023614A1 (en) | 2001-04-05 |
| AU7730900A (en) | 2001-04-30 |
Similar Documents
| Publication | Publication Date | Title |
|---|---|---|
| US6505125B1 (en) | Methods and computer software products for multiple probe gene expression analysis | |
| US6040138A (en) | Expression monitoring by hybridization to high density oligonucleotide arrays | |
| US20070248975A1 (en) | Methods for monitoring the expression of alternatively spliced genes | |
| US7552013B2 (en) | Ratio-based oligonucleotide probe selection | |
| US20010053519A1 (en) | Oligonucleotides | |
| Lennon | High-throughput gene expression analysis for drug discovery | |
| US20060281126A1 (en) | Methods for monitoring the expression of alternatively spliced genes | |
| JP2003245072A (en) | Determination of signal transmission path | |
| US20020081589A1 (en) | Gene expression monitoring using universal arrays | |
| WO2001020043A1 (en) | Method of cluster analysis of gene expression profiles | |
| US20110250602A1 (en) | Methods and Computer Software Products for Identifying Transcribed Regions of a Genome | |
| US6716579B1 (en) | Gene specific arrays, preparation and use | |
| AU751557B2 (en) | Expression monitoring by hybridization to high density oligonucleotide arrays | |
| WO2001090746A1 (en) | Methods and computer software products for transcriptional annotation |
Legal Events
| Date | Code | Title | Description |
|---|---|---|---|
| AS | Assignment |
Owner name: AFFYMETRIX, INC., CALIFORNIA Free format text: ASSIGNMENT OF ASSIGNORS INTEREST;ASSIGNOR:HO, MING-HSIN;REEL/FRAME:011134/0234 Effective date: 20000926 |
|
| STCF | Information on status: patent grant |
Free format text: PATENTED CASE |
|
| FPAY | Fee payment |
Year of fee payment: 4 |
|
| FPAY | Fee payment |
Year of fee payment: 8 |
|
| AS | Assignment |
Owner name: GENERAL ELECTRIC CAPITAL CORPORATION, AS AGENT, MA Free format text: SECURITY AGREEMENT;ASSIGNOR:AFFYMETRIX, INC.;REEL/FRAME:028465/0541 Effective date: 20120625 |
|
| FPAY | Fee payment |
Year of fee payment: 12 |
|
| AS | Assignment |
Owner name: BANK OF AMERICA, N.A., AS ADMINISTRATIVE AGENT, TE Free format text: SECURITY INTEREST;ASSIGNOR:AFFYMETRIX, INC.;REEL/FRAME:036988/0166 Effective date: 20151028 |
|
| AS | Assignment |
Owner name: AFFYMETRIX, INC., CALIFORNIA Free format text: RELEASE BY SECURED PARTY;ASSIGNOR:GENERAL ELECTRIC CAPITAL CORPORATION, AS AGENT;REEL/FRAME:037109/0132 Effective date: 20151028 |
|
| AS | Assignment |
Owner name: AFFYMETRIX, INC., CALIFORNIA Free format text: NOTICE OF RELEASE;ASSIGNOR:BANK OF AMERICA, N.A.;REEL/FRAME:038361/0891 Effective date: 20160328 |