US6510419B1 - Security analyst performance tracking and analysis system and method - Google Patents
Security analyst performance tracking and analysis system and method Download PDFInfo
- Publication number
- US6510419B1 US6510419B1 US09/296,620 US29662099A US6510419B1 US 6510419 B1 US6510419 B1 US 6510419B1 US 29662099 A US29662099 A US 29662099A US 6510419 B1 US6510419 B1 US 6510419B1
- Authority
- US
- United States
- Prior art keywords
- analysts
- analyst
- estimates
- historical
- estimate
- Prior art date
- Legal status (The legal status is an assumption and is not a legal conclusion. Google has not performed a legal analysis and makes no representation as to the accuracy of the status listed.)
- Expired - Lifetime
Links
Images


Classifications
-
- G—PHYSICS
- G06—COMPUTING; CALCULATING OR COUNTING
- G06Q—INFORMATION AND COMMUNICATION TECHNOLOGY [ICT] SPECIALLY ADAPTED FOR ADMINISTRATIVE, COMMERCIAL, FINANCIAL, MANAGERIAL OR SUPERVISORY PURPOSES; SYSTEMS OR METHODS SPECIALLY ADAPTED FOR ADMINISTRATIVE, COMMERCIAL, FINANCIAL, MANAGERIAL OR SUPERVISORY PURPOSES, NOT OTHERWISE PROVIDED FOR
- G06Q40/00—Finance; Insurance; Tax strategies; Processing of corporate or income taxes
- G06Q40/02—Banking, e.g. interest calculation or account maintenance
-
- G—PHYSICS
- G06—COMPUTING; CALCULATING OR COUNTING
- G06Q—INFORMATION AND COMMUNICATION TECHNOLOGY [ICT] SPECIALLY ADAPTED FOR ADMINISTRATIVE, COMMERCIAL, FINANCIAL, MANAGERIAL OR SUPERVISORY PURPOSES; SYSTEMS OR METHODS SPECIALLY ADAPTED FOR ADMINISTRATIVE, COMMERCIAL, FINANCIAL, MANAGERIAL OR SUPERVISORY PURPOSES, NOT OTHERWISE PROVIDED FOR
- G06Q40/00—Finance; Insurance; Tax strategies; Processing of corporate or income taxes
- G06Q40/04—Trading; Exchange, e.g. stocks, commodities, derivatives or currency exchange
-
- G—PHYSICS
- G06—COMPUTING; CALCULATING OR COUNTING
- G06Q—INFORMATION AND COMMUNICATION TECHNOLOGY [ICT] SPECIALLY ADAPTED FOR ADMINISTRATIVE, COMMERCIAL, FINANCIAL, MANAGERIAL OR SUPERVISORY PURPOSES; SYSTEMS OR METHODS SPECIALLY ADAPTED FOR ADMINISTRATIVE, COMMERCIAL, FINANCIAL, MANAGERIAL OR SUPERVISORY PURPOSES, NOT OTHERWISE PROVIDED FOR
- G06Q40/00—Finance; Insurance; Tax strategies; Processing of corporate or income taxes
- G06Q40/06—Asset management; Financial planning or analysis
Definitions
- the invention relates to a system and methods for managing and viewing historical security analyst data; for measuring, analyzing, and tracking the historical performance of security analysts' estimates and buy/sell recommendations; and using such performance and other information to automatically produce better predictors of future corporate earnings or stock-price performance.
- Such individuals may include, for example, security analysts and may be known as contributors or analysts, among others.
- the role of the security analyst is generally well-known and includes, among other things, the issuance of earnings or other financial estimates concerning future economic events and recommendations on whether investors should buy, sell, or hold financial instruments, such as equity securities.
- Security analyst estimates may include, but are not limited to, quarterly and annual earnings estimates for companies, whether or not they are traded on a public securities exchange.
- FISPs financial information services providers
- At least some FISPs report the high, low, and mean earnings estimates, as well as mean recommendations for equity securities (as translated to a FISP's particular scale, for example, one to five).
- FISPs may also provide information on what the earnings estimates and recommendations were seven and thirty days prior to the most current consensus, as well as the differences between the consensus for a single equity security and that of the relevant industry.
- FISPs provide earnings estimates and recommendations on an analysts-by-analyst basis.
- prior approaches include a software program that displays all current estimates. For a particular fiscal period for a particular security the software provides the ability to simply “include” or “exclude” each estimate (recommendation) from the mean. This is problematic for several reasons.
- commercially available databases of estimates and recommendations contain “current” data on thousands of stocks. Each stock may have estimates from 1 to 70 or more analysts. Each analyst may provide estimates for 1 to many periods. The data may be updated throughout the day. Manually dealing with this volume of information can be time consuming.
- a third drawback is that it while it is possible to imagine various weighting systems or algorithms, it is difficult to effectively implement or test them.
- Current systems do not provide the ability to effectively devise new estimate (recommendation) weighting algorithms; nor do they provide the ability to easily test their (hypothetical) historical performance.
- a fourth drawback with current techniques is that there are limited or no tools for effectively viewing historical estimates and recommendations as time-series graphs or for overlaying this information over a graph of prices for the securities to understand the relationship between changes in estimates (recommendations) to changes in securities prices.
- An object of the invention is to overcome these and other drawbacks of prior approaches and techniques.
- Another object of the invention is to measure and use the historical performance of an analyst's past estimates or recommendations to better predict future earnings or effectively use analysts' recommendations.
- Another object of the invention is to provide a tool to automatically create more accurate composite estimates (predictors) by adjusting one or more analyst's estimates up (down) if they have a historical tendency to under (over) estimate the value of future quantities such as earnings.
- Another object of the invention is to automatically create an improved composite estimate for one or more securities by calculating a weighting factor for each analyst's estimate that gives relatively more weight to certain analyst estimates and relatively less or no weight to other analyst estimates, where the weighting factor is based upon predetermined criteria.
- Another object of the invention is to objectively measure the historical accuracy of the estimates made by one or more Contributors (analysts and/or brokers)
- Another object of the invention is to provide a tool to measure historical accuracy of predictions with the flexibility for the user to specify one or more of the time frame of estimates to be measured (e.g., those estimates 9-12 months prior to actual report date), the number of periods over which to aggregate performance, the error metric used to calculate performance, and the stocks over which to aggregate performance.
- Another object of the invention is to exclude from calculation of an automatically generated composite all estimates (recommendations) that do or do not meet certain criteria.
- Another object of the invention is to provide a tool to automatically identify a cluster, or major revision of estimates (or recommendations), based upon predetermined criteria
- Another object of the invention is to automatically create a composite estimate (or recommendation) by excluding (or assigning reduced weight) to those estimates received prior to the beginning of a cluster.
- Another object of the invention is to automatically calculate an improved composite estimate or recommendation by both adjusting estimates of earnings by calculating an earnings estimate based upon the adjustment and weighting factors for a plurality of analysts' estimates.
- Another object of the invention is to measure the historical performance of a single or plurality of analysts' estimates and to measure the historical profitability of recommendations of either a single or plurality of analysts.
- Another object of the invention is to compare the performance of analysts' estimates and recommendations for a particular financial instrument or industry.
- Another object of the invention is to enable a user to define the method for measuring the performance of an analyst by allowing for the specification of a number of security analyst performance parameters or metrics.
- Another object of the invention is to allow for the creation, storage, and recall of security autoweight models and related estimates where the models automatically assign weights to each analyst's estimate or recommendation based on stored, user-defined criteria.
- Another object of the invention is to test autoweight models by applying predetermined criteria.
- Another object of the invention is to provide a data visualization technique to allow a user to display simultaneously the estimates of earnings (or other quantities such as revenues) for a single or plurality of contributors using predetermined criteria, along with the actual earnings (or other quantity) corresponding to those estimates and other related parameters or metrics.
- Another object of the invention is to provide a data visualization technique to allow a user to display simultaneously time-series charts of estimates of earnings (or of estimates of other quantities such as revenues, or of recommendations) for a single or plurality of contributors using predetermined criteria, along with a time-series of the security's price over the corresponding time interval.
- Another object of the invention is to provide a data visualization technique to allow one to display, as either raw numerical data, a chart, or graph, a number of earnings estimate performance metrics for either a single or plurality of analysts, based upon predetermined criteria.
- Another object of the invention is to provide a data visualization technique to display simultaneously the numerical representation of a single or plurality of security analysts' purchase recommendations for predetermined criteria, along with the actual change in the value of the security corresponding to the recommendation(s).
- an improved estimate of a future earnings event can be automatically developed for one or a plurality of securities by applying a weighting factor to each analyst's estimate.
- the weighting factor may be based on a variety of factors as specified in an autoweight model such as the relative recency of each analyst's estimate, the analyst's historical performance, or other factors. For example, if an estimate is relatively old, it may get a relatively low or zero weighting, whereas more recent estimates may be given a relatively high weighting. The sum of the weights assigned to analyst's estimates for a particular fiscal period should equal one. Two or more factors may be used in combination. Autoweight models allow for the definition of an arbitrary number of different factors.
- an analyst may receive a score for her past performance and another score for the recency of her estimate. Using a pre-defined function, these factor scores can be consolidated with the result being a summary weight for each analyst.
- the estimates and revisions of either a single or plurality of analysts' can be composited for a given fiscal period by calculating the weighted average of estimates such that an improved estimate can be calculated.
- a custom composite estimate or composite estimate may be calculated by multiplying a plurality of analysts' current earnings estimates for a particular security by their respective weighting factors and then summing over each estimate.
- analyst recommendations at a point in time can be automatically weighted according to different factors to create an improved composite recommendation by multiplying each analyst's recommendation by that analyst's weighting factor.
- a system and method enable a user to track, analyze, and compare analysts' past performances.
- a database may be provided that contains information about analyst's past performance through the combination of each analyst estimate record in the database has a number of predetermined data fields.
- the database may comprise a combination of estimate data comprising raw data regarding estimates and performance for analysts and a pre-calculated values that are calculated and stored in the database for further analysis.
- the pre-calculated values may be based on the estimate data loaded from a secondary source analyst performance database or maintained on that database from a transaction processing system, for example.
- These pre-calculated values may include error metric values for each security, for each historical fiscal period in the database, for each contributor (e.g., analyst/broker pair) is a row in the database.
- Each row comprises multiple error metrics valued over a range of time periods. For example, if three error metrics were provided, the system may maintain a value for error metric 1 over a 0-3 month time period, error metric 1 over a 3-6 month time period, error metric 2 over a 0-3 month time period, error metric 2 over a 3-6 month time period, error metric 3 over a 0-3 month time period, and error metric 3 over a 3-6 month time period.
- error metrics 1 over a 0-3 month time period
- error metric 1 over a 3-6 month time period
- error metric 2 over a 0-3 month time period
- error metric 3 over a 0-3 month time period
- error metric 3 over a 0-3 month time period
- a great number of such error metrics may be stored and
- Example fields for the pre-calculated portion of the database may comprise an analyst identifier, an event identifier, an analyst estimate date, a raw error indicator (analyst estimate minus the actual earnings for a particular event), other error metrics, such as the error percent to actual earnings, error percent to consensus, other user-defined error metrics, and the number of days between the estimate of an event and the actual event.
- This last parameter can provide a significant advantage with respect to aspects of the present invention because, in many cases, a more recent earnings estimate or revision is likely to be more accurate than an estimate made months prior to an earnings event.
- Estimates made prior to an earnings event may be classified according to Earliness Time Bins, where each Time Bin represents a range of days preceding an earnings event. For example, one Earliness Time Bin may include all estimates made between 0 and 90 days prior to an earnings event.
- the invention enables a user to rank, measure, and analyze analysts' historical performances based upon any metric, including a comparison of all or a subset of analysts within an Earliness Time Bin; a comparison of selected analysts across several Earliness Time Bins; scatterplots of percent errors versus number of days early for a single or plurality of analysts; and other comparisons.
- the invention allows for the rapid visualization and analysis of analysts' estimates or recommendations by creating and maintaining indices for predetermined data relationships, pre-calculating and storing predetermined analyst performance metrics, and calculating, compressing and storing time series estimates and summary measures of those estimates.
- a front-end graphical user interface is provided to facilitate analysis of analysts' prior performance for one or more securities.
- the prior estimates are stored in a database that includes, but is not limited to, fields corresponding to a security identifier for each security; a plurality of earnings events, such as, for example, the issuance of a company's actual quarterly or yearly earnings reports; earnings event dates; an analyst and broker identifier; and predetermined periods of times preceding an earnings event.
- Other fields and types of data also may be included.
- the front-end GUI will allow a user to select easily a security, earnings event, event date, Earliness Time Bin, and Contributors for analysis.
- the retrieved analysis information may be viewed as either raw data or, by using a data visualization technique, as a chart or graph.
- each analysts' estimates and revisions thereto are displayed simultaneously, along with the actual earnings of the companies they follow.
- each analysts' estimate is plotted on a graph displaying the estimate (in dollars and cents) on the vertical or y axis and time (in days) on the horizontal or x axis. More specifically, each analyst's estimate is displayed as a horizontal line at a level corresponding to the estimate and having a length equal to the number of days that the analyst's estimate was at that level. If any analyst revises that estimate, a new horizontal line is displayed at the new level and the two lines are connected by a vertical line, such that the plot takes the form of a step function.
- each estimate may be assigned a unique color.
- a legend box may also be displayed simultaneously with a chart or graph that indicates which color is assigned to which estimate. Selecting an analyst or derived estimate series in the legend highlights (emboldens) the corresponding time series in the chart.
- the user may show or hide individual estimate series by means of on/off controls in the legend. The user may sort the legend by analyst name, broker name, or other criteria.
- Advanced navigation techniques include selecting an analyst from the legend and issuing a command (e.g., from a right-click pop-up menu) to jump to a detailed display of historical performance for the selected analyst.
- the user has the ability to arbitrarily change the scale of viewing and can zoom in to fill the screen with two days of information or zoom out to see five years of information.
- a chart of the selected securities prices can be displayed on a chart below the estimates chart.
- the horizontal (time) axes of the two chart are synchronized so that zooming one chart zooms.
- This technique is valuable for understanding the impact on changes of estimates (or derived estimates) on changes in security price. Viewing historical estimates in this fashion may provide context and thus aid in the understanding of an analyst's performance track record and estimate revision patterns.
- This information can be used valuably when deciding how to appraise changes in an analyst's current estimates.
- This information can also be used valuably in building understanding of estimate and recommendation changes in general and therefore help the user create more valuable autoweight models.
- a user may rank, measure, and analyze the profitability of analysts' recommendations regarding the advisability of purchasing, selling, or holding a particular security at any given time. More specifically, the system allows a user to control, manipulate, and otherwise refine the normalization and translation of the recommendation descriptions of individual analysts to the scales published by FISPs such as First Call or IBES, which are used generally in the financial and business communities. In addition, weighting factors, similar to the ones described above relating to earnings estimates, and/or adjustment factors may be calculated for analysts' recommendations. Therefore, the system enables a user to view an analyst's “corrected” estimate through the use of the adjustment and weighting factor.
- FISPs such as First Call or IBES
- the system also enables a user to compare and chart the profitability of following the recommendation of one analyst versus that of another analyst or the average recommendation.
- users may create portfolio-creation rules to determine when and how much of a security to buy or sell and, furthermore, to track the value and test the profitability of having carried out such rules for a single or plurality of analysts over any given time period.
- FIG. 1 is a high-level block diagram of the security analyst performance and tracking analysis system in accordance with the present invention
- FIG. 2 is a flow diagram illustrating the method for determining the adjustment factor for a particular analyst's estimate
- FIG. 3 is a flow diagram illustrating the method for determining the weighting factor for a particular analyst's estimate
- FIG. 4 is a depiction of a graphical user interface used to input and designate analysis performance set parameters and metrics for displaying the historical earnings estimates and revisions of such estimates of a plurality of analysts and other related information;
- FIG. 5 is a depiction of a graphical user interface used to input and designate analysis performance set parameters and metrics for displaying either the raw data or visual display of a number of representations of the historical accuracy of the earnings estimates of either a single or a plurality of analysts;
- FIG. 6 is a sample illustration of the graph produced by actuating the GUI of FIG. 4;
- FIG. 7 is a sample illustration of a graph produced by actuating the GUI of FIG. 5;
- FIG. 8 is a sample illustration of a graph produced by actuating the GUI of FIG. 5.
- FIG. 9 is a sample illustration of a graph produced by actuating the GUI of FIG. 5 .
- FIGS. 10 a-c depict system architectures according to various embodiments of the present invention.
- FIGS. 11 a-c depict graphs illustrating comparative performance by two analysts with actual outcome.
- FIG. 12 depicts a screen display of a analyst search screen according to an embodiment of the present invention.
- FIG. 13 depicts a screen display of a broker search screen according to an embodiment of the present invention.
- FIG. 14 depicts a screen display of a stock filter and list screen according to an embodiment of the present invention.
- FIG. 15 depicts a screen display of a model manager screen according to an embodiment of the present invention.
- FIG. 16 depicts a screen display of a model manager according to an embodiment of the present invention.
- FIG. 17 depicts a screen display of a model manager screen according to an embodiment of the present invention.
- FIG. 18 depicts a screen display of a model manager screen according to an embodiment of the present invention.
- FIG. 19 depicts a screen display of a model manager screen according to an embodiment of the present invention.
- FIG. 20 depicts a screen display of a model manager screen according to an embodiment of the present invention.
- FIG. 21 depicts a screen display of a model manager screen according to an embodiment of the present invention.
- FIG. 22 depicts a screen display of a model manager screen according to an embodiment of the present invention.
- FIG. 23 depicts a screen display of a model manager screen according to an embodiment of the present invention.
- FIG. 24 depicts a screen display of a model manager screen according to an embodiment of the present invention.
- FIG. 25 depicts a screen display of a backtester screen according to an embodiment of the present invention.
- FIG. 26 depicts a screen of a historical view of analyst's estimates over time according to an embodiment of the present invention.
- FIG. 27 depicts a screen of a historical view of analyst's estimates over time according to an embodiment of the present invention.
- FIG. 28 depicts a screen display of an analysis screen according to an embodiment of the present invention.
- FIG. 29 depicts a screen display of various source selector screens according to an embodiment of the present invention.
- FIG. 30 depicts a screen display of a performance screen according to an embodiment of the present invention.
- FIG. 31 depicts a screen display of a performance screen according to an embodiment of the present invention.
- FIG. 1 is a block diagram illustrating a security analyst performance tracking and analysis system according to one preferred embodiment.
- FIG. 1 shows, in a broad sense, the data flow occurring within said system during a typical query for an analyst estimate comparison.
- a Global Analyst Data Object containing historical data on analyst estimates, may be transferred or otherwise downloaded, through a telecommunications link or similar method or device, from an Originating Storing Object, such as a commercial database maintained by any one of a number of financial information service providers (FISP) such as IBES, Inc. (IBES) or Fist Call Corporation (First Call), to a Retrieving Storing Object, which will preferably, but not necessarily, take the form of a network server in a computer network such as, for example, a local area network.
- FISP financial information service providers
- IBES IBES, Inc.
- Fist Call Corporation First Call
- the Global Analyst Data Object downloaded from the Originating Storing Object is typically comprised of numerous files and fields relating to historical data relevant to analyst earnings estimates and recommendations.
- An example of such a historical database is that maintained by financial information services provider IBES.
- IBES's database known as the Daily Detail Earnings Estimate History, contains more than ten years of analyst estimate forecasts, compiled from data obtained from more than 200 brokerage houses and more than 2000 individual analysts, for United States companies.
- These files and fields contain both general and specific information on analyst estimates and related data including, but not limited to, information pertaining to financial instrument type and related identification codes, broker and analyst identification, industry groupings, and detailed information on such variables as the prices of particular securities on specific dates.
- a Global Analyst Data Object may be used which contains analyst data pertaining not only to stocks publicly traded in the United States, but also international stocks and any other type of financial instrument currently in existence or created in the future.
- the database files are manipulated and otherwise processed such that they are restructured according to predetermined data fields, thereby creating a Restructured Analyst Data Object.
- each analyst earnings estimate and recommendation is restructured to have a number of predetermined data fields.
- the data comprising the Restructured Analyst Data Object will preferably reside on a server in a computer network.
- a user Using a computer terminal or other similar input device, a user will be able to access and utilize the application Module comprising the software for the present invention.
- This Module may or may not reside on the computer terminal operated by the user.
- the architecture of the present invention may comprise various structures consistent with the present invention.
- Various structures, as depicted in FIGS. 10 a-c may be provided. These systems may comprise tiers such as in an Internet based networking environment.
- the tiers may comprise a Presentation Layer, depicted in FIGS. 10 a-c as a plurality of terminals. This tier may be operatively connected to a second tier known as the Application Layer, depicted as the Retrieving Object.
- the Application Layer is preferably operatively connected to a third tier, or Data Layer, which is depicted as the Restructured Analyst Data Object.
- Other tiers may also be provided as depicted in the Figures.
- historical data accessed from the Originating Storing Object is stored on the Restructured Analyst Data Object in addition to pre-calculated analyst-performance metrics derived from the Originating Storing Object.
- the Retrieving Object preferably selectively delivers proprietary data only to those terminals having a license for the proprietary Originating Storing Object data.
- the Retrieving Object preferably delivers only the pre-calculated analyst performance metrics derived from the Originating Storing Object to those terminals not having a license for the proprietary data.
- a user may access and query the Restructured Analyst Data Object to perform any one of the numerous functions able to be performed by the present invention.
- the pre-calculated data may comprise error metrics for each security, for each historical fiscal period in the database, for each contributor (e.g., analyst/broker pair) is a row in the database.
- Each row comprises multiple error metrics valued over a range of time periods.
- Error metrics may comprise various metrics including a raw error indicator (analyst estimate minus the actual earnings for a particular event), error percent to actual earnings, percent available (percent of time that an analyst had an estimate or recommendation available in the relevant time frame), error percent to consensus, and the number of days between the estimate of an event and the actual event, for example.
- Average error metrics may also be stored. Table 1 below provides one embodiment of average error metrics that may be maintained as well as other metrics that may be stored.
- metrics including leadlag factor, swings, hits, hit percent, and mean time between revisions may be included as metrics. Table 3 below described these metrics, how they are calculated, analysis for these metrics, and a range for these metrics.
- Abs Err $ The absolute value of Error $ at a point in time.
- Bias Error Percentage If Consensus>Actual, then Bias Error equals Relative Error %, else it is 0. If Consensus ⁇ Actual, then Bias Error equals Relative Error %, else it is 0.
- Relative Error Percentage The difference between the analysts error and the consensus error, divided by the Actual-Divisor.
- Swings often, major revisions (N Std Dev away from consensus) occur simultaneously for multiple analysts. For example, this may be the case when a company reports a large earning surprise or issues a warning about upcoming growth. “Swings,” which are bold estimates that differ greatly from the consensus, are differentiated from major revisions that occur concurrently with, or near to, major revisions from other analysts. To achieve this, the system may measure whether an analyst estimate or revision is N standard deviations away from the consensus N (typically 5) days after the day the analyst's estimate was made. Swings may be measured over the 24 months prior to the report date. Unlike other error metrics which are calculated by sampling (continued) estimates over an interval and computing the corresponding average error, Swings may be determined by considering only the actual estimates or revisions. The default number of Std Dev is 1.5.
- Hit Percent A hit is a swing that proves to be closer to the actual than the consensus at N days after the date of the swing.
- Total Estimates The total number of estimates made by the analyst in the prior 24 months for the event. Confirmations are not included. An estimate pre-existing exactly 24 months prior to the report are counted in the total.
- MTBR Green Time between Revisions—Measures frequency of analyst revision in the year prior to the report date. Equals the number of days in which there was an active estimate in the year prior to the report date divided by the Total Estimates.
- Best Error The value of the analyst's lowest RelErr % at the corresponding Best Date.
- a lead lag score may be provided.
- Table 4 represents calculations with the following understanding: C 0 represents the consensus on the day of the estimate in question, C 1 represents the consensus on the n-th day prior to the day of the estimate in question, and C 2 represents the consensus on the n-th day following the day of the estimate in question. These conditions are considered in this order to determine if an estimate is leading, lagging, or neither:
- LeadLagScore Leads - Lags TotalEstimatesForAnalyst
- an adjustment factor may be calculated.
- the adjustment factor represents the analytical “bias” which may or may not be incorporated into each analyst's earnings estimate, for a particular security, over a given period of time.
- an analyst who has, over a specified time period, issued earnings estimates for a particular company that were, in hindsight, on average too high might be assigned an adjustment factor of 0.95 for that performance analysis set, such that the analyst's issued estimate over the specified time period is reduced by five percent.
- an analyst who has historically issued estimates over a specified time period that were, in hindsight, on average too low might be assigned an adjustment factor of 1.10 for that performance analysis set, such that his actual reported estimate for that time period is increased by ten percent.
- adjustment factors are typically generated in real time in response to user-defined inputs.
- the calculation of an adjustment factor will generally be based upon a comparison of the historical earnings estimates issued by an analyst, for a given security followed by that analyst, over a particular time period.
- a user may also define further analysis parameters and metrics such that, for example, as specified by a user, the determination of an adjustment factor may take into account an analyst's historical percentage error as compared to actual earnings, generally available consensus earnings estimates, custom composite adjusted earnings estimates, or other metric.
- a user-defined parameter is the assignment by a user of a scaling factor to be applied in the calculation of the adjustment factor for a given performance analysis set.
- a user may define a performance analysis set such that, for that analysis set, a particular analyst is shown to have issued estimates that were on average 20 percent greater than actual earnings. The user will then be able to assign a scaling factor, say for example, 0.5, to be multiplied by the 20 percent error such that the effective adjustment factor for that user-defined performance analysis set reflects a 10 percent and not a 20 percent adjustment—i.e., an adjustment factor of 0.9, rounded to the nearest tenth.
- the user “discounted” the analyst's earnings estimate bias as indicated by the system's calculations.
- the formula for the calculation of the adjustment factor is set forth below:
- An improved estimate of an analyst's earnings may also be accomplished by the calculation of a weighting factor which is used to provide a weighted average of an analyst's earnings estimate, as compared to other analysts.
- this weighting factor may be based upon a variety of user-defined parameters and metrics. For example, a weighting factor for a given analyst, security, and time period may be calculated based upon the relative recency of the issuance of analyst's earnings revision or the historical consistency and/or accuracy of an analyst's adjusted estimates (as compared to actual earnings), or a combination of these or other related factors or metrics.
- the former might be assigned a relatively low weighting factor, (or even zero in some cases), as compared to a more recent estimate produced by the second analyst. This is done based upon the assumption that a more recent estimate is likely to be based upon relatively new and accurate information which may affect a company's earnings potential and, therefore, is more likely to be predictive of a company's actual earnings.
- a weighting factor for a given analyst, security, and time period may be calculated based upon the relative accuracy of one analyst as compared to another. For example, at a specific point in time prior to an earnings event for a specific security, analyst A might have issued an earnings estimate 25 percent greater than the actual earnings ultimately announced, whereas analyst B may have issued an estimate that was 100 percent greater than the actual earnings. Subsequently, at a later point in time, yet still prior to the announcement of actual earnings, analyst A might have revised his estimate so that it was 15 percent greater than the actual earnings, and analyst B may have simultaneously revised his estimate so that it was 80 percent below actual earnings. Although the average errors for both analysts A and B were 20 percent above the actual earnings, the variance over time for analyst A was much less than that for analyst B. Accordingly, analyst A's estimate of future earnings for this specific security might be assigned a weighting factor significantly higher than that assigned to the estimate of analyst B.
- the weighting factor assigned to an analyst for a given performance analysis set is really a distribution number that is evaluated in the context of a set of a plurality of analysts issuing estimates regarding a particular earnings event for a particular security.
- the weighting scheme employed can be controlled and altered by the user.
- the adjustment and weighting factors described above may be used, together with an analyst's actual earnings estimate, to calculate a custom composite estimate to arrive at a more accurate estimation of a company's earnings.
- a custom composite estimate is calculated by multiplying an analyst's current earnings estimate (for a given security, time period, and other parameters) by its corresponding adjustment and weighting factors for that given performance analysis set. The results for each estimate for each analyst being studied are then summed to arrive at the custom composite estimate. It will be appreciated that the calculation of a custom composite estimate provides investment managers and similar users with a way of better predicting not only the accuracy of an analyst's earnings estimates but also the actual earnings of a company over any given period of time.
- a predetermined system database is constructed such that each analyst estimate record in the database contains unique fields related to that estimate.
- these records contain a combination of data fields present within the Global Analyst Data Object obtained from the FISP and data fields unique to and created within the system of the present invention.
- the fields in this restructured database may include an analyst identifier; an event identifier corresponding to a specific security; an event type and date (e.g., Apple, FY-1995 or Intel, Q 2 -1997); an estimate date; a raw error indicator which corresponds to an analyst's estimate minus the actual earnings for a particular event; other metrics such as the percent error from an analyst's estimate to either the actual earnings or the consensus error; or other error metrics defined by a user.
- the typical system database record will also contain an Earliness field which contains the number of days by which an analyst's earnings estimate precedes a particular earnings event, such as a company's quarterly or annual earnings postings.
- This Earliness field can be employed to group estimates of similar Earliness into like Earliness Time Bins. It will be appreciated that this Earliness field or the usage of Earliness Time Bins will likely enhance numerous aspects of the present invention because, in many circumstances, the accuracy of an estimate made shortly before an earnings event is likely to be more accurate than an earnings estimate made months prior to the earnings event.
- each Earliness Time Bin represents a range of days early such that prior analyst estimates may be classified according to particular Earliness Time Bins.
- one Earliness Time Bin may include all estimates issued by a specified group of analysts for a given security between 7 and 30 days, inclusive, prior to an earnings event or between 31 and 90 days before such an event. In this way, this unique field will allow users to make meaningful and valuable comparisons between analyst estimates for any number of given time periods preceding a particular earnings event.
- the database of the present invention may also contain and maintain indices for predetermined data relationships and predetermined analyst performance metrics for a plurality of analysts, such as time series estimates and summary measures of those estimates. Accordingly, by utilizing this restructured database, a user will be able to both rank and analyze the performance of a plurality of analysts based upon any metric. Moreover, based on the data contained in the system database, the present invention allows for the rapid visualization of the analyses of analysts' earnings estimates and buy-sell recommendations.
- GUI front-end graphical user interface
- the graphical user interface shown contains a plurality of graphical buttons and selection boxes with pull-down menu capability.
- the selection boxes correspond to predetermined fields contained within the system database such as a security identifier or ticker; an analyst; a plurality of event types, such as yearly and quarterly earning postings; earnings event dates; and dates corresponding to Earliness Time Bins.
- other fields and types of data may be included.
- the GUI and system allow a user to manually input specific data not initially present in the database for analysis purposes.
- Manual inputs made by a user are thereafter stored within the system database such that the system may recall and list a user's prior inputs as part of a selection box's pull-down menu of selection alternatives.
- the front-end GUI allows a user to easily select from a large number and wide variety of analysis parameters and metrics.
- the historical earnings estimates of a single or plurality of analysts may be graphed using the GUI shown in FIG. 4 .
- a GUI similar to the one discussed above is used except that, in addition to the selection boxes and graphical buttons described above, there are graphical buttons present which allow a user to view a summary of the actual, high, low, and average consensus estimates as derived from the earnings estimates provided by all analysts within the system database. It is anticipated that at least one analyst can be excluded from a calculation using an exclusion function, described further below.
- Actuating the GUI display of FIG. 4 may generate, for example, the graph shown in FIG. 6 .
- the earnings estimates, and revisions of those estimates, of each analyst chosen in FIG. 4 are displayed simultaneously on a graph where the horizontal axis corresponds to a user-determined period of time or Earliness Time Bin, (preferably showing time in days) and the vertical axis plots the range of earnings estimates, (preferably in dollars and cents). More specifically, each analyst's earnings estimates and revisions over time are displayed as horizontal lines corresponding to and level with that analyst's earnings estimate for a particular time period.
- the change is plotted as a step function with a vertical or essentially vertical line connecting the two horizontal lines representing the difference between an analyst's earlier and revised estimates.
- the length of each horizontal line equals the number of days, as displayed on the horizontal axis, that the analyst's estimate was at that level.
- a graph may also display the high, low, and average consensus estimates along with the estimates of the analysts specified by the user. Additionally, one or more vertical bars showing the actual earnings for the relevant security at specific earnings posting dates may also be displayed.
- each analysts' earnings estimate, as well as the high, low, and consensus estimate, and actual earnings bars may be displayed in a unique color.
- a legend box may be displayed simultaneously with said graph which shows the colors associated with each estimate displayed.
- the accuracy of analysts' estimates over a single or plurality of time periods, for any given earnings event can be ranked and visually displayed.
- a GUI is provided similar to the one shown in FIG. 4 .
- analysts, a plurality of event types, event dates, and dates corresponding to Earliness Time Bins also included are selection boxes corresponding to the number of estimates made by an analyst; specific analysis metrics, such as raw error or percent error as compared to actual earnings; and average and standard deviation metrics.
- the information retrieved using the GUI in FIG. 5 may be viewed either as raw, numeric data or, by using a data visualization technique, as a chart, graph, or combination thereof.
- a user can specify a visualization preference by choosing from and actuating a particular GUI button, such as “view chart” or “view data.”
- FIG. 7 shows a bar chart, created by a user actuating the “view chart” graphical button in FIG. 5, illustrating a comparison of the average percent error of a plurality of analyst estimates, made in the 6 to 10 months prior to the end of Apple Computer's fiscal year.
- all those analysts chosen by a user from the GUI of FIG. 5 are displayed simultaneously along the horizontal or y-axis.
- the vertical or x-axis displays a measure of the average percent error, both positive and negative, of the estimate of each analyst displayed as compared to the actual earnings for a given security.
- This visual display allows a user to essentially rank individual analysts by the accuracy of their estimates for a given period of time or Earliness Time Bin, prior to an earnings event, and to identify the analyst(s) with the most accurate earning estimate for a given security, earnings event, and preceding time period.
- this visual display clearly illustrates the earnings bias of individual analysts such that, patterns, if any, in an analyst's earnings estimations may be investigated and analyzed.
- the vertical axis may display a measure of the average percent error, both positive and negative, of the estimate for each analyst displayed as compared to actual earnings.
- the bar representing and analysts estimate also shows, in addition to the percent error of the analyst's issued estimate, the high and low estimates, or percentile errors estimates (e.g., 90 th and 10 th percentile errors estimates), published by that analyst over the performance analysis set.
- a black section of an analyst's graphical bar may represent the average error for that analyst. Extending vertically above the black section is a bar segment which ends at a level representing that analyst's high estimate over the performance analysis set.
- an analyst legend box may be displayed for each analyst which may show such information as the number of years an analyst has been providing estimates for the security in question, and the first and last period in which the analyst issued such estimates. In this way, the individual analyst legends may provide further historical context to the historical error performance graph of FIG. 7 .
- These graphs may be generated by a user designating the performance set for (a) each analyst in list and (b) for each event chosen.
- the system user fills estimate array with data, for all chosen analysts, to create estimate time series data array—e.g., estimate.
- the system fills error array, for all chosen corresponding events and dates, to create time series error array—e.g., error.
- the system loops for each event chosen in the performance analysis set back through the previous steps.
- the system calculates an error summary metric per analyst—e.g., average error—such as average error, standard deviation, 10 and 90 percent high and low etc. and does so for each analyst.
- the chart may thus be provided.
- a visual display may also be generated which illustrates a comparison of analysts' performances over not just one but rather a plurality of time periods, as shown in FIG. 8 .
- the Earliness Time Bins chosen by the user are displayed in chronological order, with the most recent time period beginning on the left.
- the vertical axis displays a measure of the average percent error, both positive and negative, of the estimate of each analyst chosen by a user for analysis.
- a bar chart is generated wherein each analyst's percent error is indicated by a different color bar. In this way, a user can track a plurality of analysts' earnings estimates over time so as to determine when individual analyst's estimates are more accurate as compared to others.
- the graph shown in FIG. 9 may also be generated by using the GUI of FIG. 5 .
- the graph of FIG. 9 displays a scatterplot of the error of a single analyst's estimates relative to the consensus estimate error at the time the analyst's estimates were issued.
- the horizontal axis shows the number of days prior to the user-defined event
- the vertical axis shows the error relative to the consensus error.
- a value of one on the vertical axis corresponds to an estimate error that is equal to the consensus error.
- Each scatterpoint represents an estimate or revision made by an individual analyst at a specific date.
- a user will be able to construct, store, and recall custom composite earnings models for analysis and testing purposes.
- the system will allow for users to create financial transaction models by inputting specific performance analysis sets, including performance metrics and other user-defined metrics and parameters, such as scaling factors, to arrive at specific custom composite earnings estimates.
- These performance analysis sets and corresponding custom composite estimates may then be stored in the system's database for later retrieval.
- a user will be able to test such models by applying them over any previous time period, thereby essentially creating a “virtual analyst” whose hypothetical prospective performance can be compared with the historical performance of a single or plurality of analysts, or even the average historical consensus estimates for any previous time period.
- a user may be able to refine a model that can be used to accurately predict the accuracy of prospective, analysts' earnings estimates.
- FIGS. 11 a to 11 c depict the purpose between the two different types of error calculation.
- two analysts have made predictions concerning the earnings of a particular security. Their predictions, in dollars, are shown on the y-axis where $ 0 is the actual earnings, whereas the time at which the analysts made their predictions is shown along the x-axis.
- the difference between each of the depicted adjacent markings on the y-axis is equal to $, and the difference between each of the depicted x-axis markings is equal to T.
- the first analyst initially (t 0 ) predicted above the actual earnings by $ 2 , and at time t 1 modified the prediction to an estimate below ( ⁇ $ 2 ) the actual earning.
- the second analyst predicted earnings slightly below the actual earnings for the entire period shown.
- FIG. 11 b which highlights the error associated with the first analyst's predictions, it is shown that the first analyst has an average error equal to zero because the extent of the overestimate is approximately equal to the extent of the underestimate.
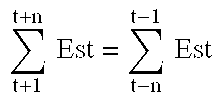
- This raw error metric is preferably calculated as follows: ⁇ t0 tn ⁇ ( Estimate - Actual )
- the overestimate is found to be ($ 2 ⁇ $ 0 )*(t 1 ⁇ t 0 ) or 2$T and the underestimate is found to be ( ⁇ $ 2 ⁇ $ 0 )*(t 2 ⁇ t 1 ) or ⁇ 2$T. Accordingly, the first analyst would receive a raw error of 0 and would accordingly be given no adjustment factor.
- the weighting factor the following equation which represents the absolute error metric, is preferably used: ⁇ t0 tn ⁇ ⁇ ( Estimate - Actual ) ⁇
- the relative error metric shows how a particular analyst performed in relation to the other analysts who were tracking a particular security over the analyzed period of time.
- the purpose of utilizing the actual earnings in the denominator of a preferred embodiment is to enable errors to be normalized so that comparisons can be made across different securities. Because small actual earnings can lead to exaggerated errors, it is possible to establish a minimum actual value, for purposes of this error metric, to prevent such exaggerated errors. For example, if the actual earnings were 0, then any analyst tracking the security would have an infinite error, so a value of, for example, $0.40 could be used to provide useful information from the analysis.
- a user will be able to rank, measure, and analyze the historical accuracy of a single or plurality of analysts' buy-sell recommendations in various ways.
- a user will be able to control and otherwise define how recommendation descriptions used by a plurality of analysts are normalized and otherwise translated into scaled recommendation numbers.
- FISPs such as First Call translate and otherwise normalize the recommendation descriptions of the numerous analysts to a scale ranging from 1 to 5, with the following descriptions: 1 (buy), 2 (buy/hold), 3 (hold), 4 (hold/sell), and 5 (sell). The FISPs then calculate an average recommendation by calculating the mean of all analysts' current recommendations as translated to this 1 to 5 scale.
- recommendation adjustment and weighting factors may be calculated in a way closely resembling that described above for analyst earnings estimates. For example, relatively recent recommendation upgrades or downgrades may be assigned a relatively high weighting factor while older recommendations may receive a weight of zero. Similarly, using these factors an improved custom composite recommendation may be determined which more accurately reflects the action (e.g., buy, sell, hold etc.) that a user should take with respect to a security. In addition, a user will have the ability to control the recommendation normalization process, if so desired, to replace the normalization performed by an FISP.
- a user will have the ability to measure the historical profitability of a single or plurality of analysts' recommendations in much the same way as described above for analyst estimates. For example, using a GUI similar to FIGS. 4 and 5, a user can create a graph illustrating the average percent error of an analyst's recommendation as compared to the average recommendation.
- Users will also have the ability to create and test portfolio creation rules. Specifically, a user can choose a security and then set up purchase and/or selling instructions that the system will make automatically. For example, a user can instruct the system to purchase a security when a specific analyst issues a recommendation of “2,” double his investment if the recommendation is upgraded to “1,” and sell all or a certain percentage of the security if and when the analyst downgrades his recommendation to “3” or lower.
- FIG. 9 provides an example of a scatterplot graph created with the present invention. This scatterplot is generated using the following equation: ⁇ t0 tn ⁇ BiasError
- bias error is equal to relative error if relative error is greater than the consensus error. If the relative error is less than the consensus error, then the bias error is assigned a value of zero over the selected time period.
- the consensus error is calculated the same as raw error is calculated for an individual analyst, except that the consensus estimate is used instead of the analyst's estimate. The bias error is useful in determining how consistently a given analyst or group of analysts outperforms the consensus for a particular security.
- Another option available in a preferred embodiment is the ability to exclude at least one Analyst. For example, if a particular analyst had an extreme error during a period of analysis that a user is evaluating, then the consensus error might be too reflective of that individual analyst's error. Accordingly, a majority of analysts could have bias errors approximately equal to zero which indicates that they are outperforming the consensus estimate. If a user wants to filter out an analyst's estimate for this or any other reason, it is possible to exclude the analyst's estimate from a particular metric analysis.
- the leadlag Factor is calculated as follows: ( Leads - Lags ) TotalEstimates
- leads is the number of times that an analyst makes an estimate revision before the majority of the analysts following a particular security
- lags is the number of times that an analyst makes an estimate revision after the majority of the analysts following a particular security
- total estimates represents the number of predictions that the analyst has made.
- a user can select a leadlag factor based on a number of different variables, including which securities, which analysts, which time periods, which earliness bins, or any combination thereof.
- a hit percent is an evaluation of the number of times that an analyst successfully revises earnings.
- a swing is preferably an estimate that is outside a predetermined standard deviation of the mean of the consensus estimate.
- a predetermined standard deviation of the consensus estimate is approximately 1.5.
- a hit is preferably a swing in which the analyst's estimate is closer to the actual earnings than the consensus estimate.
- a hit percent can then be determined by dividing the number of hits by the number of swings, and multiplying the result by 100%.
- the system may provide the user with the option of viewing a large amount of information in a variety of different formats.
- the user may desire to view contributors to see relationships between stocks, analysts and brokers, as for example, shown in FIGS. 12-14.
- the user may view by analyst, whereby the system presents analysts in the system and enables drilling into each analyst to see which firms they are associated with and which tickers they have followed.
- the user may search for a broker, and the system presents the brokers and enables drilling into the broker to view the analysts that work at the firm and the tickers followed by the analysts and the broker.
- the user may search for a ticker such as a stock.
- the system may also provide screens through which the user may manage stocks and stock groups against which analysis may be run.
- the user may do so through stock lists and stock filters.
- Stock filters may comprise tools for dynamically creating sets that are the result of user defined criteria for picking stocks including security type, country, market cap, P/E, analysts following, and earnings growth.
- FIG. 14 depicts an embodiment of a screen that enables a user to utilize these tools.
- a model managing tool may also be provided and screens may be provided to enable users to manage these models. Such screens may comprise those depicted in FIGS. 15-24.
- a backtest screen used to apply a model to historical data to test the model's accuracy may be provided, such as depicted in FIG. 25 .
- historical view screens may be provided. This provides a visual depiction of analyst's estimates over time and may be used to view trends, cluster points, visually backtesting models by placing a smart model that is calculated every N days in the chart as a visual analyst to visually see its performance against the consensus and the other analysts.
- an analysis screen may be provided that presents the impact on the change in estimates and the change in stock prices or consensus estimates.
- the user may select a time frame to measure these factors, a time bin to analyze the appropriate data sources and a set of stocks to analyze.
- the application then calculates the answers and presents a chart, such as the one depicted in FIG. 28 .
- a source selector screen may also be provided to enable the user to select sources for performing this analysis.
- the variables may include the period, start date, price change/consensus change, source, source driving condition, and stock/stock sets to analyze and the sources may include brokers, analysts, clusters, and smart estimates.
- a performance module may also be provides that enables users to see past performance at the broker, analyst and ticker level. The user may select the prior periods, performance type and error type to view.
Abstract
Description
| TABLE 1 | |||||||||
| Not pre-calculated | Comparable (across | ||||||||
| (Calculated | stocks, time | ||||||||
| Event | 0-3 | 3-6 | 6-12 | 0-12 | 0-24 | on-the-fly) | periods) | ||
| Avg-Error $ | X | X | X | X | X | |||
| Avg-Abs Err $ | X | X | X | X | X | |||
| Avg-Abs Err %ile | X | X | X | X | X | X | ||
| Avg-Error % | X | X | X | X | X | X | ||
| Avg-Abs Err % | X | X | X | X | X | X | ||
| Avg-Rel Error % | X | X | X | X | X | X | ||
| Avg-Bias Error % | X | X | X | X | X | X | ||
| Actual-Divisor (for % | X | |||||||
| calcs) | ||||||||
| Swings | X | X | ||||||
| Hit % | X | X | ||||||
| Total Estimates | X | X | ||||||
| Follow % | X | X | X | X | X | X | ||
| LeadLagScore | X | X | ||||||
| MTBR | X | X | ||||||
| Best Date | X | |||||||
| Best Error (Rel Err %) | X | |||||||
| Year first followed | X | |||||||
| TABLE 2 | ||||
| Formula | Range | Analyzing | Characteristic | |
| Error $ |
 |
Any | Closer to 0 is better | Error in dollars and cents |
| Abs Error $ |
 |
0 to Any | Closer to 0 is better. | Absolute Value of Error in $ and cents. When average is taken over interval, negative and positive errors do not cancel out- preserves magnitude of error but not sign. |
| Rel Error Pct |
 |
Any | Larger negative Numbers are better | Error Compared to the Consensus Error |
| Bias Error | If analyst's estimate is further from the | Any. Usually | Closer to 0 is | Relative Error % only |
| Percent | actual than the consensus estimate is, then | a low number | better. | if the Analyst is further |
| Biaserror = Relative Error % | from the actual than | |||
| Else | the consensus. | |||
| Biaserror = 0 | ||||
| Average Bias Error % For period t1 . . . t2 = | ||||
 |
||||
| TABLE 3 | ||||
| Formula | Analysis | Range | ||
| Leadlag Factor |
 |
Closer to 1 is better 1 = Always Leads, −1 Always Lags | −1.0 to +1.0 |
| Swings (i.e., number of times in period that analyst “stuck neck out” more than [SwingStdDevs = 1.5] standard deviations away from the consensus as measured [n = 5] days after estimate date T.) |
 |
Many swings indicate that analyst is willing to express an opinion independent from the pack. (It does | |
| # not indicate quality.) A low number of swings may indicate an analyst that follows the pack. | Positive Integer, Or 0. | ||
| Hits | A Hit is a Swing that is closer to the actual | — | Positive |
| than the consensus. | Integer or 0 | ||
| If | |||
 |
|||
| Hit Percent |
 |
100% indicates all |
0-100% |
| MTBR - Mean Time Between Revisions |
 |
Average in our current database is 89.1 days | 0-365 days |
| TABLE 4 | |||
| # | Condition | Formula | Classified as |
| 1 | Change in consensus, from n days prior to | |c2 − c1|/MAX(FudgeFctr,|c1| > Min % | Else |
| n days following estimate, must be at least | Neither | ||
| Min %, (default = 5%). Else “neither” | |||
| 2 | Consensus change prior to the estimate | (C2 > C1) AND (C2 >= C0) | Else |
| must not be different in direction from | OR | Neither | |
| change after the estimate. | (C2 < C1) AND (C2 <= C0) | ||
| 3 | Number of Estimates/Revs Between [t − n to t + n] minus [# estimates at t] >= 2 |
 |
Else Neither |
| 4 | If the Number of Estimates prior to the Estimate Date in the time frame are greater than the number of estimates after the report date in the time frame. Then this estimate is a lagging estimate. |
 |
Lagging |
| 5 | If the Number of Estimates prior to the Estimate Date in the time frame are less than the number of estimates after the report date in the time frame. Then this estimate is a Leading estimate |
 |
Leading |
| 6 | If the Number of Estimates prior to the Estimate Date in the time frame are equal to the number of estimates after the report date in the time frame. Then this estimate is neither a leading nor lagging estimate. |
 |
Neither |


Claims (15)
Priority Applications (9)
| Application Number | Priority Date | Filing Date | Title |
|---|---|---|---|
| US09/296,620 US6510419B1 (en) | 1998-04-24 | 1999-04-23 | Security analyst performance tracking and analysis system and method |
| US09/524,253 US7167838B1 (en) | 1998-04-24 | 2000-03-13 | Security analyst estimates performance viewing system and method |
| US09/577,317 US6681211B1 (en) | 1998-04-24 | 2000-05-24 | Security analyst estimates performance viewing system and method |
| US09/722,050 US7509277B1 (en) | 1998-04-24 | 2000-11-27 | Security analyst estimates performance viewing system and method |
| US09/775,599 US7603308B2 (en) | 1998-04-24 | 2001-02-05 | Security analyst estimates performance viewing system and method |
| US09/893,460 US7539637B2 (en) | 1998-04-24 | 2001-06-29 | Security analyst estimates performance viewing system and method |
| US09/982,838 US7149716B2 (en) | 1998-04-24 | 2001-10-22 | Security analyst estimates performance viewing system and method |
| US10/118,237 US20030065601A1 (en) | 1998-04-24 | 2002-04-09 | Security analyst performance tracking and analysis system and method |
| US10/119,082 US6983257B2 (en) | 1998-04-24 | 2002-04-10 | Security analyst performance tracking and analysis system and method |
Applications Claiming Priority (2)
| Application Number | Priority Date | Filing Date | Title |
|---|---|---|---|
| US8286898P | 1998-04-24 | 1998-04-24 | |
| US09/296,620 US6510419B1 (en) | 1998-04-24 | 1999-04-23 | Security analyst performance tracking and analysis system and method |
Related Child Applications (3)
| Application Number | Title | Priority Date | Filing Date |
|---|---|---|---|
| US09/524,253 Continuation-In-Part US7167838B1 (en) | 1998-04-24 | 2000-03-13 | Security analyst estimates performance viewing system and method |
| US10/118,237 Division US20030065601A1 (en) | 1998-04-24 | 2002-04-09 | Security analyst performance tracking and analysis system and method |
| US10/119,082 Division US6983257B2 (en) | 1998-04-24 | 2002-04-10 | Security analyst performance tracking and analysis system and method |
Publications (1)
| Publication Number | Publication Date |
|---|---|
| US6510419B1 true US6510419B1 (en) | 2003-01-21 |
Family
ID=22173954
Family Applications (3)
| Application Number | Title | Priority Date | Filing Date |
|---|---|---|---|
| US09/296,620 Expired - Lifetime US6510419B1 (en) | 1998-04-24 | 1999-04-23 | Security analyst performance tracking and analysis system and method |
| US10/118,237 Abandoned US20030065601A1 (en) | 1998-04-24 | 2002-04-09 | Security analyst performance tracking and analysis system and method |
| US10/119,082 Expired - Lifetime US6983257B2 (en) | 1998-04-24 | 2002-04-10 | Security analyst performance tracking and analysis system and method |
Family Applications After (2)
| Application Number | Title | Priority Date | Filing Date |
|---|---|---|---|
| US10/118,237 Abandoned US20030065601A1 (en) | 1998-04-24 | 2002-04-09 | Security analyst performance tracking and analysis system and method |
| US10/119,082 Expired - Lifetime US6983257B2 (en) | 1998-04-24 | 2002-04-10 | Security analyst performance tracking and analysis system and method |
Country Status (3)
| Country | Link |
|---|---|
| US (3) | US6510419B1 (en) |
| AU (1) | AU3966099A (en) |
| WO (1) | WO1999056192A2 (en) |
Cited By (102)
| Publication number | Priority date | Publication date | Assignee | Title |
|---|---|---|---|---|
| US20020002520A1 (en) * | 1998-04-24 | 2002-01-03 | Gatto Joseph G. | Security analyst estimates performance viewing system and method |
| US20020022988A1 (en) * | 1999-06-18 | 2002-02-21 | Columbus Craig E. | System, method and computer readable medium containing instructions for evaluating and disseminating securities analyst performance information |
| US20020030701A1 (en) * | 1998-10-16 | 2002-03-14 | Knight Timothy Orr | Interface and method adapted for capturing subjective preferences of program users |
| US20020052820A1 (en) * | 1998-04-24 | 2002-05-02 | Gatto Joseph G. | Security analyst estimates performance viewing system and method |
| US20020089528A1 (en) * | 2000-08-18 | 2002-07-11 | Hay Andrew Charles David | Security apparatus |
| US20020099637A1 (en) * | 2000-07-26 | 2002-07-25 | Wilkinson William T. | Intellectual property investment process |
| US20020123952A1 (en) * | 2000-12-06 | 2002-09-05 | Arthur Lipper | Dynamic security price and value comparator and indexer |
| US20020156714A1 (en) * | 1998-04-24 | 2002-10-24 | Gatto Joseph G. | Security analyst performance tracking and analysis system and method |
| US20020178099A1 (en) * | 2001-05-25 | 2002-11-28 | Shayne Young | Methods and systems for managing a portfolio of securities |
| US20020184133A1 (en) * | 2001-05-31 | 2002-12-05 | Zangari Peter J. | Method and system for verifying the integrity of data in a data warehouse and applying warehoused data to a plurality of predefined analysis models |
| US20020184131A1 (en) * | 1998-04-24 | 2002-12-05 | Gatto Joseph G. | Security analyst estimates performance viewing system and method |
| US20020188548A1 (en) * | 2001-06-06 | 2002-12-12 | John Bunda | Methods and systems for monitoring securities quotes |
| US20020194110A1 (en) * | 2001-06-19 | 2002-12-19 | Shayne Young | Methods and systems for implementing a forward conversion securities strategy |
| US20020194111A1 (en) * | 2001-06-19 | 2002-12-19 | Shayne Young | Methods and systems for reconciling a forward conversion securities strategy |
| US20030041006A1 (en) * | 2001-08-21 | 2003-02-27 | John Bunda | Methods and systems for suppression of stale or invalid data in a securities quotation display |
| US20030065604A1 (en) * | 2001-10-03 | 2003-04-03 | Joseph Gatto | Methods and systems for measuring performance of a security analyst |
| US20030065605A1 (en) * | 2001-10-03 | 2003-04-03 | Joseph Gatto | Methods and systems for measuring performance of a security analyst |
| US20030065598A1 (en) * | 2001-10-03 | 2003-04-03 | John Bunda | Methods and systems for managing a portfolio of securities |
| US20030083974A1 (en) * | 2001-10-26 | 2003-05-01 | John Bunda | Method and system for managing display of quotes for securities from multiple sources |
| US20030105699A1 (en) * | 2001-12-03 | 2003-06-05 | Richard Redpath | Technique for calculating and displaying securities options data to produce a visual pattern of potential future values |
| US6681211B1 (en) | 1998-04-24 | 2004-01-20 | Starmine Corporation | Security analyst estimates performance viewing system and method |
| US20040088649A1 (en) * | 2002-10-31 | 2004-05-06 | International Business Machines Corporation | System and method for finding the recency of an information aggregate |
| US20040103002A1 (en) * | 2002-11-26 | 2004-05-27 | Colley John Lawrence | Method for health plan management |
| WO2004047082A2 (en) * | 2002-11-14 | 2004-06-03 | Goldman, Sachs & Co. | Independent research consensus earnings estimates and methods of determining such |
| US20040111353A1 (en) * | 2002-12-03 | 2004-06-10 | Ellis Robert A. | System and method for managing investment information |
| US20040153389A1 (en) * | 2003-01-23 | 2004-08-05 | Lortscher Frank Duane | System and method for generating transaction based recommendations |
| US20040179011A1 (en) * | 2003-03-14 | 2004-09-16 | Marshall James F. | Data display method and system |
| US20040254870A1 (en) * | 2003-06-16 | 2004-12-16 | Chitaley Ani D. | Predicting a future price range for a desired volume |
| US6839686B1 (en) * | 1999-03-29 | 2005-01-04 | Dlj Long Term Investment Corporation | Method and system for providing financial information and evaluating securities of a financial debt instrument |
| US20050055673A1 (en) * | 2003-09-05 | 2005-03-10 | Oracle International Corporation | Automatic database diagnostic monitor architecture |
| WO2005022420A1 (en) * | 2003-08-29 | 2005-03-10 | Medical Technologies Inc. | Method and system for securing information assets and risk managing |
| US6876955B1 (en) * | 2001-12-28 | 2005-04-05 | Fannie Mae | Method and apparatus for predicting and reporting a real estate value based on a weighted average of predicted values |
| US20050080695A1 (en) * | 2003-10-09 | 2005-04-14 | Gatto Joseph G. | System and method for facilitating the selection of security analyst research reports |
| US20050086195A1 (en) * | 2003-09-04 | 2005-04-21 | Leng Leng Tan | Self-managing database architecture |
| US20050091085A1 (en) * | 2003-10-23 | 2005-04-28 | Colley John L. | Method for evaluating the value of group and individual insurance products |
| US20050187855A1 (en) * | 2004-02-20 | 2005-08-25 | Brennan David P. | Method for analyzing trade data |
| US6938044B1 (en) * | 2001-12-28 | 2005-08-30 | Ncr Corporation | Tracking usage of resources of a database system |
| US20050267824A1 (en) * | 2004-05-28 | 2005-12-01 | Hurewitz Barry S | Matching resources of a securities research department to accounts of the department |
| US20050289038A1 (en) * | 2004-06-28 | 2005-12-29 | Alexander Karapetian | Method and system for voting for a future price of an asset |
| US20060004584A1 (en) * | 2002-10-15 | 2006-01-05 | Timothy Knight | Electronic interface configured for displaying & identifying mixed types of information |
| US20060010053A1 (en) * | 2004-07-12 | 2006-01-12 | Pension Builders And Consultants | Asset allocation based system for individual investor portfolio selection |
| US20060015425A1 (en) * | 2004-07-15 | 2006-01-19 | Brooks Kent F | System and method for providing customizable investment tools |
| US20060059075A1 (en) * | 2004-09-10 | 2006-03-16 | Hurewitz Barry S | Systems and methods for auctioning access to securities research resources |
| US7016873B1 (en) * | 2000-03-02 | 2006-03-21 | Charles Schwab & Co., Inc. | System and method for tax sensitive portfolio optimization |
| US20060074785A1 (en) * | 2004-09-29 | 2006-04-06 | Jeffrey Festog | Method and system for evaluating the investment ratings of a securities analyst |
| US20060116943A1 (en) * | 2004-11-30 | 2006-06-01 | Pascal Willain | Method to determine price inflections of securities |
| US7058601B1 (en) * | 2000-02-28 | 2006-06-06 | Paiz Richard S | Continuous optimization and strategy execution computer network system and method |
| US20060161492A1 (en) * | 1999-06-18 | 2006-07-20 | Thomson Financial, Inc. | System, method and computer readable medium containing instructions for evaluating and disseminating investor performance information |
| US20060218179A1 (en) * | 2005-03-25 | 2006-09-28 | The Motley Fool, Inc. | System, method, and computer program product for scoring items based on user sentiment and for determining the proficiency of predictors |
| US20060229962A1 (en) * | 2005-04-08 | 2006-10-12 | Hiskett Herbert C | Evaluation of securities |
| US20070011073A1 (en) * | 2005-03-25 | 2007-01-11 | The Motley Fool, Inc. | System, method, and computer program product for scoring items based on user sentiment and for determining the proficiency of predictors |
| US20070043653A1 (en) * | 2005-08-16 | 2007-02-22 | Hughes John M | Systems and methods for providing investment opportunities |
| US20080154827A1 (en) * | 2006-12-20 | 2008-06-26 | Connors Laurence A | Method of comparing actual and user predicted changes in data |
| US7401039B1 (en) * | 2000-12-15 | 2008-07-15 | Ebay Inc. | Analytical tools for a community of investors having investment portfolios |
| US20080215988A1 (en) * | 2000-06-21 | 2008-09-04 | Ebay Inc. | System and method to process information contributed by members of a virtual community |
| US20090106756A1 (en) * | 2007-10-19 | 2009-04-23 | Oracle International Corporation | Automatic Workload Repository Performance Baselines |
| US20090186689A1 (en) * | 2008-01-21 | 2009-07-23 | Hughes John M | Systems and methods for providing investment opportunities |
| US20090192812A1 (en) * | 2008-01-28 | 2009-07-30 | Hurowitz Glenn C | Wall Street Rating System, Method, and Apparatus |
| US20090217183A1 (en) * | 2008-02-22 | 2009-08-27 | James Moyne | User interface with visualization of real and virtual data |
| US20090216348A1 (en) * | 2008-02-22 | 2009-08-27 | James Moyne | Dynamically updated predictive model |
| WO2009105704A1 (en) * | 2008-02-22 | 2009-08-27 | Applied Materials, Inc. | User interface with visualization of real and virtual data |
| US7618312B1 (en) | 2004-04-30 | 2009-11-17 | Advanced Sports Media, LLC | System and method for using draft position information to aid player selection in a fantasy league draft |
| US20100067029A1 (en) * | 2003-03-14 | 2010-03-18 | Marshall James F | Colored investment data display system and method |
| US7729965B1 (en) | 2005-04-26 | 2010-06-01 | Fannie Mae | Collateral valuation confidence scoring system |
| US7747486B1 (en) * | 2000-05-08 | 2010-06-29 | James Kemp Smith | Financial analysis system interface |
| US7752112B2 (en) | 2006-11-09 | 2010-07-06 | Starmine Corporation | System and method for using analyst data to identify peer securities |
| US7765125B1 (en) | 2005-01-12 | 2010-07-27 | Fannie Mae | Trunk branch repeated transaction index for property valuation |
| US7783547B1 (en) | 2004-12-10 | 2010-08-24 | HedgeCity Corporation | System and method for determining hedge strategy stock market forecasts |
| US7822691B1 (en) | 2001-12-28 | 2010-10-26 | Fannie Mae | Method for determining house prices indices |
| US7831492B1 (en) | 2005-01-12 | 2010-11-09 | Fannie Mae | Multiple transaction property valuation |
| US20100306098A1 (en) * | 2005-06-06 | 2010-12-02 | Trading Technologies International, Inc. | System and method for trading multiple tradeable objects using a single trading interface |
| US7877309B2 (en) | 2004-10-18 | 2011-01-25 | Starmine Corporation | System and method for analyzing analyst recommendations on a single stock basis |
| US7930254B1 (en) | 2005-08-05 | 2011-04-19 | Fannie Mae | Property value estimation using feature distance from comparable sales |
| US7953652B1 (en) | 2006-06-12 | 2011-05-31 | Morgan Stanley | Profit model for non-execution services |
| US20110135557A1 (en) * | 2009-12-04 | 2011-06-09 | Vishwanathan Rangarajan | Hardmask materials |
| US7983925B1 (en) | 2001-12-31 | 2011-07-19 | Fannie Mae | Efficient computation method for determining house price indices |
| US20110276464A1 (en) * | 2005-06-29 | 2011-11-10 | Itg Software Solutions, Inc. | System and method for generating real-time indicators in a trading list or portfolio |
| US8078522B1 (en) | 2007-03-09 | 2011-12-13 | Uat, Inc. | System and method for exchanging institutional research and trade order execution services |
| US8099182B1 (en) | 2004-04-30 | 2012-01-17 | Advanced Sports Media, LLC | System and method for facilitating analysis of game simulation of spectator sports leagues |
| US20120173985A1 (en) * | 2010-12-29 | 2012-07-05 | Tyler Peppel | Multi-dimensional visualization of temporal information |
| US8266025B1 (en) * | 1999-08-09 | 2012-09-11 | Citibank, N.A. | System and method for assuring the integrity of data used to evaluate financial risk or exposure |
| US20120254063A1 (en) * | 2011-04-04 | 2012-10-04 | Investlab Technology Limited | Researching exchange-listed products using sentiment |
| US20120317053A1 (en) * | 2011-06-10 | 2012-12-13 | Benchmark Solutions Holdings, Inc. | Fixed income securities market data display |
| US8566146B1 (en) * | 2012-05-10 | 2013-10-22 | Morgan Stanley & Co. Llc | Computer-based systems and method for computing a score for contacts of a financial services firm indicative of resources to be deployed by the financial services firm for the contacts to maximize revenue for the financial services firm |
| US8635130B1 (en) * | 2000-02-14 | 2014-01-21 | Td Ameritrade Ip Company, Inc. | Method and system for analyzing and screening investment information |
| US8738388B1 (en) | 2005-01-12 | 2014-05-27 | Fannie Mae | Market based data cleaning |
| US20140278755A1 (en) * | 2013-03-13 | 2014-09-18 | Salesforce.Com, Inc. | Systems, methods, and apparatuses for implementing change value indication and historical value comparison |
| US20140279367A1 (en) * | 2013-03-15 | 2014-09-18 | Integral Development Inc. | Method and System for Calculating and Utilizing Realized Spread in Financial Transactions |
| US8977621B1 (en) | 2000-02-24 | 2015-03-10 | Richard Paiz | Search engine optimizer |
| US20150356682A1 (en) * | 2000-07-18 | 2015-12-10 | Dcfb Llc C/O Intercontinental Exchange, Inc. | Automated trading system in an electronic trading exchange |
| US9355352B1 (en) | 2000-02-24 | 2016-05-31 | Richard Paiz | Personal search results |
| USD820288S1 (en) * | 2013-12-13 | 2018-06-12 | Kbc Advanced Technologies Plc | Display screen with graphical user interface |
| US10915523B1 (en) | 2010-05-12 | 2021-02-09 | Richard Paiz | Codex search patterns |
| US10922363B1 (en) | 2010-04-21 | 2021-02-16 | Richard Paiz | Codex search patterns |
| US10936687B1 (en) | 2010-04-21 | 2021-03-02 | Richard Paiz | Codex search patterns virtual maestro |
| US10959090B1 (en) | 2004-08-25 | 2021-03-23 | Richard Paiz | Personal search results |
| US11048765B1 (en) | 2008-06-25 | 2021-06-29 | Richard Paiz | Search engine optimizer |
| US11281664B1 (en) | 2006-10-20 | 2022-03-22 | Richard Paiz | Search engine optimizer |
| US11379473B1 (en) | 2010-04-21 | 2022-07-05 | Richard Paiz | Site rank codex search patterns |
| US11423018B1 (en) | 2010-04-21 | 2022-08-23 | Richard Paiz | Multivariate analysis replica intelligent ambience evolving system |
| US11741090B1 (en) | 2013-02-26 | 2023-08-29 | Richard Paiz | Site rank codex search patterns |
| US11809506B1 (en) | 2013-02-26 | 2023-11-07 | Richard Paiz | Multivariant analyzing replicating intelligent ambience evolving system |
Families Citing this family (62)
| Publication number | Priority date | Publication date | Assignee | Title |
|---|---|---|---|---|
| US6901383B1 (en) | 1999-05-20 | 2005-05-31 | Ameritrade Holding Corporation | Stock purchase indices |
| US6876991B1 (en) | 1999-11-08 | 2005-04-05 | Collaborative Decision Platforms, Llc. | System, method and computer program product for a collaborative decision platform |
| US7451108B1 (en) | 2000-03-31 | 2008-11-11 | Skuriat Paul G | Method and system for measuring trade management performance |
| US6847944B1 (en) * | 2000-03-31 | 2005-01-25 | Ford Global Technologies, Llc | Method of evaluating long-term average portfolio risk and return for cyclical corporation |
| US20020152150A1 (en) * | 2001-04-17 | 2002-10-17 | Lisette Cooper | Visualization of asset information |
| US7028006B1 (en) * | 2000-10-03 | 2006-04-11 | Pricemetrix, Inc. | Peer based doctrine performance framework |
| US7167837B1 (en) * | 2001-04-16 | 2007-01-23 | Ft Interactive Data Corporation | Fair-value pricing of a financial asset |
| US9311673B2 (en) | 2002-06-05 | 2016-04-12 | Nasdaq, Inc. | Security transaction matching |
| AU2003236493B2 (en) * | 2002-08-28 | 2009-09-17 | Rp Data Pty Ltd | Asset performance prediction |
| CA2504832A1 (en) * | 2002-10-30 | 2004-05-13 | Ran Zilberman | Electronic interpretation of financials |
| US20040133497A1 (en) * | 2002-12-18 | 2004-07-08 | Spear Gregory R. | System and methods for determining performance-weighted consensus |
| US20040230470A1 (en) * | 2003-01-30 | 2004-11-18 | Accenture Global Services Gmbh | Marketing forecasting tool using econometric modeling |
| US7779018B2 (en) * | 2003-05-15 | 2010-08-17 | Targit A/S | Presentation of data using meta-morphing |
| ATE350715T1 (en) * | 2003-05-15 | 2007-01-15 | Targit As | METHOD AND USER INTERFACE FOR FORMING A REPRESENTATION OF DATA USING META-MORPHING |
| US8468444B2 (en) * | 2004-03-17 | 2013-06-18 | Targit A/S | Hyper related OLAP |
| US7565417B2 (en) | 2004-05-20 | 2009-07-21 | Rowady Jr E Paul | Event-driven financial analysis interface and system |
| US7348982B2 (en) * | 2004-09-30 | 2008-03-25 | Microsoft Corporation | Method, system, and computer-readable medium for creating and laying out a graphic within an application program |
| US8134575B2 (en) | 2004-09-30 | 2012-03-13 | Microsoft Corporation | Maintaining graphical presentations based on user customizations |
| US8510657B2 (en) * | 2004-09-30 | 2013-08-13 | Microsoft Corporation | Editing the text of an arbitrary graphic via a hierarchical list |
| US7774295B2 (en) * | 2004-11-17 | 2010-08-10 | Targit A/S | Database track history |
| ATE470193T1 (en) * | 2004-11-17 | 2010-06-15 | Targit As | DATABASE WITH HISTORY STORAGE |
| US20060149579A1 (en) * | 2004-12-30 | 2006-07-06 | The National Research Exchange | Monitoring method and system |
| US20060229963A1 (en) * | 2005-04-11 | 2006-10-12 | Jennifer Creager | Portfolio performance tracking |
| US8438486B2 (en) | 2006-02-09 | 2013-05-07 | Microsoft Corporation | Automatically converting text to business graphics |
| US20070239590A1 (en) * | 2006-04-07 | 2007-10-11 | Lee Gang P | Two-step method and system for commodity trading |
| US20070245258A1 (en) * | 2006-04-13 | 2007-10-18 | Codman Neuro Sciences Sàrl | Graphical user interface of an external control device for controlling an implantable medical device while minimizing human error |
| US7620578B1 (en) | 2006-05-01 | 2009-11-17 | Jpmorgan Chase Bank, N.A. | Volatility derivative financial product |
| EP2021953A2 (en) * | 2006-05-16 | 2009-02-11 | Targit A/S | A method of preparing an intelligent dashboard for data monitoring |
| JP2009539185A (en) * | 2006-05-31 | 2009-11-12 | モルガン・スタンレー | System and method for tracking investment metrics |
| DK176532B1 (en) | 2006-07-17 | 2008-07-14 | Targit As | Procedure for integrating documents with OLAP using search, computer-readable medium and computer |
| US8364572B2 (en) * | 2006-11-16 | 2013-01-29 | Protégé Partners, LLC | Method and system for evaluating pricing of assets |
| US8032566B2 (en) * | 2006-12-04 | 2011-10-04 | Teradata Us, Inc. | Tools for defining and using custom analysis modules |
| US20080270401A1 (en) * | 2007-04-26 | 2008-10-30 | Kristin Petersen | Method and Apparatus for Displaying Sorted Test Data Entries |
| US20080270885A1 (en) * | 2007-04-26 | 2008-10-30 | Kristin Petersen | Method and Apparatus for Displaying Sorted Test Data Entries |
| US7941359B2 (en) * | 2007-06-26 | 2011-05-10 | Wall Street On Demand | Computer-based method for teaming research analysts to generate improved securities investment recommendations |
| US20090187504A1 (en) * | 2008-01-21 | 2009-07-23 | Tradedevil, Inc. | Non-traditional futures contract and associated processing systems |
| US11087261B1 (en) * | 2008-03-14 | 2021-08-10 | DataInfoCom USA Inc. | Apparatus, system and method for processing, analyzing or displaying data related to performance metrics |
| US8332305B1 (en) * | 2008-09-22 | 2012-12-11 | Optionmonster Holdings, Inc. | Automatic strategy grouping for a trading system |
| US8352347B2 (en) * | 2008-12-29 | 2013-01-08 | Athenainvest, Inc. | Investment classification and tracking system using diamond ratings |
| US20110035330A1 (en) * | 2009-08-07 | 2011-02-10 | Fmr Llc | Quality Control of Investment Performance Calculations |
| US8799325B2 (en) | 2010-03-12 | 2014-08-05 | Microsoft Corporation | Reordering nodes in a hierarchical structure |
| US8626631B2 (en) * | 2010-05-25 | 2014-01-07 | Harbor East Associates, Llc | Adaptive closed loop investment decision engine |
| US8510206B2 (en) * | 2010-07-26 | 2013-08-13 | Trading Technologies International, Inc. | Consolidated price level expansion |
| US8930250B1 (en) | 2010-08-26 | 2015-01-06 | Edward Jones & Co. | System and method of evaluating an investment portfolio |
| US8732059B2 (en) | 2010-08-26 | 2014-05-20 | Edward D. Jones & Co., L.P. | Method and system for building an investment portfolio |
| US8694406B2 (en) | 2011-03-29 | 2014-04-08 | Athenainvest, Inc. | Strategy market barometer |
| US8606680B2 (en) * | 2011-06-06 | 2013-12-10 | Drw Innovations, Llc | Method for trading and clearing variance swaps |
| US9081488B2 (en) * | 2011-10-19 | 2015-07-14 | Boston Scientific Neuromodulation Corporation | Stimulation leadwire and volume of activation control and display interface |
| US8738502B2 (en) * | 2011-10-27 | 2014-05-27 | Itg Software Solutions, Inc. | Electronic trading system and method that provide real-time trade analytics |
| US10262365B2 (en) | 2012-04-16 | 2019-04-16 | Nasdaq Technology Ab | Method and a computerized exchange system for processing trade orders |
| WO2014022837A1 (en) * | 2012-08-02 | 2014-02-06 | Cicio Jr Frank C | Skilled based, staffing system coordinated with communication based, project management application |
| US20140046709A1 (en) * | 2012-08-08 | 2014-02-13 | Mark Clement Kwapiszeski | Methods and systems for evaluating technology assets |
| US20140258175A1 (en) * | 2013-03-08 | 2014-09-11 | The Motley Fool Holdings, Inc. | Generating Personalized Investment Recommendations |
| US10789609B2 (en) * | 2013-03-13 | 2020-09-29 | Eversight, Inc. | Systems and methods for automated promotion to profile matching |
| US20140317019A1 (en) * | 2013-03-14 | 2014-10-23 | Jochen Papenbrock | System and method for risk management and portfolio optimization |
| WO2018020495A1 (en) | 2016-07-27 | 2018-02-01 | Epistema Ltd. | Computerized environment for human expert analysts |
| US11861637B2 (en) * | 2016-09-29 | 2024-01-02 | Clear Demand, Inc. | System of demand modeling and price calculation based on interpolated market price elasticity functions |
| KR102151759B1 (en) * | 2018-11-08 | 2020-09-03 | 주식회사 윤디자인그룹 | Method for applying kerning to hangeul |
| US11741546B1 (en) * | 2021-01-22 | 2023-08-29 | Wells Fargo Bank N.A. | Data capture and integration architecture for a quantamental computer system |
| US20220358588A1 (en) * | 2021-05-05 | 2022-11-10 | Talal A. DEBS | Systems and methods for esg capital derivatives, swaps, options, and swaptions |
| AU2022305267A1 (en) * | 2021-07-02 | 2024-02-01 | Agora Intelligence, Inc. | Method, apparatus, and computer readable medium for dynamically modeling a current price of an invoice issued by a seller based on real-time monitoring of transaction data on a computer network |
| CN115525556B (en) * | 2022-09-29 | 2023-06-20 | 成都万创科技股份有限公司 | Test method and system of AI decision system |
Citations (34)
| Publication number | Priority date | Publication date | Assignee | Title |
|---|---|---|---|---|
| US3270190A (en) | 1962-10-01 | 1966-08-30 | Electronic Stock Evaluator Cor | Securities evaluator |
| US5006998A (en) | 1987-11-05 | 1991-04-09 | Hitachi, Ltd. | Computer system with easy input means for consultation |
| US5132899A (en) | 1989-10-16 | 1992-07-21 | Fox Philip J | Stock and cash portfolio development system |
| US5365425A (en) | 1993-04-22 | 1994-11-15 | The United States Of America As Represented By The Secretary Of The Air Force | Method and system for measuring management effectiveness |
| US5500795A (en) | 1992-07-30 | 1996-03-19 | Teknekron Infoswitch Corporation | Method and system for monitoring and controlling the performance of a call processing center |
| US5502637A (en) | 1994-06-15 | 1996-03-26 | Thomson Shared Services, Inc. | Investment research delivery system |
| US5608620A (en) * | 1990-03-19 | 1997-03-04 | Lundgren; Carl A. | Method of eliciting unbiased forecasts by relating a forecaster's pay to the forecaster's contribution to a collective forecast |
| US5613072A (en) | 1991-02-06 | 1997-03-18 | Risk Data Corporation | System for funding future workers compensation losses |
| US5749077A (en) | 1994-11-28 | 1998-05-05 | Fs Holdings, Inc. | Method and apparatus for updating and selectively accessing financial records related to investments |
| US5761442A (en) | 1994-08-31 | 1998-06-02 | Advanced Investment Technology, Inc. | Predictive neural network means and method for selecting a portfolio of securities wherein each network has been trained using data relating to a corresponding security |
| US5774880A (en) | 1992-06-10 | 1998-06-30 | Cantor Fitzgerald & Co., Inc. | Fixed income portfolio index processor |
| US5774881A (en) | 1995-10-30 | 1998-06-30 | Efi Actuaries | Method of determining optimal asset allocation utilizing asset cash flow simulation |
| US5802518A (en) | 1996-06-04 | 1998-09-01 | Multex Systems, Inc. | Information delivery system and method |
| US5812988A (en) | 1993-12-06 | 1998-09-22 | Investments Analytic, Inc. | Method and system for jointly estimating cash flows, simulated returns, risk measures and present values for a plurality of assets |
| US5819271A (en) | 1996-06-04 | 1998-10-06 | Multex Systems, Inc. | Corporate information communication and delivery system and method including entitlable hypertext links |
| US5852811A (en) | 1987-04-15 | 1998-12-22 | Proprietary Financial Products, Inc. | Method for managing financial accounts by a preferred allocation of funds among accounts |
| US5864871A (en) | 1996-06-04 | 1999-01-26 | Multex Systems | Information delivery system and method including on-line entitlements |
| US5893079A (en) | 1994-12-13 | 1999-04-06 | Fs Holdings, Inc. | System for receiving, processing, creating, storing, and disseminating investment information |
| US5909669A (en) | 1996-04-01 | 1999-06-01 | Electronic Data Systems Corporation | System and method for generating a knowledge worker productivity assessment |
| US5911136A (en) | 1987-04-15 | 1999-06-08 | Proprietary Financial Products, Inc. | System for prioritized operation of a personal financial account comprising liabilities and investment assets |
| US5918217A (en) | 1997-12-10 | 1999-06-29 | Financial Engines, Inc. | User interface for a financial advisory system |
| US5946666A (en) | 1996-05-21 | 1999-08-31 | Albert Einstein Healthcare Network | Monitoring device for financial securities |
| US5948054A (en) | 1996-02-27 | 1999-09-07 | Sun Microsystems, Inc. | Method and system for facilitating the exchange of information between human users in a networked computer system |
| US5950176A (en) | 1996-03-25 | 1999-09-07 | Hsx, Inc. | Computer-implemented securities trading system with a virtual specialist function |
| US5963922A (en) | 1996-02-29 | 1999-10-05 | Helmering; Paul F. | System for graphically mapping related elements of a plurality of transactions |
| US6012043A (en) | 1996-09-09 | 2000-01-04 | Nationwide Mutual Insurance Co. | Computerized system and method used in financial planning |
| US6012042A (en) | 1995-08-16 | 2000-01-04 | Window On Wallstreet Inc | Security analysis system |
| US6021397A (en) | 1997-12-02 | 2000-02-01 | Financial Engines, Inc. | Financial advisory system |
| JP2000090150A (en) * | 1998-09-10 | 2000-03-31 | Cwl:Kk | Stock price estimation method and device using trend line |
| US6064986A (en) | 1997-09-23 | 2000-05-16 | Edelman Financial Services, Inc. | Computer assisted and/or implemented process and architecture for customer account creation, maintenance and administration for an investment and/or retirement program |
| US6119103A (en) * | 1997-05-27 | 2000-09-12 | Visa International Service Association | Financial risk prediction systems and methods therefor |
| US6125355A (en) | 1997-12-02 | 2000-09-26 | Financial Engines, Inc. | Pricing module for financial advisory system |
| US6154732A (en) | 1997-07-25 | 2000-11-28 | Guidedchoice.Com | System for providing investment advice and management of pension assets |
| US6236980B1 (en) | 1998-04-09 | 2001-05-22 | John P Reese | Magazine, online, and broadcast summary recommendation reporting system to aid in decision making |
Family Cites Families (14)
| Publication number | Priority date | Publication date | Assignee | Title |
|---|---|---|---|---|
| US5819226A (en) * | 1992-09-08 | 1998-10-06 | Hnc Software Inc. | Fraud detection using predictive modeling |
| US5675746A (en) * | 1992-09-30 | 1997-10-07 | Marshall; Paul S. | Virtual reality generator for use with financial information |
| US6064984A (en) * | 1996-08-29 | 2000-05-16 | Marketknowledge, Inc. | Graphical user interface for a computer-implemented financial planning tool |
| US6253192B1 (en) * | 1996-08-30 | 2001-06-26 | The Quantam Consultancy Group (Proprietary) Limited | Method of personal financial planning |
| US6317726B1 (en) * | 1996-12-30 | 2001-11-13 | Netfolio, Inc. | Automated strategies for investment management |
| US5956691A (en) * | 1997-01-07 | 1999-09-21 | Second Opinion Financial Systems, Inc. | Dynamic policy illustration system |
| US6370516B1 (en) * | 1998-03-16 | 2002-04-09 | John P Reese | Computer based device to report the results of codified methodologies of financial advisors applied to a single security or element |
| US6208720B1 (en) * | 1998-04-23 | 2001-03-27 | Mci Communications Corporation | System, method and computer program product for a dynamic rules-based threshold engine |
| WO1999056192A2 (en) * | 1998-04-24 | 1999-11-04 | Starmine Corporation | Security analyst performance tracking and analysis system and method |
| US7546263B2 (en) * | 1999-06-18 | 2009-06-09 | Thomson Holdings Llc | System, method and computer readable medium containing instructions for evaluating and disseminating securities analyst performance information |
| US6792399B1 (en) * | 1999-09-08 | 2004-09-14 | C4Cast.Com, Inc. | Combination forecasting using clusterization |
| US20020082966A1 (en) * | 1999-11-16 | 2002-06-27 | Dana Commercial Credit Corporation | System and method for benchmarking asset characteristics |
| GB2367153A (en) * | 2000-03-13 | 2002-03-27 | Sort Ltd | Electronic financial system |
| WO2001080124A2 (en) | 2000-04-12 | 2001-10-25 | Thomson Financial Inc. | System, method and computer readable medium containing instructions for evaluating and disseminating securities analyst performance information |
-
1999
- 1999-04-23 WO PCT/US1999/008909 patent/WO1999056192A2/en active Application Filing
- 1999-04-23 AU AU39660/99A patent/AU3966099A/en not_active Abandoned
- 1999-04-23 US US09/296,620 patent/US6510419B1/en not_active Expired - Lifetime
-
2002
- 2002-04-09 US US10/118,237 patent/US20030065601A1/en not_active Abandoned
- 2002-04-10 US US10/119,082 patent/US6983257B2/en not_active Expired - Lifetime
Patent Citations (34)
| Publication number | Priority date | Publication date | Assignee | Title |
|---|---|---|---|---|
| US3270190A (en) | 1962-10-01 | 1966-08-30 | Electronic Stock Evaluator Cor | Securities evaluator |
| US5852811A (en) | 1987-04-15 | 1998-12-22 | Proprietary Financial Products, Inc. | Method for managing financial accounts by a preferred allocation of funds among accounts |
| US5911136A (en) | 1987-04-15 | 1999-06-08 | Proprietary Financial Products, Inc. | System for prioritized operation of a personal financial account comprising liabilities and investment assets |
| US5006998A (en) | 1987-11-05 | 1991-04-09 | Hitachi, Ltd. | Computer system with easy input means for consultation |
| US5132899A (en) | 1989-10-16 | 1992-07-21 | Fox Philip J | Stock and cash portfolio development system |
| US5608620A (en) * | 1990-03-19 | 1997-03-04 | Lundgren; Carl A. | Method of eliciting unbiased forecasts by relating a forecaster's pay to the forecaster's contribution to a collective forecast |
| US5613072A (en) | 1991-02-06 | 1997-03-18 | Risk Data Corporation | System for funding future workers compensation losses |
| US5774880A (en) | 1992-06-10 | 1998-06-30 | Cantor Fitzgerald & Co., Inc. | Fixed income portfolio index processor |
| US5500795A (en) | 1992-07-30 | 1996-03-19 | Teknekron Infoswitch Corporation | Method and system for monitoring and controlling the performance of a call processing center |
| US5365425A (en) | 1993-04-22 | 1994-11-15 | The United States Of America As Represented By The Secretary Of The Air Force | Method and system for measuring management effectiveness |
| US5812988A (en) | 1993-12-06 | 1998-09-22 | Investments Analytic, Inc. | Method and system for jointly estimating cash flows, simulated returns, risk measures and present values for a plurality of assets |
| US5502637A (en) | 1994-06-15 | 1996-03-26 | Thomson Shared Services, Inc. | Investment research delivery system |
| US5761442A (en) | 1994-08-31 | 1998-06-02 | Advanced Investment Technology, Inc. | Predictive neural network means and method for selecting a portfolio of securities wherein each network has been trained using data relating to a corresponding security |
| US5749077A (en) | 1994-11-28 | 1998-05-05 | Fs Holdings, Inc. | Method and apparatus for updating and selectively accessing financial records related to investments |
| US5893079A (en) | 1994-12-13 | 1999-04-06 | Fs Holdings, Inc. | System for receiving, processing, creating, storing, and disseminating investment information |
| US6012042A (en) | 1995-08-16 | 2000-01-04 | Window On Wallstreet Inc | Security analysis system |
| US5774881A (en) | 1995-10-30 | 1998-06-30 | Efi Actuaries | Method of determining optimal asset allocation utilizing asset cash flow simulation |
| US5948054A (en) | 1996-02-27 | 1999-09-07 | Sun Microsystems, Inc. | Method and system for facilitating the exchange of information between human users in a networked computer system |
| US5963922A (en) | 1996-02-29 | 1999-10-05 | Helmering; Paul F. | System for graphically mapping related elements of a plurality of transactions |
| US5950176A (en) | 1996-03-25 | 1999-09-07 | Hsx, Inc. | Computer-implemented securities trading system with a virtual specialist function |
| US5909669A (en) | 1996-04-01 | 1999-06-01 | Electronic Data Systems Corporation | System and method for generating a knowledge worker productivity assessment |
| US5946666A (en) | 1996-05-21 | 1999-08-31 | Albert Einstein Healthcare Network | Monitoring device for financial securities |
| US5802518A (en) | 1996-06-04 | 1998-09-01 | Multex Systems, Inc. | Information delivery system and method |
| US5864871A (en) | 1996-06-04 | 1999-01-26 | Multex Systems | Information delivery system and method including on-line entitlements |
| US5819271A (en) | 1996-06-04 | 1998-10-06 | Multex Systems, Inc. | Corporate information communication and delivery system and method including entitlable hypertext links |
| US6012043A (en) | 1996-09-09 | 2000-01-04 | Nationwide Mutual Insurance Co. | Computerized system and method used in financial planning |
| US6119103A (en) * | 1997-05-27 | 2000-09-12 | Visa International Service Association | Financial risk prediction systems and methods therefor |
| US6154732A (en) | 1997-07-25 | 2000-11-28 | Guidedchoice.Com | System for providing investment advice and management of pension assets |
| US6064986A (en) | 1997-09-23 | 2000-05-16 | Edelman Financial Services, Inc. | Computer assisted and/or implemented process and architecture for customer account creation, maintenance and administration for an investment and/or retirement program |
| US6021397A (en) | 1997-12-02 | 2000-02-01 | Financial Engines, Inc. | Financial advisory system |
| US6125355A (en) | 1997-12-02 | 2000-09-26 | Financial Engines, Inc. | Pricing module for financial advisory system |
| US5918217A (en) | 1997-12-10 | 1999-06-29 | Financial Engines, Inc. | User interface for a financial advisory system |
| US6236980B1 (en) | 1998-04-09 | 2001-05-22 | John P Reese | Magazine, online, and broadcast summary recommendation reporting system to aid in decision making |
| JP2000090150A (en) * | 1998-09-10 | 2000-03-31 | Cwl:Kk | Stock price estimation method and device using trend line |
Non-Patent Citations (81)
| Title |
|---|
| "A Journal of Accounting, Finance and Business Studies" vol. 30, No. 1 Mar. 1994. |
| "Do Stock Prices Fully reflect the Implications of Current Earnings for Future Earnings for AR1 Firms" Brown et al. 2000. |
| "Enhancing Earnings Predictability Using Individual Analyst Forecasts", Herzberg et al. Summer 1999. |
| "Predicting Individual Analyst Earnings Forecast Accuracy", Brown et al. Sep. 29, 1999. |
| "Profiling From Predicting Earnings Surprise", Brown et al. 1998. |
| "The Information Content of Analyst Stock Recommendations" Kirsche et al. Aug. 8, 2000. |
| Accounting Horizon, vol. 13, No. 4 Dec. 1999. |
| Accounting Horizons, vol. 10, No. 3 Sep. 1996. |
| Accounting Horizons, vol. 10, No. 4, Dec. 1996. |
| Accounting Horizons, vol. 11, No. 4 Dec. 1997. |
| Accounting Organizations and Society, vol. 21, No. 7/8 Oct./Nov. 1996. |
| Brown et al. Composite Analyst Earnings Forecasts: The Next Generation. Journal of Business Forecasting. Summer of 1990. vol. 9 Issue 2. |
| Brown, Lawrence, Composite ananlyst earnings forecasts: The next generation. Journal of business forecasting v9n2 pp: 11-15, Jun. 1990.* * |
| CA Magazine Apr. 1996. |
| Charles Schwab: Schwab introduces analytics fund; utilizes quantitative techniques to seek above-market returns, Business Editors, May 1996.* * |
| Contemporary Accounting Research vol. 8, No. 1 Fall 1991. |
| Financial Analyst Journal/Jan. -Feb. 1996 "Analyst Forecasting Errors and their Implications for Security Analysis: An Alternative Perspective". |
| Financial Analysts Journal Mar. Apr. 1997. |
| Financial Analysts Journal Nov./Dec. 1997. |
| Financial Analysts Journal, Jan./Feb. 1996. |
| Financial Analysts Journal, Mar./Apr. 1997 "Earnings Suerprise Research: Synthesis and Perspectives" Brown. |
| Financial Analysts Journal, vol. 55, No. 5 Sep./Oct. 1999. |
| Herzberg et al. Enhancing Earnings Predictability Using Individual Analyst Forecasts. The Journal of Investing. Summer 1999. |
| Ho et al. Market Reactions to Messages From Brokerage Ratings Systems. Financial Analysts Journal. Feb. 1998 vol. 54, Issue 1. |
| http//my.zacks.com/?ALERT+www.zacks.com (printed Feb. 2, 2001). |
| http://interactive.wsj.com/public/current/articles/SB963944657420928118.htm (Jan. 5, 2001). |
| http://interactive.wsj.com/public/current/articles/SB963945297966625438.htm (Jan. 5, 2001). |
| http://interactive.wsj.com/public/current/articles/SB963945478117361937.htm (Jan. 5, 2001). |
| http://interactive.wsj.com/public/current/articles/SB963945615772798263.htm (Jan 5, 2001). |
| http://interactive.wsj.com/public/current/articles/SB963945742428637569.htm (Jan. 5, 2001). |
| http://interactive.wsj.com/public/current/summaries/best00.htm (Jan. 5, 2001). |
| http://www.factset.com (printed Feb. 5, 2001). |
| http://www.findarticles.com/m4PRN/1999- Oct-14/56284107/p1/article.jhtml (printed Feb. 5, 2001). |
| http://www.validea.com/home/home.asp (printed Feb. 5, 2001). |
| http://www/cianet.com (printed Feb. 5, 2001). |
| http:www.bulldogresearch.com/default.asp (printed Feb.5, 2001). |
| http:www.iexchange.com (printed Feb. 5, 2001). |
| https://www.invesars.com/home.asp (printed Mar. 26, 2001). |
| I/B/E/S International Inc., Active Express. |
| International Journal of Forecasting vol. 7, No. 3 (1991) pp. 257-408. |
| International Journal of Forecasting, vol. 11, No. 3 (1995) pp. 361-500. |
| International Journal of Forecasting, vol. 12, No. 1 (1996) pp. 1-192. |
| International Journal of Forecasting, vol. 9, No. 3 (1993) pp. 295-436. |
| International Search Report. |
| Journal of Accounting & Economics vol. 9 1987 (MSG. V. 9 No.3). |
| Journal of Accounting & Economics vol. 9, No. 2 Jul. 1987. |
| Journal of Accounting & Economics, vol. 15, No. 2/3 Jun./Sep. 1992. |
| Journal of Accounting and Economics vol. 25, No. 3 Jun. 1998. |
| Journal of Accounting Auditing & Finance vol. 9, No. 4 (new series) Fall 1994. |
| Journal of Accounting Research Col. 29, No. 2 1991. |
| Journal of Accounting Research vol. 17, No. 1 Spring 1979. |
| Journal of Accounting Research vol. 17, No. 2 Autumn 1979. |
| Journal of Accounting Research vol. 23, No. 1 Spring 1985. |
| Journal of Accounting Research vol. 25, No. 1 Spring 1987. |
| Journal of Accounting Research vol. 38, No. 1 Spring 2000. |
| Journal of Accounting Research, vol. 24 Supplement 1986 "Evidence on the Incremental Information Content of Additional Firm Dsisclosures made Concurrently with Earnings" Hoskin et al. |
| Journal of Business Finance & Accounting, vol. 19, No. 4 Jun. 1992. |
| Journal of Forecasting, vol. 2 325-330 1983) "Perspective on Forecasting Research in Accounting and Finance". |
| LaMonica et al. The Best and Worst: Bloomerberg's Second Annual Analysts Survey, and the Top Analysts Top Picks. Financial World 30 Jan. 1996. vol. 165. Issue 2. |
| LaMonica Paul, The best and the worst: Bloomberg's second annual analysts survey, and the top analysts top picks, Financial world v165n2 pp: 38-42, Jun. 1990.* * |
| Mozes et al. Modeling Earnings Expectations Based on Clusters of Analyst Forecasts. The Journal of Investing Spring 1999. |
| The Accounting Review Quarterly Journal of the American Accounting Association vol. LX Apr. 1985 No. 2. |
| The Accounting Review vol. 67, No. 4 Oct. 1992. |
| The Accounting Review, vol. 68, No. 3, Jul. 1993. |
| The CPA Journal May 1995. |
| The Journal of Canadian Academic Accounting Association, vol. 14, No. 1, Spring 1997. |
| The Journal of Canadian Academic Accounting Association, vol. 16, No. 1, Spring 1999. |
| The Journal of Finance vol. 46, No. 2 Jun. 1991. |
| The Journal of Finance, vol. 46, No. 1 Mar. 1991. |
| The Journal of Finance, vol. 55, No. 5 Oct. 2000. |
| The Journal of Finance, vol. LIV, No. 5 Oct. 1999, "What os the Intrinsic value of the Dow", Lee et al. |
| The Journal of Finance, vol. XLIX, No. 3 Jul. 1993 Market Integration and Prive Execution for NYSE-Listed Securities. |
| The Journal of Finance, vol. XLVIII, No. 2 Jun. 1993 "Summing Up". |
| The Journal of Finance, vol. XLVIII, No. 2 Jun. 1993 "Yes, Discounts on Closed-End Funds are a Sentiment Index". |
| The Journal of Finance, vol. XXXIII, Mar. 1978, No. 1. |
| The Journal of Portfolio Management "Analysts can Forecast Accuragely" Brown et al. |
| The Journal of Portfolio Management vol. 23, No. 4 Summer 1997. |
| The Journal of the Canadian Academic Accounting Association vol. 11, No. 1-1 Summer 1994. |
| The Journal of the Canadian Academic Accounting Association, vol. 14, No. 2 Summer 1997. |
| The Predictive Value of Interim Reports for Improving Forecasts of Future Quarterly Earnings, Apr. 1978. |
| The Review of Financial Studies 1993, vol. 6, No. 2 pp. 345-374 "Spreads, Depths, and the Impact of Earnings Information: An Intraday Analysis". |
Cited By (187)
| Publication number | Priority date | Publication date | Assignee | Title |
|---|---|---|---|---|
| US20020184131A1 (en) * | 1998-04-24 | 2002-12-05 | Gatto Joseph G. | Security analyst estimates performance viewing system and method |
| US7539637B2 (en) | 1998-04-24 | 2009-05-26 | Starmine Corporation | Security analyst estimates performance viewing system and method |
| US6681211B1 (en) | 1998-04-24 | 2004-01-20 | Starmine Corporation | Security analyst estimates performance viewing system and method |
| US20020052820A1 (en) * | 1998-04-24 | 2002-05-02 | Gatto Joseph G. | Security analyst estimates performance viewing system and method |
| US20020002520A1 (en) * | 1998-04-24 | 2002-01-03 | Gatto Joseph G. | Security analyst estimates performance viewing system and method |
| US6983257B2 (en) * | 1998-04-24 | 2006-01-03 | Starmine Corporation | Security analyst performance tracking and analysis system and method |
| US20030065601A1 (en) * | 1998-04-24 | 2003-04-03 | Gatto Joseph G. | Security analyst performance tracking and analysis system and method |
| US7603308B2 (en) | 1998-04-24 | 2009-10-13 | Starmine Corporation | Security analyst estimates performance viewing system and method |
| US20020156714A1 (en) * | 1998-04-24 | 2002-10-24 | Gatto Joseph G. | Security analyst performance tracking and analysis system and method |
| US7149716B2 (en) | 1998-04-24 | 2006-12-12 | Starmine Corporation | Security analyst estimates performance viewing system and method |
| US7167838B1 (en) | 1998-04-24 | 2007-01-23 | Starmine Corporation | Security analyst estimates performance viewing system and method |
| US7478063B2 (en) | 1998-10-16 | 2009-01-13 | Maquis Techtrix Llc | Stock trading application program |
| US20020054111A1 (en) * | 1998-10-16 | 2002-05-09 | Knight Timothy Orr | Interface and program using visual data arrangements for expressing user preferences concerning an action or transaction |
| US7216299B2 (en) * | 1998-10-16 | 2007-05-08 | Maquis Techtrix Llc | Interface and program using visual data arrangements for expressing user preferences concerning an action or transaction |
| US7739621B2 (en) | 1998-10-16 | 2010-06-15 | Timothy Orr Knight | Interface and method adapted for capturing subjective preferences of program users |
| US20090307624A1 (en) * | 1998-10-16 | 2009-12-10 | Maquis Techtrix Llc | Interface and program using visual data arrangements for expressing user preferences concerning an action or transaction |
| US20040012624A1 (en) * | 1998-10-16 | 2004-01-22 | Knight Timothy Orr | Stock trading application program |
| US20020030701A1 (en) * | 1998-10-16 | 2002-03-14 | Knight Timothy Orr | Interface and method adapted for capturing subjective preferences of program users |
| US6839686B1 (en) * | 1999-03-29 | 2005-01-04 | Dlj Long Term Investment Corporation | Method and system for providing financial information and evaluating securities of a financial debt instrument |
| US7788165B2 (en) * | 1999-06-18 | 2010-08-31 | Thomson Financial Llc | System, method and computer readable medium containing instructions for evaluating and disseminating investor performance information |
| US7546263B2 (en) * | 1999-06-18 | 2009-06-09 | Thomson Holdings Llc | System, method and computer readable medium containing instructions for evaluating and disseminating securities analyst performance information |
| US7788156B2 (en) * | 1999-06-18 | 2010-08-31 | Thomson Financial Llc | System, method and computer readable medium containing instructions for evaluating and disseminating investor performance information |
| US20060161492A1 (en) * | 1999-06-18 | 2006-07-20 | Thomson Financial, Inc. | System, method and computer readable medium containing instructions for evaluating and disseminating investor performance information |
| US20060161493A1 (en) * | 1999-06-18 | 2006-07-20 | Thomson Financial, Inc. | System, method and computer readable medium containing instructions for evaluating and disseminating investor performance information |
| US20020022988A1 (en) * | 1999-06-18 | 2002-02-21 | Columbus Craig E. | System, method and computer readable medium containing instructions for evaluating and disseminating securities analyst performance information |
| US8266025B1 (en) * | 1999-08-09 | 2012-09-11 | Citibank, N.A. | System and method for assuring the integrity of data used to evaluate financial risk or exposure |
| US8635130B1 (en) * | 2000-02-14 | 2014-01-21 | Td Ameritrade Ip Company, Inc. | Method and system for analyzing and screening investment information |
| US8977621B1 (en) | 2000-02-24 | 2015-03-10 | Richard Paiz | Search engine optimizer |
| US9355352B1 (en) | 2000-02-24 | 2016-05-31 | Richard Paiz | Personal search results |
| US7058601B1 (en) * | 2000-02-28 | 2006-06-06 | Paiz Richard S | Continuous optimization and strategy execution computer network system and method |
| US7016873B1 (en) * | 2000-03-02 | 2006-03-21 | Charles Schwab & Co., Inc. | System and method for tax sensitive portfolio optimization |
| US8150752B2 (en) * | 2000-05-08 | 2012-04-03 | James Kemp Smith | Computerized financial information retrieval by dynamic URL construction |
| US20100223203A1 (en) * | 2000-05-08 | 2010-09-02 | James Kemp Smith | Computerized financial information retrieval by dynamic url construction |
| US7747486B1 (en) * | 2000-05-08 | 2010-06-29 | James Kemp Smith | Financial analysis system interface |
| US20080215988A1 (en) * | 2000-06-21 | 2008-09-04 | Ebay Inc. | System and method to process information contributed by members of a virtual community |
| US10810668B2 (en) * | 2000-07-18 | 2020-10-20 | Dcfb Llc | Automated trading system in an electronic trading exchange |
| US20150356682A1 (en) * | 2000-07-18 | 2015-12-10 | Dcfb Llc C/O Intercontinental Exchange, Inc. | Automated trading system in an electronic trading exchange |
| US10832322B2 (en) | 2000-07-18 | 2020-11-10 | Dcfb Llc | Automated trading system in an electronic trading exchange |
| US20020099637A1 (en) * | 2000-07-26 | 2002-07-25 | Wilkinson William T. | Intellectual property investment process |
| US20020089528A1 (en) * | 2000-08-18 | 2002-07-11 | Hay Andrew Charles David | Security apparatus |
| US8225222B2 (en) * | 2000-08-18 | 2012-07-17 | Hewlett-Packard Development Company, L.P. | Security apparatus |
| US7487122B2 (en) * | 2000-12-06 | 2009-02-03 | Lipper Iii Arthur | Dynamic security price and value comparator and indexer |
| US20020123952A1 (en) * | 2000-12-06 | 2002-09-05 | Arthur Lipper | Dynamic security price and value comparator and indexer |
| US20080275825A1 (en) * | 2000-12-15 | 2008-11-06 | Ebay Inc. | Method for implementing a virtual community of investors having investment portfolios |
| US7401039B1 (en) * | 2000-12-15 | 2008-07-15 | Ebay Inc. | Analytical tools for a community of investors having investment portfolios |
| US8401948B2 (en) | 2000-12-15 | 2013-03-19 | Ebay Inc. | Method for implementing a virtual community of investors having investment portfolios |
| US20020178099A1 (en) * | 2001-05-25 | 2002-11-28 | Shayne Young | Methods and systems for managing a portfolio of securities |
| US20020184133A1 (en) * | 2001-05-31 | 2002-12-05 | Zangari Peter J. | Method and system for verifying the integrity of data in a data warehouse and applying warehoused data to a plurality of predefined analysis models |
| US20020188548A1 (en) * | 2001-06-06 | 2002-12-12 | John Bunda | Methods and systems for monitoring securities quotes |
| US20020194111A1 (en) * | 2001-06-19 | 2002-12-19 | Shayne Young | Methods and systems for reconciling a forward conversion securities strategy |
| US20020194110A1 (en) * | 2001-06-19 | 2002-12-19 | Shayne Young | Methods and systems for implementing a forward conversion securities strategy |
| US20030041006A1 (en) * | 2001-08-21 | 2003-02-27 | John Bunda | Methods and systems for suppression of stale or invalid data in a securities quotation display |
| US7636680B2 (en) | 2001-10-03 | 2009-12-22 | Starmine Corporation | Methods and systems for measuring performance of a security analyst |
| US20030065598A1 (en) * | 2001-10-03 | 2003-04-03 | John Bunda | Methods and systems for managing a portfolio of securities |
| US20030065605A1 (en) * | 2001-10-03 | 2003-04-03 | Joseph Gatto | Methods and systems for measuring performance of a security analyst |
| US20030065604A1 (en) * | 2001-10-03 | 2003-04-03 | Joseph Gatto | Methods and systems for measuring performance of a security analyst |
| US20030083974A1 (en) * | 2001-10-26 | 2003-05-01 | John Bunda | Method and system for managing display of quotes for securities from multiple sources |
| US20030105699A1 (en) * | 2001-12-03 | 2003-06-05 | Richard Redpath | Technique for calculating and displaying securities options data to produce a visual pattern of potential future values |
| US11288690B1 (en) | 2001-12-28 | 2022-03-29 | Fannie Mae | Method for determining house price indices |
| US6938044B1 (en) * | 2001-12-28 | 2005-08-30 | Ncr Corporation | Tracking usage of resources of a database system |
| US6876955B1 (en) * | 2001-12-28 | 2005-04-05 | Fannie Mae | Method and apparatus for predicting and reporting a real estate value based on a weighted average of predicted values |
| US7822691B1 (en) | 2001-12-28 | 2010-10-26 | Fannie Mae | Method for determining house prices indices |
| US7305328B1 (en) * | 2001-12-28 | 2007-12-04 | Fannie Mae | Method and apparatus for predicting and reporting a real estate value based on a weighted average of predicted values |
| US7983925B1 (en) | 2001-12-31 | 2011-07-19 | Fannie Mae | Efficient computation method for determining house price indices |
| US7613645B2 (en) * | 2002-10-15 | 2009-11-03 | Timothy Knight | Electronic interface configured for displaying and identifying mixed types of information |
| US20060004584A1 (en) * | 2002-10-15 | 2006-01-05 | Timothy Knight | Electronic interface configured for displaying & identifying mixed types of information |
| US20040088649A1 (en) * | 2002-10-31 | 2004-05-06 | International Business Machines Corporation | System and method for finding the recency of an information aggregate |
| WO2004047082A2 (en) * | 2002-11-14 | 2004-06-03 | Goldman, Sachs & Co. | Independent research consensus earnings estimates and methods of determining such |
| WO2004047082A3 (en) * | 2002-11-14 | 2004-11-18 | Goldman Sachs & Co | Independent research consensus earnings estimates and methods of determining such |
| US7912739B2 (en) | 2002-11-26 | 2011-03-22 | Dominion Ventures, Llc | Method for health plan management |
| US20040103002A1 (en) * | 2002-11-26 | 2004-05-27 | Colley John Lawrence | Method for health plan management |
| US20110131072A1 (en) * | 2002-11-26 | 2011-06-02 | Dominion Ventures, Llc | Method for health plan management |
| US20040111353A1 (en) * | 2002-12-03 | 2004-06-10 | Ellis Robert A. | System and method for managing investment information |
| US8239310B2 (en) | 2003-01-23 | 2012-08-07 | Lortscher Jr Frank Duane | System and method for generating transaction based recommendations |
| US20040153389A1 (en) * | 2003-01-23 | 2004-08-05 | Lortscher Frank Duane | System and method for generating transaction based recommendations |
| US8494946B2 (en) | 2003-01-23 | 2013-07-23 | Frank Duane LORTSCHER, JR. | System and method for generating transaction based recommendations |
| US20100287118A1 (en) * | 2003-01-23 | 2010-11-11 | Lortscher Jr Frank Duane | System and method for generating transaction based recommendations |
| US7720732B2 (en) | 2003-01-23 | 2010-05-18 | Lortscher Jr Frank D | System and method for generating transaction based recommendations |
| US8289330B2 (en) | 2003-03-14 | 2012-10-16 | Spectrum Investment Advisors, Inc. | Colored investment data display system and method |
| US20040179011A1 (en) * | 2003-03-14 | 2004-09-16 | Marshall James F. | Data display method and system |
| US20100067029A1 (en) * | 2003-03-14 | 2010-03-18 | Marshall James F | Colored investment data display system and method |
| US7961190B2 (en) | 2003-03-14 | 2011-06-14 | Marshall James F | Colored investment data display system and method |
| US20040254870A1 (en) * | 2003-06-16 | 2004-12-16 | Chitaley Ani D. | Predicting a future price range for a desired volume |
| US7761388B2 (en) | 2003-06-16 | 2010-07-20 | Fmr Llc | Predicting a future price range for a desired volume |
| WO2005022420A1 (en) * | 2003-08-29 | 2005-03-10 | Medical Technologies Inc. | Method and system for securing information assets and risk managing |
| US20050086242A1 (en) * | 2003-09-04 | 2005-04-21 | Oracle International Corporation | Automatic workload repository battery of performance statistics |
| US7526508B2 (en) | 2003-09-04 | 2009-04-28 | Oracle International Corporation | Self-managing database architecture |
| US20050086246A1 (en) * | 2003-09-04 | 2005-04-21 | Oracle International Corporation | Database performance baselines |
| US7664798B2 (en) | 2003-09-04 | 2010-02-16 | Oracle International Corporation | Database performance baselines |
| US7603340B2 (en) | 2003-09-04 | 2009-10-13 | Oracle International Corporation | Automatic workload repository battery of performance statistics |
| US20050086195A1 (en) * | 2003-09-04 | 2005-04-21 | Leng Leng Tan | Self-managing database architecture |
| US7673291B2 (en) * | 2003-09-05 | 2010-03-02 | Oracle International Corporation | Automatic database diagnostic monitor architecture |
| US20050055673A1 (en) * | 2003-09-05 | 2005-03-10 | Oracle International Corporation | Automatic database diagnostic monitor architecture |
| US20050080695A1 (en) * | 2003-10-09 | 2005-04-14 | Gatto Joseph G. | System and method for facilitating the selection of security analyst research reports |
| US20050091085A1 (en) * | 2003-10-23 | 2005-04-28 | Colley John L. | Method for evaluating the value of group and individual insurance products |
| US20050187855A1 (en) * | 2004-02-20 | 2005-08-25 | Brennan David P. | Method for analyzing trade data |
| US20100093415A1 (en) * | 2004-04-30 | 2010-04-15 | Theodore Kasten | System and method for using draft position information to aid player selection in a fantasy league draft |
| US8099182B1 (en) | 2004-04-30 | 2012-01-17 | Advanced Sports Media, LLC | System and method for facilitating analysis of game simulation of spectator sports leagues |
| US8740683B2 (en) | 2004-04-30 | 2014-06-03 | Advanced Sports Media, LLC | System and method for using draft position information to aid player selection in a fantasy league draft |
| US7618312B1 (en) | 2004-04-30 | 2009-11-17 | Advanced Sports Media, LLC | System and method for using draft position information to aid player selection in a fantasy league draft |
| US7689490B2 (en) * | 2004-05-28 | 2010-03-30 | Morgan Stanley | Matching resources of a securities research department to accounts of the department |
| US8209253B2 (en) * | 2004-05-28 | 2012-06-26 | Morgan Stanley | Matching resources of a securities research department to accounts of the department |
| US20100145757A1 (en) * | 2004-05-28 | 2010-06-10 | Morgan Stanley | Matching resources of a securities research department to accounts of the department |
| US20050267824A1 (en) * | 2004-05-28 | 2005-12-01 | Hurewitz Barry S | Matching resources of a securities research department to accounts of the department |
| US20120265571A1 (en) * | 2004-05-28 | 2012-10-18 | Morgan Stanley | Matching resources of a securities research department to accounts of the department |
| US20050289038A1 (en) * | 2004-06-28 | 2005-12-29 | Alexander Karapetian | Method and system for voting for a future price of an asset |
| US20060010053A1 (en) * | 2004-07-12 | 2006-01-12 | Pension Builders And Consultants | Asset allocation based system for individual investor portfolio selection |
| US8442889B2 (en) | 2004-07-12 | 2013-05-14 | Darrin B. Farrow | Asset allocation based system for individual investor portfolio selection |
| US7672889B2 (en) | 2004-07-15 | 2010-03-02 | Brooks Kent F | System and method for providing customizable investment tools |
| US20060015425A1 (en) * | 2004-07-15 | 2006-01-19 | Brooks Kent F | System and method for providing customizable investment tools |
| US10959090B1 (en) | 2004-08-25 | 2021-03-23 | Richard Paiz | Personal search results |
| US20060059075A1 (en) * | 2004-09-10 | 2006-03-16 | Hurewitz Barry S | Systems and methods for auctioning access to securities research resources |
| US20100257086A1 (en) * | 2004-09-10 | 2010-10-07 | Hurewitz Barry S | Systems and methods for auctioning access to securities research resources |
| US7752103B2 (en) | 2004-09-10 | 2010-07-06 | Morgan Stanley | Systems and methods for auctioning access to securities research resources |
| US7904364B2 (en) * | 2004-09-10 | 2011-03-08 | Morgan Stanley | Systems and methods for auctioning access to securities research resources |
| US7610230B2 (en) | 2004-09-29 | 2009-10-27 | Morgan Stanley | Method and system for evaluating the investment ratings of a securities analyst |
| US20060074785A1 (en) * | 2004-09-29 | 2006-04-06 | Jeffrey Festog | Method and system for evaluating the investment ratings of a securities analyst |
| US7877309B2 (en) | 2004-10-18 | 2011-01-25 | Starmine Corporation | System and method for analyzing analyst recommendations on a single stock basis |
| US8311923B2 (en) | 2004-10-18 | 2012-11-13 | Thomson Reuters (Markets) Llc | System and method for analyzing analyst recommendations on a single stock basis |
| US20060116943A1 (en) * | 2004-11-30 | 2006-06-01 | Pascal Willain | Method to determine price inflections of securities |
| US7783547B1 (en) | 2004-12-10 | 2010-08-24 | HedgeCity Corporation | System and method for determining hedge strategy stock market forecasts |
| US7765125B1 (en) | 2005-01-12 | 2010-07-27 | Fannie Mae | Trunk branch repeated transaction index for property valuation |
| US7831492B1 (en) | 2005-01-12 | 2010-11-09 | Fannie Mae | Multiple transaction property valuation |
| US8738388B1 (en) | 2005-01-12 | 2014-05-27 | Fannie Mae | Market based data cleaning |
| US8214275B1 (en) | 2005-01-12 | 2012-07-03 | Fannie Mae | Multiple transaction property valuation |
| US7813986B2 (en) | 2005-03-25 | 2010-10-12 | The Motley Fool, Llc | System, method, and computer program product for scoring items based on user sentiment and for determining the proficiency of predictors |
| US20060217994A1 (en) * | 2005-03-25 | 2006-09-28 | The Motley Fool, Inc. | Method and system for harnessing collective knowledge |
| US20060218179A1 (en) * | 2005-03-25 | 2006-09-28 | The Motley Fool, Inc. | System, method, and computer program product for scoring items based on user sentiment and for determining the proficiency of predictors |
| US20070011073A1 (en) * | 2005-03-25 | 2007-01-11 | The Motley Fool, Inc. | System, method, and computer program product for scoring items based on user sentiment and for determining the proficiency of predictors |
| US7882006B2 (en) | 2005-03-25 | 2011-02-01 | The Motley Fool, Llc | System, method, and computer program product for scoring items based on user sentiment and for determining the proficiency of predictors |
| US20060229962A1 (en) * | 2005-04-08 | 2006-10-12 | Hiskett Herbert C | Evaluation of securities |
| US7523056B2 (en) * | 2005-04-08 | 2009-04-21 | Herbert Charles Hiskett | Evaluation of securities |
| US7729965B1 (en) | 2005-04-26 | 2010-06-01 | Fannie Mae | Collateral valuation confidence scoring system |
| US8135641B2 (en) | 2005-06-06 | 2012-03-13 | Trading Technologies International, Inc. | System and method for trading multiple tradeable objects using a single trading interface |
| US7925574B2 (en) * | 2005-06-06 | 2011-04-12 | Trading Technologies International, Inc. | System and method for trading multiple tradeable objects using a single trading interface |
| US20100306098A1 (en) * | 2005-06-06 | 2010-12-02 | Trading Technologies International, Inc. | System and method for trading multiple tradeable objects using a single trading interface |
| US8577783B2 (en) | 2005-06-06 | 2013-11-05 | Trading Technologies International, Inc | System and method for trading multiple tradeable objects using a single trading interface |
| US8706612B2 (en) | 2005-06-06 | 2014-04-22 | Trading Technologies International, Inc. | System and method for trading multiple tradeable objects using a single trading interface |
| US20110153487A1 (en) * | 2005-06-06 | 2011-06-23 | Trading Technologies International, Inc. | System and method for trading multiple tradeable objects using a single trading interface |
| US20150012412A1 (en) * | 2005-06-29 | 2015-01-08 | Itg Software Solutions, Inc. | System and method for generating real-time indicators in a trading list or portfolio |
| US20110276464A1 (en) * | 2005-06-29 | 2011-11-10 | Itg Software Solutions, Inc. | System and method for generating real-time indicators in a trading list or portfolio |
| US7930254B1 (en) | 2005-08-05 | 2011-04-19 | Fannie Mae | Property value estimation using feature distance from comparable sales |
| US20070043650A1 (en) * | 2005-08-16 | 2007-02-22 | Hughes John M | Systems and methods for providing investment opportunities |
| US20070043653A1 (en) * | 2005-08-16 | 2007-02-22 | Hughes John M | Systems and methods for providing investment opportunities |
| US7865423B2 (en) | 2005-08-16 | 2011-01-04 | Bridgetech Capital, Inc. | Systems and methods for providing investment opportunities |
| US7953652B1 (en) | 2006-06-12 | 2011-05-31 | Morgan Stanley | Profit model for non-execution services |
| US8370237B1 (en) | 2006-06-12 | 2013-02-05 | Morgan Stanley | Profit model for non-execution services |
| US11281664B1 (en) | 2006-10-20 | 2022-03-22 | Richard Paiz | Search engine optimizer |
| US11468128B1 (en) | 2006-10-20 | 2022-10-11 | Richard Paiz | Search engine optimizer |
| US7752112B2 (en) | 2006-11-09 | 2010-07-06 | Starmine Corporation | System and method for using analyst data to identify peer securities |
| US20080154827A1 (en) * | 2006-12-20 | 2008-06-26 | Connors Laurence A | Method of comparing actual and user predicted changes in data |
| US8635148B2 (en) | 2007-03-09 | 2014-01-21 | Uat, Inc. | System and method for exchanging institutional research and trade order execution services |
| US8078522B1 (en) | 2007-03-09 | 2011-12-13 | Uat, Inc. | System and method for exchanging institutional research and trade order execution services |
| US8396786B2 (en) | 2007-03-09 | 2013-03-12 | Uat, Inc. | System and method for exchanging institutional research and trade order execution services |
| US20090106756A1 (en) * | 2007-10-19 | 2009-04-23 | Oracle International Corporation | Automatic Workload Repository Performance Baselines |
| US8990811B2 (en) | 2007-10-19 | 2015-03-24 | Oracle International Corporation | Future-based performance baselines |
| US9710353B2 (en) | 2007-10-19 | 2017-07-18 | Oracle International Corporation | Creating composite baselines based on a plurality of different baselines |
| US20090186689A1 (en) * | 2008-01-21 | 2009-07-23 | Hughes John M | Systems and methods for providing investment opportunities |
| US20090192812A1 (en) * | 2008-01-28 | 2009-07-30 | Hurowitz Glenn C | Wall Street Rating System, Method, and Apparatus |
| US7979380B2 (en) | 2008-02-22 | 2011-07-12 | Applied Materials, Inc. | Dynamically updated predictive model |
| US20090217183A1 (en) * | 2008-02-22 | 2009-08-27 | James Moyne | User interface with visualization of real and virtual data |
| US20090216348A1 (en) * | 2008-02-22 | 2009-08-27 | James Moyne | Dynamically updated predictive model |
| US8612864B2 (en) | 2008-02-22 | 2013-12-17 | Applied Materials, Inc. | User interface with visualization of real and virtual data |
| WO2009105704A1 (en) * | 2008-02-22 | 2009-08-27 | Applied Materials, Inc. | User interface with visualization of real and virtual data |
| US11048765B1 (en) | 2008-06-25 | 2021-06-29 | Richard Paiz | Search engine optimizer |
| US11675841B1 (en) | 2008-06-25 | 2023-06-13 | Richard Paiz | Search engine optimizer |
| US11941058B1 (en) | 2008-06-25 | 2024-03-26 | Richard Paiz | Search engine optimizer |
| US20110135557A1 (en) * | 2009-12-04 | 2011-06-09 | Vishwanathan Rangarajan | Hardmask materials |
| US11379473B1 (en) | 2010-04-21 | 2022-07-05 | Richard Paiz | Site rank codex search patterns |
| US11423018B1 (en) | 2010-04-21 | 2022-08-23 | Richard Paiz | Multivariate analysis replica intelligent ambience evolving system |
| US10936687B1 (en) | 2010-04-21 | 2021-03-02 | Richard Paiz | Codex search patterns virtual maestro |
| US10922363B1 (en) | 2010-04-21 | 2021-02-16 | Richard Paiz | Codex search patterns |
| US10915523B1 (en) | 2010-05-12 | 2021-02-09 | Richard Paiz | Codex search patterns |
| US9881257B2 (en) * | 2010-12-29 | 2018-01-30 | Tickr, Inc. | Multi-dimensional visualization of temporal information |
| US20120173985A1 (en) * | 2010-12-29 | 2012-07-05 | Tyler Peppel | Multi-dimensional visualization of temporal information |
| US20120254063A1 (en) * | 2011-04-04 | 2012-10-04 | Investlab Technology Limited | Researching exchange-listed products using sentiment |
| US8463688B2 (en) * | 2011-04-04 | 2013-06-11 | Investlab Technology Limited | Researching exchange-listed products using sentiment |
| US20120317053A1 (en) * | 2011-06-10 | 2012-12-13 | Benchmark Solutions Holdings, Inc. | Fixed income securities market data display |
| US8566146B1 (en) * | 2012-05-10 | 2013-10-22 | Morgan Stanley & Co. Llc | Computer-based systems and method for computing a score for contacts of a financial services firm indicative of resources to be deployed by the financial services firm for the contacts to maximize revenue for the financial services firm |
| US11741090B1 (en) | 2013-02-26 | 2023-08-29 | Richard Paiz | Site rank codex search patterns |
| US11809506B1 (en) | 2013-02-26 | 2023-11-07 | Richard Paiz | Multivariant analyzing replicating intelligent ambience evolving system |
| US10860557B2 (en) * | 2013-03-13 | 2020-12-08 | Salesforce.Com, Inc. | Systems, methods, and apparatuses for implementing change value indication and historical value comparison |
| US20140278755A1 (en) * | 2013-03-13 | 2014-09-18 | Salesforce.Com, Inc. | Systems, methods, and apparatuses for implementing change value indication and historical value comparison |
| US20140279367A1 (en) * | 2013-03-15 | 2014-09-18 | Integral Development Inc. | Method and System for Calculating and Utilizing Realized Spread in Financial Transactions |
| USD872757S1 (en) * | 2013-12-13 | 2020-01-14 | Kbc Advanced Technologies Limited | Display screen with graphical user interface with timeline |
| USD872756S1 (en) | 2013-12-13 | 2020-01-14 | Kbc Advanced Technologies Limited | Display screen with graphical user interface for workflow |
| USD820288S1 (en) * | 2013-12-13 | 2018-06-12 | Kbc Advanced Technologies Plc | Display screen with graphical user interface |
Also Published As
| Publication number | Publication date |
|---|---|
| WO1999056192A9 (en) | 2000-02-24 |
| WO1999056192A3 (en) | 2000-08-03 |
| WO1999056192A2 (en) | 1999-11-04 |
| US6983257B2 (en) | 2006-01-03 |
| US20020156714A1 (en) | 2002-10-24 |
| US20030065601A1 (en) | 2003-04-03 |
| AU3966099A (en) | 1999-11-16 |
Similar Documents
| Publication | Publication Date | Title |
|---|---|---|
| US6510419B1 (en) | Security analyst performance tracking and analysis system and method | |
| US7167838B1 (en) | Security analyst estimates performance viewing system and method | |
| US7509277B1 (en) | Security analyst estimates performance viewing system and method | |
| US7539637B2 (en) | Security analyst estimates performance viewing system and method | |
| US7603308B2 (en) | Security analyst estimates performance viewing system and method | |
| US6453303B1 (en) | Automated analysis for financial assets | |
| US20020004774A1 (en) | Data analysis system for tracking financial trader history and profiling trading behavior | |
| US8185469B2 (en) | Computer-based method for teaming research analysts to generate improved securities investment recommendations | |
| US7636680B2 (en) | Methods and systems for measuring performance of a security analyst | |
| US20180260823A1 (en) | Searching and processing a data set of objects | |
| US20030172014A1 (en) | System and method for online valuation and analysis | |
| US8311923B2 (en) | System and method for analyzing analyst recommendations on a single stock basis | |
| US20020184134A1 (en) | Methods for trade decision making | |
| US20020116310A1 (en) | Computerized comparative investment analysis system and method | |
| US20100169237A1 (en) | Investment classification and tracking system using diamond ratings | |
| US20030065604A1 (en) | Methods and systems for measuring performance of a security analyst | |
| US20020046145A1 (en) | Method and system for analyzing performance of an investment portfolio together with associated risk | |
| US20020123952A1 (en) | Dynamic security price and value comparator and indexer | |
| WO2008034098A2 (en) | Investment classification and tracking system | |
| CA2521927A1 (en) | A factor risk model based system, method, and computer program product for generating risk forecasts | |
| US8595123B1 (en) | Option search criteria testing | |
| US20130311400A1 (en) | System for real time continuous data processing for investment portfolios | |
| CN112700149A (en) | Investment portfolio risk assessment system, method and computer equipment | |
| US20040220868A1 (en) | Financial information display system | |
| US20030105695A1 (en) | Processing system for market efficiency value added |
Legal Events
| Date | Code | Title | Description |
|---|---|---|---|
| AS | Assignment |
Owner name: STARMINE CORPORATION, CALIFORNIA Free format text: ASSIGNMENT OF ASSIGNORS INTEREST;ASSIGNOR:GATTO, JOSEPH G.;REEL/FRAME:010087/0694 Effective date: 19990706 |
|
| STCF | Information on status: patent grant |
Free format text: PATENTED CASE |
|
| FPAY | Fee payment |
Year of fee payment: 4 |
|
| FEPP | Fee payment procedure |
Free format text: PAYOR NUMBER ASSIGNED (ORIGINAL EVENT CODE: ASPN); ENTITY STATUS OF PATENT OWNER: LARGE ENTITY Free format text: PAYER NUMBER DE-ASSIGNED (ORIGINAL EVENT CODE: RMPN); ENTITY STATUS OF PATENT OWNER: LARGE ENTITY |
|
| FPAY | Fee payment |
Year of fee payment: 8 |
|
| FEPP | Fee payment procedure |
Free format text: PAYOR NUMBER ASSIGNED (ORIGINAL EVENT CODE: ASPN); ENTITY STATUS OF PATENT OWNER: LARGE ENTITY Free format text: PAYER NUMBER DE-ASSIGNED (ORIGINAL EVENT CODE: RMPN); ENTITY STATUS OF PATENT OWNER: LARGE ENTITY |
|
| FPAY | Fee payment |
Year of fee payment: 12 |
|
| AS | Assignment |
Owner name: THOMSON FINANCIAL LLC, DELAWARE Free format text: MERGER;ASSIGNOR:STARMINE CORPORATION;REEL/FRAME:035032/0597 Effective date: 20081231 |
|
| AS | Assignment |
Owner name: THOMSON REUTERS (MARKETS) LLC, NEW YORK Free format text: CHANGE OF NAME;ASSIGNOR:THOMSON FINANCIAL LLC;REEL/FRAME:035888/0152 Effective date: 20090313 |
|
| AS | Assignment |
Owner name: THOMSON REUTERS GLOBAL RESOURCES, SWITZERLAND Free format text: ASSIGNMENT OF ASSIGNORS INTEREST;ASSIGNOR:THOMSON REUTERS (MARKETS) LLC;REEL/FRAME:035912/0430 Effective date: 20150625 |
|
| AS | Assignment |
Owner name: THOMSON REUTERS GLOBAL RESOURCES, SWITZERLAND Free format text: ASSIGNMENT OF ASSIGNORS INTEREST;ASSIGNOR:THOMSON REUTERS (MARKETS) LLC;REEL/FRAME:035924/0601 Effective date: 20150625 Owner name: THOMSON REUTERS GLOBAL RESOURCES, SWITZERLAND Free format text: ASSIGNMENT OF ASSIGNORS INTEREST;ASSIGNOR:THOMSON REUTERS (MARKETS) LLC;REEL/FRAME:035924/0916 Effective date: 20150625 |
|
| AS | Assignment |
Owner name: THOMSON REUTERS GLOBAL RESOURCES UNLIMITED COMPANY Free format text: CHANGE OF NAME;ASSIGNOR:THOMSON REUTERS GLOBAL RESOURCES;REEL/FRAME:044298/0780 Effective date: 20161121 |
|
| AS | Assignment |
Owner name: BANK OF AMERICA, N.A., AS COLLATERAL AGENT, NORTH CAROLINA Free format text: SECURITY AGREEMENT;ASSIGNOR:THOMSON REUTERS (GRC) INC.;REEL/FRAME:047185/0215 Effective date: 20181001 Owner name: BANK OF AMERICA, N.A., AS COLLATERAL AGENT, NORTH Free format text: SECURITY AGREEMENT;ASSIGNOR:THOMSON REUTERS (GRC) INC.;REEL/FRAME:047185/0215 Effective date: 20181001 |
|
| AS | Assignment |
Owner name: DEUTSCHE BANK AG NEW YORK BRANCH, AS COLLATERAL AGENT, NEW YORK Free format text: SECURITY AGREEMENT;ASSIGNOR:THOMSON REUTERS (GRC) INC.;REEL/FRAME:047187/0316 Effective date: 20181001 Owner name: DEUTSCHE BANK AG NEW YORK BRANCH, AS COLLATERAL AG Free format text: SECURITY AGREEMENT;ASSIGNOR:THOMSON REUTERS (GRC) INC.;REEL/FRAME:047187/0316 Effective date: 20181001 |
|
| AS | Assignment |
Owner name: THOMSON REUTERS (GRC) INC., NEW YORK Free format text: ASSIGNMENT OF ASSIGNORS INTEREST;ASSIGNOR:THOMSON REUTERS GLOBAL RESOURCES UNLIMITED COMPANY;REEL/FRAME:047778/0235 Effective date: 20181126 |
|
| AS | Assignment |
Owner name: THOMSON REUTERS (GRC) LLC, NEW YORK Free format text: CHANGE OF NAME;ASSIGNOR:THOMSON REUTERS (GRC) INC.;REEL/FRAME:047964/0065 Effective date: 20181201 |
|
| AS | Assignment |
Owner name: REFINITIV US ORGANIZATION LLC, NEW YORK Free format text: CHANGE OF NAME;ASSIGNOR:THOMSON REUTERS (GRC) LLC;REEL/FRAME:048645/0687 Effective date: 20190228 |
|
| AS | Assignment |
Owner name: REFINITIV US ORGANIZATION LLC (F/K/A THOMSON REUTERS (GRC) INC.), NEW YORK Free format text: RELEASE BY SECURED PARTY;ASSIGNOR:BANK OF AMERICA, N.A., AS COLLATERAL AGENT;REEL/FRAME:055174/0836 Effective date: 20210129 Owner name: REFINITIV US ORGANIZATION LLC (F/K/A THOMSON REUTERS (GRC) INC.), NEW YORK Free format text: RELEASE BY SECURED PARTY;ASSIGNOR:DEUTSCHE BANK TRUST COMPANY AMERICAS, AS NOTES COLLATERAL AGENT;REEL/FRAME:055174/0811 Effective date: 20210129 |