US6681211B1 - Security analyst estimates performance viewing system and method - Google Patents
Security analyst estimates performance viewing system and method Download PDFInfo
- Publication number
- US6681211B1 US6681211B1 US09/577,317 US57731700A US6681211B1 US 6681211 B1 US6681211 B1 US 6681211B1 US 57731700 A US57731700 A US 57731700A US 6681211 B1 US6681211 B1 US 6681211B1
- Authority
- US
- United States
- Prior art keywords
- user
- analyst
- user interface
- estimates
- graphical user
- Prior art date
- Legal status (The legal status is an assumption and is not a legal conclusion. Google has not performed a legal analysis and makes no representation as to the accuracy of the status listed.)
- Expired - Lifetime
Links
Images


Classifications
-
- G—PHYSICS
- G06—COMPUTING; CALCULATING OR COUNTING
- G06Q—INFORMATION AND COMMUNICATION TECHNOLOGY [ICT] SPECIALLY ADAPTED FOR ADMINISTRATIVE, COMMERCIAL, FINANCIAL, MANAGERIAL OR SUPERVISORY PURPOSES; SYSTEMS OR METHODS SPECIALLY ADAPTED FOR ADMINISTRATIVE, COMMERCIAL, FINANCIAL, MANAGERIAL OR SUPERVISORY PURPOSES, NOT OTHERWISE PROVIDED FOR
- G06Q40/00—Finance; Insurance; Tax strategies; Processing of corporate or income taxes
- G06Q40/02—Banking, e.g. interest calculation or account maintenance
-
- G—PHYSICS
- G06—COMPUTING; CALCULATING OR COUNTING
- G06Q—INFORMATION AND COMMUNICATION TECHNOLOGY [ICT] SPECIALLY ADAPTED FOR ADMINISTRATIVE, COMMERCIAL, FINANCIAL, MANAGERIAL OR SUPERVISORY PURPOSES; SYSTEMS OR METHODS SPECIALLY ADAPTED FOR ADMINISTRATIVE, COMMERCIAL, FINANCIAL, MANAGERIAL OR SUPERVISORY PURPOSES, NOT OTHERWISE PROVIDED FOR
- G06Q40/00—Finance; Insurance; Tax strategies; Processing of corporate or income taxes
- G06Q40/04—Trading; Exchange, e.g. stocks, commodities, derivatives or currency exchange
-
- G—PHYSICS
- G06—COMPUTING; CALCULATING OR COUNTING
- G06Q—INFORMATION AND COMMUNICATION TECHNOLOGY [ICT] SPECIALLY ADAPTED FOR ADMINISTRATIVE, COMMERCIAL, FINANCIAL, MANAGERIAL OR SUPERVISORY PURPOSES; SYSTEMS OR METHODS SPECIALLY ADAPTED FOR ADMINISTRATIVE, COMMERCIAL, FINANCIAL, MANAGERIAL OR SUPERVISORY PURPOSES, NOT OTHERWISE PROVIDED FOR
- G06Q40/00—Finance; Insurance; Tax strategies; Processing of corporate or income taxes
- G06Q40/06—Asset management; Financial planning or analysis
Definitions
- the invention relates to a system and method for managing and viewing historical data including security analysts' predictions (e.g., earnings estimates and buy/sell recommendations) and actual reported data; for measuring, analyzing, and tracking the historical performance of security analysts' predictions; and creating, managing, backtesting, and using models that use such historical and performance data, attributes and other information to automatically produce better predictors of future events (e.g., corporate earnings or stock-price performance).
- security analysts' predictions e.g., earnings estimates and buy/sell recommendations
- actual reported data for measuring, analyzing, and tracking the historical performance of security analysts' predictions
- creating, managing, backtesting, and using models that use such historical and performance data, attributes and other information to automatically produce better predictors of future events e.g., corporate earnings or stock-price performance.
- Such individuals may include, for example, security analysts.
- the role of the security analyst is generally well-known and includes, among other things, issuing earnings estimates for securities, other financial estimates concerning future economic events (e.g., revenue), recommendations on whether investors should buy, sell, or hold financial instruments, such as equity securities, and other predictions.
- Security analyst estimates may include, but are not limited to, quarterly and annual earnings estimates for companies whether or not they are traded on a public securities exchange.
- FISPs financial information services providers
- At least some FISPs report the high, low, and mean (or consensus) earnings estimates, as well as mean recommendations for equity securities (as translated to a FISP's particular scale, for example, one to five).
- FISPs may also provide information on what the earnings estimates and recommendations were seven and thirty days prior to the most current consensus, as well as the differences between the consensus for a single equity security and that of the relevant industry.
- FISPs provide earnings estimates and recommendations on an analyst-by-analyst basis.
- prior approaches include a software program that displays all current estimates. For a particular fiscal period, for a particular security, the software provides the ability to simply “include” or “exclude” each estimate or recommendation from the mean. This is problematic for several reasons.
- commercially available databases of estimates and recommendations contain “current” data on thousands of stocks. Each stock may have estimates from 1 to 70 or more analysts. In addition, each analyst may provide estimates for one or more periods. The data may be updated throughout the day. Manually dealing with this volume of information may be time consuming and tedious.
- a second drawback is that with current techniques, if an individual were inclined to determine which estimates (or recommendations) should get more weight, and which estimates should get less or no weight, the large volume of analysts makes it extremely difficult to determine which analysts provide more useful information than others. Current techniques lack sufficient ability to intelligently measure historical analyst performance and beneficially use such measurements.
- a fourth drawback with current techniques is that there are limited tools for easily and effectively analyzing historical estimates and recommendations. While the data is available, often times unique code is written to conduct a specific analysis. Changing the analysis often requires rewriting code.
- An object of the invention is to overcome these and other drawbacks with existing systems and methods.
- Another object of the invention is to provide an improved computer implemented system and methods for use with a database of historical data relating to security analyst earnings estimate or other predictions.
- Another object of the invention is to include within such a system and methods, a history view module to enable users to view the historical data for a given security either: i) as a time series of earnings estimates and revisions for each analyst selected, for a selected period of time, for a selected earnings event; or ii) in a “snapshot” view with calculated metrics as of a given date.
- Another object of the invention is to provide a computer implemented system and methods to enable a user to custom define a model that can be applied to current estimates from a plurality of selected sources to generate an enhanced composite estimate, and to enable a user to manage, backtest and view results of such models.
- Another object of the invention is to provide a computer implemented system and methods that enable a user to view, measure and analyze the past performance for a particular contributor (e.g., a broker, an analyst or a broker/analyst pair), or for a given security the various contributors that have qualifying estimates. Other views may also be available.
- a particular contributor e.g., a broker, an analyst or a broker/analyst pair
- Other views may also be available.
- the invention uses a modular design, including one or more of the following modules: Contributors, Stocks, Models, History, and Performance. Other modules may also be used.
- Contributors module the user may select an analyst, broker, security, and other categories and view relationships therebetween.
- Stocks module the user may define stock filters and group stocks into stock sets. The stock sets may be used, for example, to facilitate testing and use of user-defined models, and for other purposes.
- Models module the user may create, manage and edit models, backtest the models against the historical database, view results of the backtest and perform other functions.
- History module historical estimate and actual data may be viewed in chart or in grid format.
- a chart view may display estimates and actual data graphically and allow for visually backtesting models and analyst performance.
- the snapshot view displays detailed data in tabular format for a selected “As Of Date.”
- Other historical data and formats may also be used.
- the Performance module the user may create and display metrics for analyzing analyst performance, analyst and/or broker accuracy reports, aggregated by analyst, broker, ticker, any combination thereof, or in other aggregations. In each of the above identified modules, other options may be available to the user.
- a software tool and methods are provided (e.g., a graphical user interface (GUI)) to enable a user to easily view historical data relating to earnings estimates (and other information) from a plurality of sources (e.g., analysts).
- the historical data is stored in a database and is commercially available from one or more vendors such as First Call, IBES, etc.
- the invention also calculates and selectively displays daily summary-level statistics such as Calculated Low, Calculated Mean, Calculated High, and Number of Analysts.
- the software tool preferably includes a graphical user interface that enables the historical data to be presented in the form of a chart, a graph, or other format.
- the graphical view preferably comprises a time series view (e.g., estimate values on the y-axis, time on the x-axis) of each or selected analyst's estimates and revisions for a selected security, and earnings event over a selected period. Other information may be simultaneously displayed, such as actual reported earnings.
- Sources of estimates may include analysts, brokers, analyst broker pairs and other sources.
- the software may also treat the high estimate, low estimate, consensus estimate, enhanced composite estimates (detailed below) and other calculated or derived values as sources, and enable a user to selectively show each as a time series display.
- a user control portion of the GUI enables a user to selectively cause the display to show or hide the time series for any one or more or all sources, by selecting and deselecting individual sources, or through a select all or deselect all feature. Other features and options may also be available to the user.
- the user may simultaneously view a time series of earnings estimates and revisions for one or more selected sources for a selected security, for a selected earnings events.
- a stock price time series may be juxtaposed with or overlaid on the selected sources time series. This is particularly useful to see if there is a correlation between one or more analysts' estimates or revisions thereto, and stock price movement.
- As-of Date Another feature of the display is a user selected “As-of Date” which may be displayed as a vertical bar, for example.
- the user may view historical data as of a user selected date and simultaneously display summary estimate data and other information as of that date.
- Summary estimate data may comprise, for example, data derived from a distribution of estimates and enhanced composite estimates.
- the user may select the snapshot view to view detailed information for each activated analyst as of the selected date.
- Another aspect of the invention enables individuals to create models that give more weight to analyst predictions that are more likely to be accurate and less weight to those less likely to be accurate.
- the present invention produces earning estimates that may more accurately predict earnings than a consensus estimate (or other estimate), depending on the accuracy of the model created.
- the present invention enables the user to develop, test and refine models by comparing the estimates of the models with the historical estimate data.
- a Model module enables users to create, backtest, and manage a model. Other functions are also available.
- the model may comprise user defined rules that are applied to selected data for a plurality of contributors to create an enhanced composite prediction.
- the user may specify certain rules or factors by which to exclude one or more data items, contributors, or other criteria.
- the user may assign weights to various factors involved in contributors' predictions to obtain an enhanced composite.
- a user may create a model by identifying various factors to be taken into account in the model. For each factor, a user specifies rules by which each non-excluded analyst is assigned an N-score (normalized) according to the rules. Such factors may include, for example, accuracy, All Star (or other) rating, broker list, experience, estimate age, and other factors. Each factor is assigned a weight to enable a user to place greater emphasis on one or more factors for a given model. For each model, the analyst's N-score for each factor is multiplied by the factor weight and those weighted N-scores are summed for each analyst. The actual emphasis placed on an analyst's current estimate is determined by taking the sum of the analyst's weighted factor scores divided by the sum of the weighted factor scores for all analysts.
- exclusion factors may include excluding estimates that are older than a particular number of days and estimates that are more than a user specified number of standard deviations from the mean.
- an exclusion may be specified for estimates older than a user-specified amount of time before or after a company's last earnings report date. Exclusion factors can exclude an entire group or class of estimates from being considered, such as all estimates that are older than 100 days.
- the present invention enables the user to view, in a single display screen, current analyst data commingled with analyst performance data and attributes, values and elements of models on an analyst-by-analyst basis.
- the snapshot view details analyst estimate data, such as the current estimate, the current estimate date, the age of the estimate in days, the previous estimate, the date of the previous estimate, the change between the two most recent estimate, and other data.
- the user may readily compare the current analyst data for each analyst for a given stock and simultaneously view values and elements that comprise a selected model, such as factors, N-scores, exclusions, weights, and other elements.
- the user may intelligently develop models that more accurately predict estimates by viewing and analyzing the components of a model. For example, a user may determine where particular groupings of estimate revisions (e.g., a cluster) exist and more intelligently create accurate models taking clusters into account.
- estimate revisions e.g., a cluster
- the present invention enables a user to easily compare actual current estimates with enhanced composite estimates that are a result of a model. Various algorithms for comparing these values may be used and various alerts may be issued when the difference satisfies user specified criteria.
- the present invention enables the user to view a model as a “clear box”, as opposed to a “black box”.
- the user may easily view factors, N-scores, factor weights and other information that comprise a model.
- the user may readily determine why an enhanced composite deviates from a consensus estimate.
- Specific detailed numerical values relating to analysts performance and attributes are also provided to the user for comparing, sorting, and ranking.
- the snapshot view the user may view detailed analyst estimate data, including historical and current data, that informs the user what factors, weights, and N-scores comprise a model.
- the ability to analyze models on a detailed level enables the user to identify important factors, values, and trends to develop more accurate models.
- Performance module to further assist the user in developing more accurate models.
- the Performance module also enables the user to measure and compare analysts' performance, in absolute terms and relative to other analysts, sources or other data in estimating stock earnings. This feature is useful for determining how well analysts in a particular brokerage are doing, or which analyst has the best performance for a particular ticker. For example, information regarding a particular stock and multiple contributors; one particular contributor and multiple stocks; and a unique contributor-stock pair may be displayed. This enables a business model that provides the ability to rank analysts based on user-selected objective criteria.
- each contributor who made an estimate in the selected fiscal period or periods for a selected security may be displayed.
- Summary performance metrics; aggregate performance metrics; and other information may be displayed for each contributor.
- a portion of the display may display period-by-period performance for a selected security for each period in the selected fiscal periods.
- the user may also elect to filter the displayed list of contributors who made an estimate in the selected fiscal period or periods to those contributors who have a current estimate, so that either all contributors, only current contributors or some other group may be shown.
- each security for which that contributor has made an estimate for a selected contributor, in a selected fiscal year may be shown.
- aggregate performance metrics may be displayed for the selected contributor and each displayed security.
- the aggregate performance metrics may be displayed for a selected time frame and aggregated over each period in the selected period.
- a portion of the display may display period-by-period performance for the selected contributor, for one or more securities for each period in the selected fiscal periods.
- the user may select a contributor-security pair where period-by-period performance metrics for each period in the selected fiscal periods may be shown.
- the present invention provides a graphical environment for quantitative researchers and other entities, to create, investigate, backtest and apply models to create more valuable estimates. Individuals, such as portfolio managers, may easily apply these models to assist with stock selection strategies and measure the performance of analysts.
- the present invention also provides research departments, for example, regular and objective reports on the performance of individual analysts compared to other analysts following the same stocks (or other benchmarks), as well as the performance of the research department as a whole.
- Individual investors may also receive information generated by models (e.g., enhanced composite estimates) through a web-site implementation of the present invention, through internet finance portals, and other portals. Additionally, subscribers may receive information alerts, e.g., when an enhanced composite estimate changes when it differs from the consensus estimate by certain user specified or other criteria or at other times.
- Various other business methods may be implemented using the technology described herein.
- FIG. 1 illustrates a block diagram overview of an embodiment of the present invention.
- FIG. 2 illustrates an example of a Contributor/Analyst module according to an embodiment of the present invention.
- FIG. 3 illustrates an example of a Contributor search screen according to an embodiment of the present invention.
- FIG. 4 illustrates another example of a Contributor/Analyst module according to an embodiment of the present invention.
- FIG. 5 illustrates an example of results of a Contributor/Analyst module according to an embodiment of the present invention.
- FIG. 7 illustrates an example of a Contributors/Security module according to an embodiment of the present invention.
- FIG. 8 illustrates an example of a Stocks/Stock Sets module according to an embodiment of the present invention.
- FIGS. 9 and 10 illustrates an example of a historical chart view according to an embodiment of the present invention.
- FIG. 12 illustrates an example of a snapshot view according to an embodiment of the present invention.
- FIG. 14 illustrates an example of an Accuracy factor according to an embodiment of the present invention.
- FIG. 15 illustrates an example of an All Star factor according to an embodiment of the present invention.
- FIG. 16 illustrates an example of a Broker List factor according to an embodiment of the present invention.
- FIG. 17 illustrates an example of an Experience factor according to an embodiment of the present invention.
- FIG. 18 illustrates an example of an Estimate Age factor according to an embodiment of the present invention.
- FIG. 19 illustrates an example of a Models/Backtest module according to an embodiment of the present invention.
- FIGS. 20-21 illustrate an example of a Backtester according to an embodiment of the present invention.
- FIG. 22 illustrates an example of a Models/Results module according to an embodiment of the present invention.
- FIG. 23 illustrates an example of a model applied to historical data according to an embodiment of the present invention.
- FIG. 24 illustrates an example of a Performance module aggregated by Analyst according to an embodiment of the present invention.
- FIG. 25 illustrate an example of a Performance module aggregated by Broker according to an embodiment of the present invention.
- FIG. 26 illustrate an example of a Performance module aggregated by Broker and Analyst according to an embodiment of the present invention.
- FIG. 27 illustrates a block diagram of a security analyst performance and tracking analysis system in accordance with the present invention.
- FIGS. 28-30 illustrate system architectures according to various embodiments of the present invention.
- FIGS. 31-33 illustrate graphs of comparative performance by two analysts with an actual outcome according to an embodiment of the present invention.
- FIG. 34 illustrates a scatterplot graph according to an embodiment of the present invention.
- one embodiment of the invention comprises a computer implemented system and method for use with a historical database pertaining to predictions from a plurality of sources.
- the predictions may include one or more of analysts or broker estimates of earnings for a security, buy/sell/hold recommendations, revise estimates, stock price target estimates, and other predictors.
- the sources may include security analysts, institutions (e.g., brokerages), combinations thereof, calculations and other sources. For simplicity, in many cases, this specification refers to analysts estimates. It is to be understood that the invention is not so limited.
- an example of such a system may include at least one historical database 170 operatively connected to server 160 .
- Historical database 170 may receive updates 180 so that the most recent information and estimates are maintained by the system.
- Historical data relating to predictions from a plurality of sources related to securities (or other items) are stored in database 170 .
- the predictions may include earnings estimates, revisions to such estimates, and other information, along with actual reported earnings.
- server system 160 is programmed with software that implements the various features and finctions described herein. In operation, one or more users may access the system through an interface.
- the server may be a web server and the user interface may comprise a web browser.
- the interface comprises a graphical user interface (GUI) 150 .
- GUI graphical user interface
- the GUI may display various modules and finctions available to the user.
- the GUI 150 may be displayed via a terminal 112 , such as a PC or other user terminal, networked to the server 160 .
- the user may also access server 160 through GUI 150 displayed on remote terminal 110 via the Internet 120 .
- the user may access server 160 through GUI 150 displayed on wireless terminal 114 , such as a wireless phone, PDA, or portable computer.
- Analytical tool 130 comprises software that enables the user to perform various functions and features described herein. It enables analysis, use and display of the data in database 170 .
- the analytical tool 130 preferably is processor.
- Contributors module 140 preferably is processor.
- Stocks module 142 preferably is processor.
- Models module 144 preferably is processor.
- History module 146 preferably is processor.
- Performance module 148 preferably is processor.
- a Lookup module may be used in place of a Contributors module.
- One or more of the modules can be combined. For some purposes, not all modules are necessary.
- FIG. 2 illustrates an example of a screen display that a user may see in GUI 150 according to one aspect of the invention.
- the display screen comprises a Navigator pane 210 that provides various options to the user.
- the options may include the ability for the user to select from among a plurality of modules.
- the Contributors module the user may select a contributor from one or more of an analyst, broker, security, or other categories.
- the user may define stock filters and group stocks into stock sets to facilitate testing of models and for other purposes.
- the user may create, manage, edit and perform other finctions for models.
- the models may be used to generate enhanced composite estimates, backtest the model using the historical database, and view results of the backtest.
- historical estimate and actual data may be viewed in chart format, snapshot format, or otherwise.
- the chart view displays user selected estimates and actual data (e.g., earnings) graphically as time series data.
- the snapshot view displays detailed data in tabular format for a selected “As Of Date.”
- the user may analyze estimates according to price change, consensus change, and consistency.
- the Performance module the user may analyze analyst and/or broker accuracy and performance, aggregated by analyst, broker, ticker, or any combination thereof. In each of the above identified modules, other options may be available to the user.
- the user may locate analysts, brokers and stocks and review their associations with each other and for other purposes.
- the Contributor module may be used to review information about analysts, brokers, and stocks in a general way. For example, a user may select the Contributors/Analyst module in Navigator 210 , as shown in FIG. 2 .
- the user may search by analyst and view the stocks covered by that analyst, and the brokerages for which the analyst has worked.
- the user may enter an Analyst's Name in analyst name bar 220 and select (e.g., click on) the search button 221 .
- the user may select a search option where the system will search an analyst name that begins with, contains, ends with, or exactly matches the entered string.
- the user may also use wild cards when searching for analysts.
- Main Display window 230 will display the results.
- a name that has more than one match such as “Dube”
- all names that correspond to the entered string 220 and their analyst ID will be displayed.
- the user may then select the desired analyst from the list of matches (e.g., by clicking on the desired analyst).
- a user can search for a particular security via text box 760 .
- a list of the analysts and brokers who have issued estimates for this stock may be displayed along with other information, as shown in gird 705 .
- the search can be done by CUSIP, Company Name, Unique Ticker, or Listed Ticker. If a company has changed ticker symbols it is useful to aggregate over a unique ticker. For example, when America OnLine moved from the NASDAQ to the NYSE, its ticker symbol changed. Other modes of searching for a ticker are also available.
- the system will display in grid 705 , for example, a list of all analysts and brokers that have made estimates for that stock and other information.
- the system may display CUSIP number 710 , Broker ID 720 , Broker Name 730 , Analyst ID 740 , analyst name 750 , and other information.
- a Lookup Module enables the user to call up analysts, brokers and stocks, and review their associations with each other. For example, when an analyst is selected from a Lookup/Analyst module, the resulting grid displays the analyst's association with brokers, and the stocks for which the analyst has created estimates. When a broker is selected from a Lookup/Broker module, list of stocks estimated by that broker and the analysts who estimated each stock will be displayed. When a stock is selected from a Lookup/Security module, a list of analysts and brokers who have prepared estimates for this stock will be displayed. Also, start date, end date, id numbers, and other information may be available in each view.
- a Stock Filter is a set of screening rules specified by a user to identify a group of stocks satisfying the rules.
- a stock filter may include rules specifying stocks with a market capitalization in the top 500 of all stocks and a PE ratio less than 20.
- Stock filters may be used to update the list of stocks to be included in an analysis on a periodic basis.
- a stock set is a group of stocks, determined by a stock filter, manually or otherwise, that is saved under an assigned name.
- a user creates stock sets by creating a stock set name and adding stocks to it. A user can copy another stock set under a new name, and make changes to the list of stocks.
- Stock sets are stored on a system server. According to one embodiment, in a multi-user environment, stock sets may be created by an Owner and only accessible to that owner (e.g., a company) or others who are given access to a company's stock sets.
- Models/Backtest module When a user wants to test a model against a group of stocks in the Models/Backtest module, the user calls up the name of the stock set they want to use. The model is tested against all stocks in the set in a single operation.
- FIG. 8 illustrates a screen display illustrating an example of what a user may see when the Stocks/Stock Sets module is selected.
- a portion of the display may list stock sets by owner names ( 1101 ) and stock set names ( 1102 ). For example, as shown, all or some stock sets owned by the web-site operator (e.g., Starmine) may be available to all users or certain users. Stock sets created by the user (e.g., Gatto)may also be available.
- the user has selected the “test-set” list 1100 . This causes the Stock Display window 1010 to display the stocks of stock set “test-set.”
- the displayed information may include, for example, the CUSIP, unique ticker, current ticker, name and other desired information.
- the Stock Set feature makes it easy for a user to group stocks into “sets” and call up those sets during the backtesting process or for other purposes. Thus, a model can be tested against all the stocks in the set, in one operation.
- the user can type into the text box 870 a or otherwise add the tickers the user wants to add to the stock set.
- Add Ticker 870 By clicking Add Ticker 870 after entering a stock name, the added tickers will be displayed in the list shown in Stock Display window 1010 .
- the user can select it and click the Delete Ticker 860 button.
- the user also has the option to rename a stock set under Rename List 840 , copy a stock set under Copy 820 , import a list from another source under Import 830 , and delete a list under Delete List 850 .
- Other options to customize stock sets and filters are also available.
- the History module includes at least a History/Chart module and a History/Snapshot module.
- the History/Chart module displays for a selected stock and event, a graphical representation of historical estimates (and other information) as a time series over a selected time period.
- the History/Snapshot module displays in a grid format details of estimates (and other information) for the selected stock and event for a selected “As Of Date”.
- a user may easily toggle back and forth between chart and snapshot view. In both views, the software provides the user great flexibility in controlling the data to be included in the view, including the analyst or analysts data to be displayed, the calculated or derived values (e.g. high estimate, low estimate, mean), any enhanced composite estimates or other sources.
- Various other user selections described herein give the user powerful analytic ability.
- the History/Chart module displays a graphical representation of the historical performance of a selected security including selected analysts' estimates and revisions, actual reported earnings and other information.
- an earnings event e.g., annual or quarterly
- an event period e.g., annual or quarterly
- estimates and revisions are charted as a time series display, preferably along with the actual reported earnings of the selected stock for the event.
- the chart enables the user to visually analyze historical data for an event along with different analysts' estimates for an event. It enables a user to graphically identify analyst's whose estimates were close to the actual earnings and, importantly, how soon before the reported earnings an analyst made that estimate.
- the chart view also allows the user to simultaneously display calculated or derived values for display as a time series.
- a user can select a model and view estimates generated by applying the model at any point in time prior to the period report date.
- a user can visually compare the model estimates to a consensus estimate or other source.
- the user also may selectively view one or more analysts' estimates simultaneously with one or more of an average, high or low estimate.
- FIGS. 9 and 10 illustrate examples of History/Chart modules.
- FIG. 12 illustrates an example of a History/Snapshot module.
- both views may have certain common display elements.
- both views may include the Navigator 210 .
- Both may also include a Selected Event area 1120 , a Calculated Summary area 1130 , a Model Selection area 1140 , a Cluster area 1150 , a Main Display window 1115 , and other desired information.
- Select Event area 1120 the user may select a security and earnings event, the security may be selected by Ticker, Unique Ticker, Company Name, CUSIP number, or other category using text box/drop down list 1120 a .
- the user has chosen to select the security by ticker, for example.
- text box 1120 b the user may enter the ticker (or other information to identify the security).
- the user has selected Apple Computer by entering AAPL.
- box 1120 c the user may select the event period type (e.g., annual or quarterly) and event date (e.g., a year or quarter-ending June-99). In this example, the user has selected the quarter ending September 1998.
- the user may also select an “As Of Date” at 1120 d . As detailed elsewhere herein, calculated and derived values are calculated and displayed as of the “As Of Date”.
- the user may select the “As Of Date” in various ways. For example, under the Select Event area 1120 , the user may click the Calendar icon 1120 e to display a Calendar and pick a date by clicking double arrows for years, single arrow for months, and finally a day of the month from the displayed month. Alternatively, the user may manually type a date in the “As Of Date” box 1120 d . In the History/Chart module, the user may drag an “As Of Date” bar (e.g., 1160 ) to a desired date displayed in Main Display window 1115 . Bar 1160 graphically indicates the “As Of Date”.
- an “As Of Date” bar e.g., 1160
- the user may simply click on the X-axis on the desired date and the “As Of Date” bar 1160 will move to that date.
- Other ways of changing the “As Of Date” may also be available. In each case, the displayed “As of Date” will be changed to the selected date.
- Model Selection area 1140 a user may select a model (created using the Models module described elsewhere herein) which when applied against analyst estimate data, creates an enhanced composite estimate that can be displayed in the chart or snapshot view. This enables a user to analyze, test, and compare the results of the selected model with selected analysts, consensus and other estimates or other information.
- the user may select a model from a model list shown by clicking on a drop down window at 1140 a .
- the value of the selected model's estimate as of the “As of Date” may be shown and the deviation from the mean may be shown at 1140 c (e.g., as a %, actual or other difference).
- Other comparisons and information may be used and displayed to assist the user in analyzing the selected model's estimates and identify the significance of it.
- Cluster information may be displayed in Cluster area 1150 .
- a cluster is a group of estimates satisfying user specified criteria. When new information about a company becomes available, some analysts may promptly revise their estimates. A group of such revisions may constitute a cluster. Such revised estimates tend to be more accurate than estimates made before the clusters.
- Cluster information displayed in Cluster area 1150 may include a begin date, detect date, number of analysts, cluster mean, cluster standard deviation, and other information. Clusters assist users in identifying potentially significant trends and changes in estimates.
- Main Display window 1115 may display estimate data in either chart or snapshot format, as selected by the user. Where the user selects a chart format, Source Selection panel 1110 may display a list of sources, or group of sources, which may include analysts, brokers and other potential sources in Source section 1110 a , calculated averages, calculated high, calculated low, and other calculated summaries in Calculated Summaries section 1110 b , and selected models in Models section 1110 c . Other sections may also be available to display other relevant information.
- the selected analyst's estimates and revisions are charted as a time series display along with actual reported earnings for the stock.
- Other features and options may also be selectively displayed.
- the user may conveniently select and deselect individual sources, including analysts, calculated or derived summary data (e.g., high, low, and consensus estimate) and enhanced composite estimates generated by one or more models.
- the user may simultaneously view a times series of earnings estimates for one or more selected analysts or other sources for a selected security and predetermined earnings event.
- the user can select, in Source section 1110 a , a check box of the analyst whose estimate history the user wants to display. For example, the user may click on the check box to activate the source.
- a unique identifier for each analyst or source is used for that source's time series.
- each check box in source selection panel has a unique color and a line the same color as the check box area appears on the chart, showing the analyst's estimate history for that stock.
- the user can select/deselect as many analysts as the user want individually, or as a group. To select all analysts, or to deselect them, the user may right-click anywhere in the Analyst list and use a Show/Hide command that enables a user to show all or hide all analysts.
- the user can select a calculated estimate, for example, to compare an analyst's estimate record with the consensus or other calculated estimate, in Calculated Summaries section 1110 b .
- a calculated estimate for example, to compare an analyst's estimate record with the consensus or other calculated estimate, in Calculated Summaries section 1110 b .
- the user may compare analysts' estimates with a calculated average, a calculated high, a calculated low, a mean plus standard deviation, a mean minus standard deviation, and other calculated estimates.
- the time series is generally displayed as a step function comprising a plurality of nodes, data points or data markers, connected by horizontal lines.
- the nodes, data points or data markers represent start dates, revision dates, or end dates.
- the selection of a node e.g., by clicking on it
- Discontinuities in a time series may be graphically displayed
- a discontinuity may occur if an analyst stops covering security then restarts.
- the discontinuities may be displayed as a gray mark, for example, in the time series.
- each source's earnings estimate may be displayed in different colors (or other designator, such as symbols, different line type or line width, etc.) and a legend to correlate the various time series to the corresponding source.
- the present invention may provide a mechanism to ensure the visibility of both when for a given time period the numbers are the same value.
- the graphical interface user may display one of the time series (e.g., consensus) as a thicker line than the other, where the thicker line is in the background and the thinner line is in the foreground. In this way, even if the values are the same for a given time period, both lines will be visible.
- a selected source's time series may be displayed as a thicker line to easily focus on that source's time series. In the example of FIG. 9, calculated average is shown as a thicker line thereby indicating that this feature was selected.
- Various display control features may be provided to enable a user to control the display in Main Display window 1115 .
- the user may select from various viewing options by right clicking in the chart view.
- the user may use the right click option to select a different time frame in Main Display window 1115 .
- the user may display data corresponding to selected time intervals before the report date in increments of one month to two years, or Maximum for the longest available time frame.
- Vertical Max view displays the widest discrepancies of the lines on the y-axis.
- the chart will then redraw the Main Display window 1115 to display the time period the user selected.
- the right click option may also provide Get High Analyst and Get Low Analyst options.
- the user may view an Analyst Name, Broker Name, Estimate Date, Estimate Value, and other information regarding the high analyst and low analyst.
- the user may also select to view the mean on the report date as well as the mean value.
- Other options include the ability to export the history to a file, save the chart to a clipboard, print the chart, and other options.
- the user may also select to view a corresponding price chart that may appear as a separate chart directly below and time correlated to the chart view of estimate data, as discussed in greater detail below in FIG. 11 .
- the options available through the right click mouse button may also be made available through other selection means.
- the user also has the ability to narrow in on a section of Main Display window 1115 .
- the user may box a portion of the Main Display window 1115 (e.g., by holding down the left mouse button to draw a box around an area) to view estimate data in greater detail in chart format. This feature is useful when estimate data from different sources are displayed closely together so that it becomes difficult to differentiate the estimates in chart format.
- FIG. 10 illustrates a chart view of an identified analyst compared to a calculated high and calculated low.
- analyst Graham-Hackett M has been selected as indicated by the checked box in Source section 1110 a to display this analyst's estimates for AAPL stock, as shown in Select Event area 1120 .
- FIG. 10 displays a calculated high shown by line 1230 , a calculated low shown by line 1250 , and estimates provided by the identified analyst, shown by line 1240 .
- the user may visually compare Graham-Hackett's estimates with the actual reported amount as indicated by Actual bar 1210 .
- a Period bar 1220 may be displayed as a thinner line or other indicator. The Period bar 1220 signifies the end of a period.
- the position of the Period bar 1220 indicates that the period for that quarter has ended just after the actual earning was calculated, as shown by the Actual bar 1210 .
- Earnings bars 1170 indicate previous reported earnings for each quarter.
- the “As Of Date” bar 1160 indicates a date of Aug. 28, 1999.
- the Calculated Summary data in area 1130 along with the Value, vs. Mean in area 1140 , and Cluster information are displayed to the user where these values are current as of the “As Of Date”.
- FIG. 11 illustrates a Price Chart option that may be invoked through a right click option or other selection means.
- FIG. 11 illustrates that a time series display of the price of the security in juxtaposition with the time series of earning estimates for the security. This is particularly useful to see if there is any correlation between estimates and revisions thereto, and stock price movement.
- estimate data displayed in chart format is displayed in Chart window 1410 and the corresponding stock prices are displayed in Price Chart 1420 , in Main Display window 1115 .
- the user may drag the Chart window 1410 by holding down the right mouse button (or other dragging mechanism) to view estimates of other time frames thereby changing the times series view.
- the stock prices shown in Price Chart 1420 correspond to the time series estimates in Chart window 1410 .
- the stock prices displayed in Price Chart 1420 accordingly follow the user's change in time frame.
- the stock price for the “As Of Date” may be displayed in Stock Price box 1430 in Price Chart 1420 .
- the stock price of the new “As Of Date” will be displayed in Stock Price box 1430 .
- FIG. 12 illustrates an example of a snapshot view.
- the snapshot view enables the user to focus on a single date (the “As Of Date”). For that date, the user may view various data, metrics, and other information associated with the estimates current on that date.
- the snapshot view is a powerful tool that provides significant detail for a given date in one view.
- the view provides a clear breakdown of estimate data, source performance and attribute information and other information on an analyst by analyst basis.
- Detailed data regarding various factors e.g., factors used to calculate weights assigned to each analyst may also be displayed on a factor by factor basis.
- FIG. 12 shows a display wherein a snapshot view shows source, current data, historical data, factor-related data and other information.
- analyst information may be displayed as represented by A 1 -A 28 , which may include analyst's name, broker information and other source information.
- the snapshot view may also show current and historical estimate data as well as other information.
- the snapshot view may current estimates column 1512 , current estimate date column 1514 , estimate age column 1516 and other current estimate data.
- Historical estimate data may also be displayed including previous estimate column 1518 , previous estimate date column 1520 , change from last estimate to current column 1522 and other historical information.
- the snapshot view simultaneously displays performance, attribute data, exclusion data and factor weights on a source by source basis.
- performance data may be provided under Accuracy 1 column 1524 , Accuracy 2 column 1530 , Estimate Age column 1536 , and other forms of performance data.
- the actual score attributed to that performance as well as an N-score may be displayed.
- the percentage of accuracy is displayed in column 1526 and an N-score is displayed in column 1528 .
- the percentage of accuracy is displayed in column 1532 and an N-score is displayed in column 1534 .
- the N-score assigned by user-defined criteria may be displayed in column 1538 .
- Attribute data may be provided under Experience column 1540 , Broker List column 1546 , and other types of attribute data. Under each attribute data, attribute information and an N-score may be displayed. For example, under Experience column 1540 , the number of periods (e.g., quarters) an analyst has provided an estimate is displayed in column 1542 and the score assigned to the number of periods an analyst has provided an estimate is provided in column 1544 . In another example, under Broker List column 1546 , the group that the broker has been assigned to is displayed under column 1548 and the N-score assigned to that group is displayed in column 1550 .
- Experience column 1540 the number of periods (e.g., quarters) an analyst has provided an estimate is displayed in column 1542 and the score assigned to the number of periods an analyst has provided an estimate is provided in column 1544 .
- the group that the broker has been assigned to is displayed under column 1548 and the N-score assigned to that group is displayed in column 1550 .
- Exclusion data is also displayed in the snapshot view.
- the user may view which analysts were excluded as clusters by examining Exclusion column 1552 .
- the user may easily see the estimates excluded by a model and the reason for the exclusion.
- the example of FIG. 12 shows a cluster has been detected.
- estimates outside the cluster are excluded under the clusters exclusion factor as indicated by an “x” mark, or other identifying mark in column 1554 .
- Other estimates may be excluded for other reasons where the reasons are displayed under the reason column 1556 .
- the snapshot view as shown in FIG. 12, enables the user to view current analyst data commingled with a plurality of data values and N-scores for a selected model on an analyst-by-analyst (or source-by-source) basis.
- the user may readily compare the current analyst data for each analyst for a given stock with the elements that comprise the model, such as factors, N-scores, Exclusions and Weights.
- the user may also sort by the factors that are of particular interest to the user in defining and refining a model. For example, by sorting the estimates in the order of most recent estimate, the user may view estimates in the order of recency.
- the user may create a model that can be applied to analysts' estimates for one or more stocks or stock sets to create an enhanced composite estimate for the stock or stocks.
- the enhanced composite often improves the ability to predict a quantity being estimated, such as company earnings, revenue, cash flow, buy/sell/hold recommendations or other predictions.
- the model preferably comprises one or more of user defined exclusions, rules, selected factors with user specified rules for assigning a factor score (N-score) to each source or non-excluded source, and Factors Weights that are applied to each factor.
- the user can identify certain exclusions by which certain data items (e.g., estimates), contributors (e.g., analysts and brokers), or other sources are excluded from consideration for a particular model (e.g., if a source's estimate is older than a certain number of days, or if an analyst has not covered a stock for a minimum number of periods).
- certain data items e.g., estimates
- contributors e.g., analysts and brokers
- the model is applied to current estimates to create an enhanced composite estimate.
- the model may be backtested against historical data (visually and/or analytically), refined and when desired put in production mode. In production mode, the model is run against current data to generate current enhanced composite estimates (e.g., nightly or other frequencies).
- current enhanced composite estimate may be made to identify significant situations (e.g., where the enhanced composite estimate generated by a model deviates from the consensus estimate (or other bench mark) by certain user specified criteria.
- Models functions are accessed from the Models/Manage module in Navigator 210 , as shown, includes options to manage models, backtest models and show results.
- the Models/Manage module enables a user to create, edit, move, copy, delete or perform other functions on a model. As user creates a model by naming the model, specifying exclusion rules (including cluster definitions), identifying model factors, defining scoring rules, and assigning factor weights to the factors. The user may also perform other model managing functions such as saving a model, copying a model, moving a model and deleting a model.
- a Models Folder window 2110 preferably contains model libraries and model names. Other organizational techniques and systems may be used. Models Folders window 2110 displays the available models to the user. Models classified under Research may be in the process of being tested. Models classified under Production are in actual use to calculate enhanced composite estimates. Other categories are also available to the user for classification.
- the Models/Backtest module enables a user to test and refine models for accuracy and other criteria.
- the Models/Results module displays the results of the Backtests to the user.
- the user may visually test models through the History/Chart and History/Snapshot modules.
- a user may create a model by identifying various exclusions and factors to be taken into account in the model and the Factor Weight to be assigned to each factor. Other steps and options may be used.
- the user may specify exclusions using an exclusions template 2130 as shown in FIG. 13 .
- a user may specify rules by which each non-excluded analyst is assigned an N-score (normalized score) according to the rules. The user can assign a Factor Weight to each factor to place greater emphasis on one or more factors for a given model.
- the analyst's N-score for each factor is multiplied by the Factor Weight to generate a Weighted N-score.
- These Weighted N-scores are summed for each analyst to generate a Total Factor Score for each analyst.
- the actual Total Weight for an analyst's current estimate is determined by normalizing the analyst's Total Factor Score, i.e., dividing it by the sum of the Total Factor Scores for all analysts. In this way, the sum of the Total Weights will equal 1.
- a user may specify certain exclusions that will exclude certain analysts or estimates. Then assume the user selects three factors F 1 , F 2 , and F 3 to use in the model. Next, the user may specify rules for each factor to assign N-scores for each non-excluded analyst. Then the user assigns Factor Weights to each of the three factors. For exemplary purposes, assume that based on these rules, three analysts A 1 , A 2 , and A 3 are assigned the following N-scores and Factor Weights as detailed below.
- Factor Weights may be assigned for each factor depending on the relative importance as determined by the user. For example, for this model, the user determined Factor 1 to be most important and assigned it a Factor Weight of 0.6. Factor 2 was assigned Factor Weight of 0.3 and Factor 3 was assigned a Factor Weight of 0.1. The analysts' N-scores for each factor is then multiplied by the Factor Weight and those Weighted N-scores are summed for each analyst to generate a Total Factor Score for each analyst.
- a 1 has a current estimate of 1.50
- a 2 has a current estimate of 1.20
- a 3 has a current estimate of 1.25.
- the enhanced composite estimate differs from the consensus by 0.11 or nearly 10%. This may signal that the stock is undervalued.
- Models/Manage To create a model, from the Navigator 210 , the user can select Models/Manage.
- the general appearance of the display will include the Navigator 210 , a Models folders section 2110 , a Main Display window 2160 including an Exclusions area 2130 (or other mechanism to enable selection display of various factors and other criteria relating to models) and a Factor Weights display and selection mechanism 2150 .
- a tool bar (or other mechanism) will also be displayed to enable a user to select one or more of New, Copy, Save, Move, Delete or other functions.
- a dialog box will appear with a text box for entering the name of the user's new model.
- the user can type the name of the new model. As shown, the user has entered the name “Joe”.
- the model name appears in a model name header in box 2120 .
- the new model is saved to the server (or elsewhere).
- the new model may be saved in the Research Library as shown in Models Folders window 2110 .
- FIG. 13 illustrates an example of a screen for defining a model according to one embodiment.
- a corresponding tab number is provided for each factor that the user may select from.
- a factor template is displayed in Main Display window 2160 .
- the user may also define Factor Weights in Factor Weights area 2150 .
- a user may assign Factor Weights for a given model for various factors such as one or more of Accuracy, All Star rating, Broker List, Experience, Estimate Age, and other factors attributes or performance metrics (e.g., Accuracy 1 and Accuracy 2 , or other metrics).
- the factors are elements of a model that enables a user to filter out or place less weight on weak analyst estimates and include or place more emphasis on ones which based on historical data, likely will be more accurate. Factors may be based on known predictors of estimate accuracy.
- the user may define the rules for assigning a value for each factor. For example, the user may define rules for determining relative error percentage with respect to Accuracy 1 .
- the user may also assign an N-score to each factor. For example, in assigning an N-score to an All Star factor, the user may assign an N-score of 1.00 to an analyst with All Star status while providing 0.25 to an analyst with non-All Star status.
- the user has defined a model by first assigning a model name (e.g., “Joe”) under General tab 2170 .
- the user may specify certain exclusion factors in Exclusion area 2130 .
- various exclusion factor options may be presented to the user.
- the user can select (e.g., by check box) exclusion factors to be used and can customize each option by specifying user selected exclusion factor criteria on a model-by-model basis.
- the displayed exclusion factors include: (1) estimates that are older than a user-specified number of days; and (2) estimates that are more than a number of standard deviations from the mean. This system may also give a user an option to detect clusters (detailed below).
- a cluster is a grouping of estimates or revisions made by one or more different contributors satisfying certain conditions, e.g., estimates or revisions made within a certain interval of time or other conditions.
- Clusters can assist users in identifying potentially meaningful trends, changes in conditions, or other occurrences. For example, if a number of analysts suddenly revise estimates, those estimates may be based on recent news. Clusters can be used to help identify more meaningful estimates.
- a user may define the criteria by which the user wants to define a cluster.
- the user may specify the maximum time between one estimate and another estimate of another analyst for the two estimates to be considered part of the same cluster or cluster candidate.
- a cluster definition template is displayed to facilitate the definition of a cluster.
- the time between estimates has been defined as 3 days in Cluster Definition area 2140 .
- Further parameters may be specified by the user in qualifying a cluster candidate as a cluster.
- parameters may include enabling a user to specify restrictive, qualifying criteria on revisions including the condition that only revisions in the same direction (or any direction) qualify, or that only revisions of at least a user-specified magnitude qualify.
- the user may specify the minimum number of new estimates or qualifying revisions that are required to define a cluster.
- the number of new estimates or qualifying revisions may either be a fixed number of analysts or a variable number of analysts, for example, depending on the number of analysts with active estimates for the event as of the day for which the enhanced composite estimate is being calculated.
- the user may specify the number of analysts needed to define a cluster as a finction of the number of analysts, or a percentage of analysts, following the stock.
- an exclusion factor may include a user-selectable option to exclude estimates that are older than the date of the last-detected user-defined cluster.
- FIGS. 14-18 further illustrate examples of how a user can select factors for inclusion in a model, define rules and N-score criteria for the factor and other features.
- the user may specify various selections associated with a first performance metric, referred to as Accuracy 1 , by clicking on the Accuracy 1 tab 2172 .
- the factor's potential components and other information will appear in Main Display area 2160 .
- the user can select details in the text boxes, check boxes, etc.
- a template is displayed including a performance Metric Definition area 2210 and a N-score definition area 2220 .
- the Accuracy 1 metric may be used to calculate each analyst's (or source's) average Relative Error % according to user specified criteria. For example, as shown, the user may select: the number and type of fiscal periods (e.g., years, quarters, etc.); the minimum number of periods of coverage for an estimate to be included; and a window of time (e.g., number of months) prior to a report date to limit the estimates to be included for this metric.
- the algorithm for the average Relative Error % (and other metrics used as factors) may be created and stored in the Performance Module, described elsewhere herein.
- each non-excluded analyst's average relative error percentage may be calculated.
- This metric may be converted to an N-score for this factor based on user specified rules as set forth in the N-score Definition area 2220 .
- the N-score area 2220 enables certain analysts to be excluded (or give a zero score for this factor) and allows other analysts to be given a score by error rank.
- an N-score may be assigned by Error Score, Error Rank, equally to all or a user specified number of top qualifying analysts (based on relative error percentage), or other options in N-Score area 2220 .
- a user has the option to use other performance metrics (e.g., a second accuracy metric as shown by Accuracy 2 tab 2174 .
- a second accuracy metric as shown by Accuracy 2 tab 2174 .
- this application is a description of Performance metrics.
- One or more of these metrics and other metrics may be used in creating models.
- each has a corresponding tab that when selected displays a template similar to that shown in FIG. 14 but customized for the particular metric.
- a model may include one or more analyst and/or broker attributes. Examples of such attributes may include All Star qualification, Broker List affiliation, Experience, and Estimate Age. Other attributes that may bear on estimate performance may be used.
- a user may include as a Factor Weight an All Star (or other) rating, by selecting All Star tab 2176 .
- An All Star rating is a known rating given to some analysts by Institutional Investors based on a published analyst survey. If this factor is used, in All Star Determination area 2310 , the user may specify the criteria relating to an All Star rating. As shown, the criteria may include whether the analyst was ever an All Star or whether the analyst was an All Star the previous year.
- N-score may be assigned to All Stars and non-All Stars based on he parameters selected in All Star N-Score area 2320 . For example, analysts meeting the All Star criteria specified in All Star Determination area 2310 may be given an N-score of 1 for this factor and those not meeting the criteria may be given a lower score (e.g., 0 or 0.25).
- the user may include a Broker List factor in a model by selecting Broker List tab 2178 (FIG. 13 ).
- the Broker List attribute takes into account attributes of a particular broker (e.g., a broker with whom an analyst works).
- a user may create and store multiple broker lists (e.g., in Broker List Folders area 2510 ).
- Each broker list includes a list of brokers selected by a user, grouping criteria for grouping brokers in the list of brokers and rules for assigning an N-score to each group.
- a user may divide broker lists by size, reputation, historical accuracy, affiliation with a stock (e.g., market maker, etc.), or other criteria.
- Broker List definition screen including Broker List Folders area 2510 from which a user may select a broker list or to which a newly created list may be saved.
- Group N-Score area 2520 the user may designate N-score values for each group.
- Broker Name/info area 2530 the user may view the brokers and other information (e.g., size, status, historical metrics, etc.). User specified rules may be created to group brokers or it can be done manually. Other techniques may also be used.
- the brokers in Group # 3 are assigned an N-score of 1.000
- the brokers in Group # 2 are assigned an N-score of 0.5000
- the brokers in Group # 1 are assigned an N-score of 0.0000.
- N-scores For example, larger brokerage firms or firms with better reputations may be classified in Group # 3 and given a higher N-score.
- the user may assign N-scores to each broker or group of brokers and store the set of N-scores in a broker list for use in other models.
- Another factor that may be used in creating a model is an analyst's experience (generally, with a particular stock, within a particular industry or other criteria), by selecting Experience tab 2180 (FIG. 13 ).
- the user specify rules and criteria to assign an N-score to analysts based on the analyst's experience.
- the score can be based on a designated period type, such as number of years or quarters for which the analyst has made estimates for a particular security.
- the user may define a scoring system based on the amount of time an analyst has followed a stock, whereby if an analyst has estimates for less than a first selected number of periods, the analyst receives a score of 0.0 for this factor and if the analyst has estimates for greater than a second selected number of periods, the analyst receives a score of 1.0 for this factor.
- analysts with experience between the first and second numbers of periods may be assigned a pro-rated score.
- the N-score for each analyst may be defined as using the following formula:
- N -score (#Periods ⁇ Minimum Periods)/(Maximum Periods ⁇ Minimum Periods).
- the #Periods is the number of periods for which the analyst has covered the stock, Minimum and Maximum periods correspond to the first and second user-selected number of periods.
- Other functions for converting the number of periods of analyst coverage for a security into an N-score for the contributor experience factor for each analyst may also be used.
- the user may include Estimate Age (or recency) as a factor, by selecting Esti mate Age tab 2182 .
- a recency factor may exclude estimates from earnings calculations if they are older than a specified number of days. This may be based upon the assumption that a more recent estimate is likely to be based upon relatively new and accurate information which may affect a company's earnings potential and, therefore, is more likely to be predictive of a company's actual earnings.
- Age-weighting may be defined as constant or proportional with a user-defined cutoff in Estimate Age area 2710 .
- the user may filter out estimates that are older than the number of days specified. By choosing constant age weighting, the same weight is given to all estimates, for this factor. By choosing proportional age weighting, less weight may be assigned to older estimates on a sliding scale.
- a leadlag score factor may be assigned a weight by the user.
- the leadlag score factor is the number of leading estimates minus the number of lagging over the total estimates.
- the scoring system may involve assigning a score of 0.0 or 1.0 depending on whether an analyst's leadlag score is lower or greater than a user defined number.
- the mean time between revisions may be included as a factor. This factor filters out estimates of analysts who revise estimates infrequently or relatively infrequently compared to other analysts. For example, an analyst with a mean time between revisions of less than 80 days may receive a score of 1.0 while an analyst with a mean time between revisions of more than 120 days may receive a score of 0.0.
- a user may specify adjustments to be made to one or more non-excluded estimates, where the adjustments are based on one or more factors, such as historical analyst bias, historical aggregate analyst bias as a finction of time prior to period report date, analyst's firm's relationship with the security's issuer, the security's historical performance relative to consensus estimates, or other factors.
- factors such as historical analyst bias, historical aggregate analyst bias as a finction of time prior to period report date, analyst's firm's relationship with the security's issuer, the security's historical performance relative to consensus estimates, or other factors.
- an adjustment factor may be calculated.
- the adjustment factor may represent an analytical “bias” which may or may not be incorporated into each analyst's earnings estimate, for a particular security, over a given period of time. For example, an analyst who has, over a specified time period, issued earnings estimates for a particular company that were, in hindsight, on average 5% too high, might be assigned an adjustment factor of 0.95, such that the analyst's issued estimate over the specified time period is reduced by five percent. Conversely, an analyst who has historically issued estimates over a specified time period that were, in hindsight, on average too low might be assigned an adjustment factor of 1.10 for that performance analysis set, such that his actual reported estimate for that time period is effectively increased by ten percent.
- adjustment factors may be generated in real time in response to user-defined inputs.
- the calculation of an adjustment factor may be based, at least in part, upon a comparison of the historical earnings estimates issued by an analyst, for a given security followed by that analyst, over a particular time period.
- a user may define analysis parameters and metrics such that the determination of an adjustment factor may take into account an analyst's historical percentage error as compared to actual earnings, generally available consensus earnings estimates, custom composite adjusted earnings estimates, or other metrics.
- the user may also assign a scaling factor to be applied in the calculation of the adjustment factor for a given performance analysis set.
- a user may define a performance analysis set such that, for that analysis set, a particular analyst is shown to have issued estimates that were on average 20 percent greater than actual earnings.
- the user may then assign a scaling factor, such as 0.5, to be multiplied by the 20 percent error.
- the effective adjustment factor for that user-defined performance analysis set reflects a 10 percent and not a 20 percent adjustment—i.e., an adjustment factor of 0.9, rounded to the nearest tenth.
- the user “discounted” the analyst's earnings estimate bias as indicated by the system's calculations.
- a formula for the calculation of the adjustment factor is set forth below:
- custom composite estimate is calculated by multiplying an analyst's current earnings estimate (for a given security, and event) by its corresponding adjustment and weighting factors for that given performance analysis set. The results for each estimate for each analyst of interest may then be summed to arrive at the custom composite estimate.
- the calculation of a custom composite estimate provides investment managers and others with an improved method for determining the accuracy of an analyst's earnings estimates and predicting the actual earnings of a company over any given period of time.
- the user may perform managing functions to maintain models.
- Such managing functions include for example, saving, copying, editing, moving, and deleting models.
- the user can save models using commands in the Models/Manage module.
- the user can use the Save function to save changes in an existing the model, or save new models.
- Models Folder window 2110 The user can select a model from Models Folder window 2110 , or create a new model.
- the user can create a new model or make the desired changes.
- the user can click Save on the menu bar to save the selected model to a desired folder.
- Models may be stored on a server so that authorized colleagues and other individuals may access these models.
- the server applies the factors to the estimates specified by the user and produces an estimate based on the model.
- the user may apply the model to a range of stocks, such as a defined stock set. The user may then be provided with a full listing of performance metrics for analysis of the model's accuracy. Because historical data where the actual earnings are known is being used, accuracy is easily determinable.
- these models may be backtested against historical data. Resulting performance analysis sets and corresponding custom composite estimates may then be stored in the system's database for later retrieval. In this way, a user may test such models by applying them over any previous time period, thereby essentially creating a “virtual analyst” whose hypothetical prospective performance may be compared with the historical performance of a single or plurality of analysts, or even the average historical consensus estimates for any previous time period. By conducting such tests a user may refine a model to better predict earnings.
- the backtesting capability verifies a model's viability against a range of stocks, analysts, and historical periods.
- the backtesting capability enables the user to measure the estimating performance of one or more models by calculating an extensive range of error metrics for the model. Over specified time periods and individual or groups of stocks, the user may measure the accuracy of the model using relative error percentages and by a variety of additional metrics.
- the present invention calculates what the estimates would have been at each sampling point in time against the stocks in the user's set, calculates the error metrics, then presents the results in grid format so that accuracy, consistency, and availability may be easily assessed, compared to each other and compared to the calculated average of the then-current estimates.
- the backtester provides details about what models the user wants to test, on which stocks, over what historical time frame. Other criteria may also be specified.
- the Models/Backtest module may be used to submit the models for testing on the server using the historical database. Testing may be a batch operation at system location so each job will be queued with others. The grid in this screen shows the user the progress of the job and status of the batch server. Test results are saved on the server. To download the results, the user may select a test row and click View Results.
- a user may run a backtest by selecting Models/Backtest module from Navigator 210 .
- Various options are available to the user. For example, the user may select Submit Backtest 3010 , Define Format 3012 , Delete Backtest 3014 , View Results 3016 , Refresh Grid 3018 , and other options.
- Backtest Summary area 3020 displays backtest information such as the name of the user who has submitted the test in User Name column 3021 , the status of the job in Status column 3022 , percentage of the job that is completed in % Completed column 3023 , date and time the job was submitted in Submitted column 3024 , an identifier assigned by the server to the job in Request ID column 3025 , the name assigned to the particular backtest in Name column 3026 , the file size (e.g., in KB) of the backtest in Backtest Results Size column 3027 , and if the export option was used, the size of the TXT file created for export in Export file column 3028 . Other information may also be available.
- backtest information such as the name of the user who has submitted the test in User Name column 3021 , the status of the job in Status column 3022 , percentage of the job that is completed in % Completed column 3023 , date and time the job was submitted in Submitted column 3024 , an identifier assigned by the server to the job in Request ID column
- Backtest Summary area 3030 provides details about the currently selected backtest. This area may be read-only. To resubmit a backtest with changes, the user may right click on the backtest name and select Resubmit.
- the Backtest Summary area 3030 provides the information such as the backtest name in bar 3031 , Historical time frame in area 3032 , how often the backtest is calculated in area 3033 , and the stock set or filter used, if any in area 3034 . In addition, the period type in area 3035 , output details in area 3036 , and other information are displayed.
- the user may select Submit Backtest 3010 to display Backtester screen as shown for example, in FIG. 20, where the user may enter parameters of the test.
- Models tab 3110 the user may select the model to backtest in Backtester display 3120 .
- Options tab 3130 an Options screen as shown in FIG. 21 will be displayed.
- the user may enter a name for the backtest in Backtest bar 3210 . If a name is not entered, the system will create one.
- Securities area 3220 the user may select a stock set or filter to be used in the backtest.
- Historical Time Frame area 3230 the user may specify the range of the backtest.
- the user may select how frequently the error statistics are to be sampled.
- the backtester will calculate enhanced composite estimates between the time frame identified in Historical Time Frame 3230 for every “As Of Date” on Friday, the calendar month end, or the calendar quarter end, or other period.
- Period Type area 3250 the user may select the fiscal period type for the backtest.
- the backtester can create enhanced composite estimates for the next reported fiscal quarter after the “As Of Date” (FQ 1 ), the next reported fiscal quarter after FQ 1 (FQ 2 ), the next reported fiscal year after the “As Of Date” (FY 1 ), the next reported fiscal year after FY 1 (FY 2 ), other period types may also be available.
- the backtest results may be automatically stored in the server.
- the results are automatically copied to the data directory on the user's workstation.
- the user may create a tab- or comma-delimited flat file for analysis by the user's own software by selecting the Export box in Output area 3260 . This enables the user to further analyze the data in spreadsheet, database, or other software applications.
- the user may click on the Define/Select button to bring up a Field Specifier window, where the user may select the fields and format for an export file of backtest results.
- the user may click the submit button 3140 .
- the backtest parameters and data are then submitted to the server.
- a Complete message will appear under Status column 3022 .
- the user may view the test results by right-clicking on the test summary row in Backtest summary area 3020 (FIG. 19 ).
- the user may select Models/Results module in Navigator 210 .
- the user may select View Results 3016 from Models/Backtest module as shown in FIG. 19 .
- the name of the backtest is displayed in Backtest box 3211 (FIG. 22 ).
- the user may select viewing options of the results. For example, the user may select Summary Form where summary information of the models and data are displayed.
- the user may select to view the results by model which groups the results by model with lists of securities and data.
- the user may select to view the results by stock where the stocks are grouped with lists of models and data.
- the user may view the results in an ungrouped format which provides a sortable list of models and stocks.
- the user may view result information regarding Model Availability, Relative Error %, Outlier Performance, and other information.
- Model Availability the user may view the Model name, Number of samples, Estimate Availability and Estimate Calculations.
- Relative Error % the user may view the Average Relative Error Percentage, the Relative Error Percentage less than or equal to ⁇ 10% or other percentage.
- Outlier Performance the user may view 0.5 Standard Deviation, 0.5 Standard Deviation with RE factor, and other information.
- the user may also view the results in a chart format in Distribution chart 3231 which shows distribution of the current stocks' error metrics.
- the user can test it against historical data for a single stock and compare its accuracy with the consensus in the History Chart.
- FIG. 23 illustrates a model applied to historical data.
- the user has selected “Production: Joe” as the model, as shown in Model Selection area 1140 .
- the results of the model as applied to the time frame indicated by the chart are shown in a designated color (the bolder line 2350 in FIG. 23 ).
- the user may compare the model with the calculated average (shown as line, or other estimate, shown in the chart by a different color (the lighter line 2355 in FIG. 23 ). Although the two lines are similar in trend, appearance and final estimate, the model as applied to the historical data provides valuable information to the user.
- the model as applied to the historical data shows increases (or jumps) in estimates before the increases in the calculated average.
- the model leads the consensus in estimate increases.
- the model estimate jumped to 1.50 close to Apr. 6, 1998 while the calculated average estimate jumped to 1.50 close to Jul. 13, 1998.
- the model estimate jumped to 1.65 shortly after Jul. 13, 1998 while the calculated average estimate jumped close to October, 1998.
- estimate and prediction information may be made available to the user several months in advance.
- the user may chart its estimate record for any stock's historical data and find out instantly if the model is outperforming the consensus. By examining the chart lines closely, weak areas in the model may be detected. The user may then go back and refine the model, and chart again.
- alert services may be available to users.
- a model When a model is applied and an estimate exceeds the calculated average, or other factor, by a user-defined amount, the user may receive an alert or notification of such an event.
- the alert may be done via electronic mail or wireless communication or other mechanisms.
- the present invention when applied to stock estimates may serve to alert and inform the user of events that may persuade a user to purchase or sell a particular stock.
- a web site operator using the software of the present invention may offer a subscription service based on issuance of alerts. Other uses may be made of the enhanced corporate estimates.
- the performance module enables a user to measure and compare analysts' performance, in absolute terms, and relative to other analysts, in estimating stock earnings. This feature is particularly useful when a user wants to determine how well the analysts in a brokerage house are doing, or which analyst has the best performance for a ticker, industry or other stock set.
- the performance module also provides error metrics in summary and detailed form for the analyst whose performance is being measured.
- the error metrics may include, for example, a raw error metric, a relative error metric, a bias error metric, a user-defined error metrics and other metrics.
- a user can search by analyst or company (by ticker, company name, CUSIP, or unique ticker), and aggregate by ticker, broker and broker/ticker—or analyst, broker, and broker/analyst, respectively. Results are displayed in a grid containing various error metrics; sort by any column head with a click on the title. Graphic display of performance on a color chart.
- a hierarchical sorting facility lets a user group summary or detail search results. Detail search results can be saved for further analysis.
- FIG. 24 An overview of FIG. 24 is described below.
- the user can select a security for which to search.
- the user has elected to aggregate results by analyst.
- the user can update search criteria at the top of the screen: Number and type of prior Fiscal Periods in Periods area 3310 , “As Of Date” in Date area 3320 and a time frame in Evaluation area 3330 .
- the invention will update the Summary Grids 3360 based on the new criteria. For the selected “As Of Date,” summary metric details will appear at Summary area 3340 .
- the user can aggregate the findings in Aggregation area 3380 by selecting Analyst, Broker, or Broker+Analyst.
- the Summary Grid 3360 will update accordingly.
- the user can select an analyst (e.g., D. Young) for further study in Data Screen 3390 .
- the user can examine the detailed calculations that created them. Details behind selected summary calculations appear in Data Screen 3390 .
- the user can rearrange the detail grid by moving its column headings. The user can right-click on a detail line for further options.
- a user can aggregate the summary information by analyst, broker, or a combination of the two.
- a summary line e.g., an analyst
- a complete range of error metrics is displayed in the Data Screen 3390 for further analysis.
- One example of the significance of the aggregation feature is typified when an analyst switches from one brokerage firm to another. If a user selects to aggregate by analyst, all of the analyst estimates regardless of which brokerage team the analyst is affiliated with at the time the estimates is made may be sampled. In other circumstances, a user may wish to aggregate by broker, particularly if the user is trying to discern any pattern or trends with respect to broker bias with respect to a particular security.
- the ability to aggregate by broker/analyst pair is also a useful and powerful tool in that users may determine different historical performance characteristics for a particular broker/analyst pair. For example, if a particular analyst moves from one brokerage to another, any institutional bias that creeps into the analyst's estimates may be more readily discerned.
- FIGS. 24-26 illustrate examples of performance screens and historical performance data where data related to the selected ticker or analyst may be aggregated by analyst (FIG. 24 ); broker (FIG. 25 ); or broker and analyst combination (FIG. 26 ). Other views are also available.
- the Performance module in Navigator 210 the user may view the performance of particular analysts, brokers, and other combinations. For example, the user may select a particular security (e.g., as shown AAPL) in Search area 3370 .
- the user may select the number and type of fiscal periods to be analyzed as well as the type of fiscal periods, such as quarterly estimates or fiscal year estimates, in Periods area 3310 .
- the user may select the “As Of Date” in Date area 3320 . Other options may be applicable to other securities.
- the number of prior fiscal periods enable a user to specify over how many periods the data should be viewed prior to the “As Of Date.” For example, the user may set the numbers sufficiently high to enable a meaningful sampling of periods. However, the flexibility provided enables the user to review as many or as few periods as desired.
- the “As Of Date” enables the user to specify a cut-off period for an individual performance analysis.
- Evaluation Area 3330 Another useful feature that provides flexibility is the Evaluation Area 3330 .
- a user may elect the time frame prior to the reporting dates over which to view data.
- the evaluation area goes from a beginning date selected by the user of 9 month to an end date selected by the user of 12 months. Therefore, in this case, estimates from 9 to 12 months prior to the report date will be analyzed. This enables a user to analyze performance by selected time bins to see if some analyst's are more accurate farther out or closer in to when estimates are reported.
- the user may view summary data information in Summary area 3340 .
- This information may include, for example, Average Absolute Error, Average Relative Error percentage, and other relevant summary information.
- a Summary Metric box (not shown) may enable a user to select summary metrics to be displayed (e.g., it may be set to Relative Error percentage).
- the “As Of Date,” a ticker and the aggregation method various information may be displayed, preferably on a single screen.
- each analyst with estimates satisfying the criteria specified by the user for a given security are displayed in Aggregation Display 3360 .
- a user may select one to obtain more detailed information in Aggregation Display 3360 .
- analyst “The Young D” is selected, as shown highlighted.
- the detailed data for “The Young D” is simultaneously displayed under a Data Screen 3390 .
- Period End Date Actual Reported Eamings/Share
- Period Number Error in Dollars
- Absolute Error in Dollars Absolute Error in Dollars
- Bias Error Percentage Relative Error Percentage
- Analyst's follow percentage for the selected ticker, Relative Error Percentile, Error Percentile, and other information.
- the period end date the number of previous periods
- earnings information e.g., actual
- the user may elect to aggregate by broker in Aggregate area 3380 .
- a list of brokers for the selected ticker is displayed in Aggregation Display 3360 .
- By selecting a broker detailed data for that broker is displayed in Data Screen 3390 .
- the user may elect to aggregate by broker and analyst pair in Aggregate area 3380 .
- a list of broker and analyst pairs for the selected ticker is displayed in Aggregation Display 3360 .
- By selecting a specific pair, detailed information for that pair is displayed in Data Screen 3390 .
- Some of advantages of the features discussed above are that it enables a user to view performance data over one or a number of periods.
- the user may view aggregate metrics over those periods and/or metrics on each period individually.
- the user can select the stock and see each contributor (analyst, broker or analyst/broker pair) who has estimated earnings for this stock in the selected fiscal periods (e.g., the last 3 fiscal years).
- each contributor is summary or aggregate performance measures. If the user clicks on one of the contributors for selected stock, the graphical user interface displays the contributor's period by period performance for that stock for each of the periods in the designated set of periods.
- FIG. 27 is a block diagram illustrating a security analyst performance tracking and analysis system according to one preferred embodiment.
- FIG. 27 shows, in a broad sense, the data flow occurring within said system during a typical query for an analyst estimate comparison according to one embodiment.
- the Global Analyst Data Object downloaded from the Originating Storing Object is typically comprised of numerous files and fields relating to historical data relevant to analyst earnings estimates and recommendations.
- An example of such a historical database is that maintained by financial information services provider IBES.
- IBES's database known as the Daily Detail Earnings Estimate History, contains more than ten years of analyst estimate forecasts, compiled from data obtained from more than 200 brokerage houses and more than 2000 individual analysts, for United States companies.
- These files and fields contain both general and specific information on analyst estimates and related data including, but not limited to, information pertaining to financial instrument type and related identification codes, broker and analyst identification, industry groupings, and detailed information on such variables as the prices of particular securities on specific dates.
- a Global Analyst Data Object may be used which contains analyst data pertaining not only to stocks publicly traded in the United States, but also international stocks and any other type of financial instrument currently in existence or created in the future.
- the database files are manipulated and otherwise processed such that they are restructured according to predetermined data fields, thereby creating a Restructured Analyst Data Object.
- each analyst earnings estimate and recommendation is restructured to have a number of predetermined data fields.
- the data comprising the Restructured Analyst Data Object will preferably reside on a server in a computer network.
- a user Using a computer terminal or other similar input device, a user will be able to access and utilize the application Module comprising the software for the present invention.
- This Module may or may not reside on the computer terminal operated by the user.
- a predetermined system database may be constructed such that each analyst estimate record in the database contains unique fields related to that estimate.
- these records may contain a combination of data fields present within a Global Analyst Data Object obtained from the FISP and data fields unique to and created within the system of the present invention.
- the typical system database record may maintain the number of days by which an analyst's earnings estimate precedes a particular earnings event, such as a company's quarterly or annual earnings postings.
- a particular earnings event such as a company's quarterly or annual earnings postings.
- the accuracy of an estimate made shortly before an earnings event is likely to be more accurate than an earnings estimate made months prior to the earnings event. In this way, users may make meaningful and valuable comparisons between analyst estimates for any number of given time periods preceding a particular earnings event.
- the database of the present invention may also contain and maintain indices for predetermined data relationships and predetermined analyst performance metrics for a plurality of analysts, such as time series estimates and summary measures of those estimates. Accordingly, by utilizing this restructured database, a user will be able to both rank and analyze the performance of a plurality of analysts based upon any metric. Moreover, based on the data contained in the system database, the present invention allows for the rapid visualization of the analyses of analysts' earnings estimates and buy-sell recommendations.
- historical data accessed from the Originating Storing Object is stored on the Restructured Analyst Data Object in addition to pre-calculated analyst-performance metrics derived from the Originating Storing Object.
- the Retrieving Object preferably selectively delivers proprietary data only to those terminals having a license for the proprietary Originating Storing Object data.
- the Retrieving Object preferably delivers only the pre-calculated analyst performance metrics derived from the Originating Storing Object to those terminals not having a license for the proprietary data.
- a user may access and query the Restructured Analyst Data Object to perform any one of the numerous functions able to be performed by the present invention.
- the pre-calculated data may comprise error metrics for securities predictions for earnings estimates and recommendations.
- the rows of the database are grouped into contributors, including analysts, brokers, and combinations thereof, and further divided into a predetermined number of time segments. A possible composition for the number of time segments.
- Error metrics may comprise various metrics including a raw error indicator (analyst estimate minus the actual earnings for a particular event), error percent to actual earnings, percent available (percent of time that an analyst had an estimate or recommendation available in the relevant time frame), error percent to consensus, and the number of days between the estimate of an event and the actual event, for example.
- Average error metrics may also be stored. Table 1 below provides one embodiment of average error metrics that may be maintained as well as other metrics that may be stored.
- Hits A Hit is a Swing that is closer to the actual than — Positive the consensus. Integer or 0 If
- Abs Err $ The absolute value of Error $ at a point in time.
- Bias Error Percentage If Consensus>Actual, then Bias Error equals Relative Error %, else it is 0. If Consensus ⁇ Actual, then Bias Error equals Relative Error %, else it is 0.
- Swings often, major revisions (N Std Dev away from consensus) occur simultaneously for multiple analysts. For example, this may be the case when a company reports a large earning surprise or issues a warning about upcoming growth. “Swings,” which are bold estimates that differ greatly from the consensus, are differentiated from major revisions that occur concurrently with, or near to, major revisions from other analysts. To achieve this, the system may measure whether an analyst estimate or revision is N standard deviations away from the consensus N (typically 5) days after the day the analyst's estimate was made. Swings may be measured over the 24 months prior to the report date. Unlike other error metrics which are calculated by sampling (continued) estimates over an interval and computing the corresponding average error, Swings may be determined by considering only the actual estimates or revisions. The default number of Std Dev is 1.5.
- Hit Percent A hit is a swing that proves to be closer to the actual than the consensus at N days after the date of the swing.
- Total Estimates The total number of estimates made by the analyst in the prior 24 months for the event. Confirmations are not included. An estimate pre-existing exactly 24 months prior to the report are counted in the total.
- MTBR Green Time between Revisions—Measures frequency of analyst revision in the year prior to the report date. Equals the number of days in which there was an active estimate in the year prior to the report date divided by the Total Estimates.
- Best Error The value of the analyst's lowest RelErr % at the corresponding Best Date.
- a lead lag score may be provided.
- Table 4 represents calculations with the following understanding: Co represents the consensus on the day of the estimate in question, C 1 represents the consensus on the n-th day prior to the day of the estimate in question, and C 2 represents the consensus on the n-th day following the day of the estimate in question. These conditions are considered in this order to determine if an estimate is leading, lagging, or neither:
- the LeadLagFactor is the number of Leading estimates minus the number of Lagging over the total estimates. If all estimates were lagging, the LeadLagFactor may be assigned a value of ⁇ 1.0. If all estimates were leading, the LeadLagFactor may be assigned a value of +1.0. If all estimates were “neither” or if the number of Leading Estimates equals the number of Lagging estimates, the LeadLagFactor may be assigned a value of 0.0. Estimates already current at 24 months prior to the report date may not be included.
- LeadLagScore Leads - Lags TotalEstimatesForAnalyst
- FIGS. 31-33 depict an example of one purpose between the two different types of error calculation.
- two analysts have made predictions concerning the earnings of a particular security. Their predictions, in dollars, are shown on the y-axis where $ 0 is the actual earnings, whereas the time at which the analysts made their predictions is shown along the x-axis.
- the difference between each of the depicted adjacent markings on the y-axis is equal to $, and the difference between each of the depicted x-axis markings is equal to T.
- the first analyst initially (t 0 ) predicted above the actual earnings by $ 2 , and at time t 1 modified the prediction to an estimate below ( ⁇ $ 2 ) the actual earning.
- the second analyst predicted earnings slightly below the actual earnings for the entire period shown.
- FIG. 32 which highlights the error associated with the first analyst's predictions, it is shown that the first analyst has an average error equal to zero because the extent of the overestimate is approximately equal to the extent of the underestimate.
- This raw error metric is preferably calculated as follows: ⁇ t0 tn ⁇ ⁇ ( Estimate - Actual )
- the overestimate is found to be ($ 2 ⁇ $ 0 )*(t 1 ⁇ t 0 ) or 2$T and the underestimate is found to be ( ⁇ $ 2 ⁇ $ 0 )*(t 2 -t 1 ) or ⁇ 2$T. Accordingly, the first analyst would receive a raw error of 0 and would accordingly be given no adjustment factor.
- the weighting factor the following equation which represents the absolute error metric, is preferably used: ⁇ t0 tn ⁇ ⁇ ⁇ ( Estimate - Actual ) ⁇
- the relative error metric shows how a particular analyst performed in relation to the other analysts who were tracking a particular security over the analyzed period of time.
- the purpose of utilizing the actual earnings in the denominator of a preferred embodiment is to enable errors to be normalized so that comparisons can be made across different securities. Because small actual earnings can lead to exaggerated errors, it is possible to establish a minimum actual value, for purposes of this error metric, to prevent such exaggerated errors. For example, if the actual earnings were 0, then any analyst tracking the security would have an infinite error, so a value of, for example, $0.40 could be used to provide useful information from the analysis.
- a user may rank, measure, and analyze the historical accuracy of a single or plurality of analysts' buy-sell recommendations in various ways.
- a user may control and otherwise define how recommendation descriptions used by a plurality of analysts are normalized and otherwise translated into scaled recommendation numbers.
- FISPs such as First Call translate and otherwise normalize the recommendation descriptions of the numerous analysts to a scale ranging from 1 to 5, with the following descriptions: 1 (buy), 2 (buy/hold), 3 (hold), 4 (hold/sell), and 5 (sell). The FISPs then calculate an average recommendation by calculating the mean of all analysts' current recommendations as translated to this 1 to 5 scale.
- relatively recent recommendation upgrades or downgrades may be assigned a relatively high weighting factor while older recommendations may receive a weight of zero.
- an improved custom composite recommendation may be determined which more accurately reflects the action (e.g., buy, sell, hold etc.) that a user should take with respect to a security.
- a user may control the recommendation normalization process, if so desired, to replace the normalization performed by an FISP.
- a user will have the ability to measure the historical profitability of a single or plurality of analysts' recommendations. For example, a user may create a graph illustrating the average percent error of an analyst's recommendation as compared to the average recommendation.
- Users will also have the ability to create and test portfolio creation rules. Specifically, a user may choose a security and then set up purchase and/or selling instructions that the system will make automatically. For example, a user can instruct the system to purchase a security when a specific analyst issues a recommendation of “2,” double his investment if the recommendation is upgraded to “1,” and sell all or a certain percentage of the security if and when the analyst downgrades his recommendation to “3” or lower.
- FIG. 34 provides an example of a scatterplot graph created with the present invention. This scatterplot is generated using the following equation: ⁇ t0 tn ⁇ BiasError
- bias error is equal to relative error if relative error is greater than the consensus error. If the relative error is less than the consensus error, then the bias error is assigned a value of zero over the selected time period.
- the consensus error is calculated the same as raw error is icalculated for an individual analyst, except that the consensus estimate is used instead of the analyst's estimate. The bias error is useful in determining how consistently a given analyst or group of analysts outperforms the consensus for a particular security.
- Another option available in a preferred embodiment is the ability to exclude one or more analysts. For example, if a particular analyst had an extreme error during a period of analysis that a user is evaluating, then the consensus error might be too reflective of that individual analyst's error. Accordingly, a majority of analysts may have bias errors approximately equal to zero which indicates that they are outperforming the consensus estimate. If a user wants to filter out an analyst's estimate for this or any other reason, it is possible to exclude the analyst's estimate from a particular metric analysis.
- the leadlag Factor is calculated as follows: ( Leads - Lags ) TotalEstimates
- leads is the number of times that an analyst makes an estimate revision before the majority of the analysts following a particular security
- lags is the number of times that an analyst makes an estimate revision after the majority of the analysts following a particular security
- total estimates represents the number of predictions that the analyst has made.
- a user may select a leadlag factor based on a number of different variables, including which securities, which analysts, which time periods, or any combination thereof.
- a hit percent is an evaluation of the number of times that an analyst successfully revises earnings.
- a swing is preferably an estimate that is outside a predetermined standard deviation of the mean of the consensus estimate.
- a predetermined standard deviation of the consensus estimate is approximately 1.5.
- a hit is preferably a swing in which the analyst's estimate is closer to the actual earnings than the consensus estimate.
- a hit percent can then be determined by dividing the number of hits by the number of swings, and multiplying the result by 100%.
- the system may provide the user with the option of viewing a large amount of information in a variety of different formats.
Abstract
Description
| ANALYST | |||
| N-SCORE BY | FACTOR WEIGHT | ||
| FACTOR | ANALYST | FACTOR (N) | (W) |
| F1 | A1: | N1 = 0.7 | F1W = 0.6 |
| A2: | N2 = 0.2 | ||
| A3: | N3 = 0.1 | ||
| F2 | A1: | N1 = 0.5 | F2W = 0.3 |
| A2: | N2 = 0.5 | ||
| A3: | N3 = 0.5 | ||
| F3 | A1: | N1 = 1.0 | F3W = 0.1 |
| A2: | N2 = 1.0 | ||
| A3: | N3 = 1.0 | ||
| TABLE 1 | |||||||||
| Not pre-calculated | Comparable(across | ||||||||
| (Calculated on-the- | stocks, time | ||||||||
| Event | 0-3 | 3-6 | 6-12 | 0-12 | 0-24 | fly) | periods) | ||
| Avg-Error $ | X | X | X | X | X | |||
| Avg-Abs Err $ | X | X | X | X | X | |||
| Avg-Abs Err %ile | X | X | X | X | X | X | ||
| Avg-Error % | X | X | X | X | X | X | ||
| Avg-Abs Err % | X | X | X | X | X | X | ||
| Avg-Rel Error % | X | X | X | X | X | X | ||
| Avg-Bias Error % | X | X | X | X | X | X | ||
| Actual-Divisor (for % | X | |||||||
| calcs) | ||||||||
| Swings | X | X | ||||||
| Hit % | X | X | ||||||
| Total Estimates | X | |||||||
| Follow % | X | X | X | X | X | X | ||
| LeadLagScore | X | X | ||||||
| MTBR | X | X | ||||||
| Best Date | X | |||||||
| Best Error (Rel Err %) | X | |||||||
| Year first followed | X | |||||||
| TABLE 2 | |||||
| Formula | Range | Analyzing | Characteristic | ||
| Error $ |
 |
Any | Closer to 0 is better | Error in dollars and cents |
| Abs Error $ |
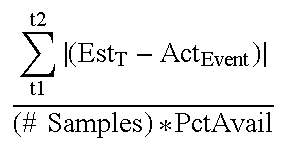 |
0 to Any | Closer to 0 is better. | Absolute Value of Error in $ and cents. When average is taken over interval, negative and positive errors do not cancel out preserves magnitude of error but not sign. |
| Rel Error Pct |
 |
Any | Larger negative Numbers are better | Error Compared to the Consensus Error |
| Bias Error | If analyst's estimate is further from the | Any. Usually a | Closer to 0 is | Relative Error % only |
| Percent | actual than the consensus estimate is, then | low number | better. | if the Analyst is further |
| Biaserror = Relative Error % | from the actual than | |||
| Else | the consensus. | |||
| Biaserror = 0 | ||||
| Average Bias Error % | ||||
| For period t1 . . . t2 = | ||||
 |
||||
| TABLE 3 | ||||
| Formula | Analysis | Range | ||
| Leadlag Factor |
 |
Closer to 1 is better 1 = Always Leads, −1 Always Lags | −1.0 to +1.0 |
| Swings | A Swing is defined as an estimate that satisfies this | Many swings indicate that | Positive |
| (i.e., number of times in period | equation | analyst is willing to express | Integer, |
| that analyst “stuck neck out” more than [SwingStdDevs = 1.5] standard deviations away from the |
 |
an opinion independent from the pack. (It does not indicate quality.) A low | Or 0. |
| consensus as measured [n = 5] days | Defaults | number of swings may | |
| after estimate date T.) | SwingStdDevs = 1.5 and N = 5 | indicate an analyst that | |
| follows the pack. | |||
| Hits | A Hit is a Swing that is closer to the actual than | — | Positive |
| the consensus. | Integer or 0 | ||
| If |Estt − Act| < |Const+N − Act| Then Hit | |||
| Else Miss | |||
| Hit Percent |
 |
100% indicates all |
0-100% |
| MTBR - Mean Time Between Revisions |
 |
Average in our current database is 89.1 days | 0-365 days |
| TABLE 4 | ||||
| # | Condition | Formula | Picture | Classified as |
| 1 | Change in consensus, from n days prior to n days flowing estimate, must be at least Min %, (default = 5%). Else “neither” |
 |
Else Neither | |
| 2 | Consensus change prior to the estimate | (C2 > C1) AND (C2 >= C0) | Else | |
| must not be different in direction from | OR | Neither | ||
| change after the estimate. | (C2 < C1) AND (C2 <= C0) | |||
| 3 | Number of Estimates/Revs Between [t − n to t + n] minus [# estimates at t] >= 2 |
 |
Else Neither | |
| 4 | If the Number of Estimates prior to the Estimate Date in the time frame are greater than the number of estimates after the report date in the time frame. Then this estimate is a lagging estimate |
 |
Lagging | |
| 5 | If the Number of Estimates prior to the Estimate Date in the time frame are less than the number of estimates after the report date in the time frame. Then this estimate is a Leading estimate |
 |
Leading | |
| 6 | If the Number of Estimates prior to the Estimate Date in the time frame are equal to the number of estimates after the report date in the time frame. Then this estimate is neither a leading nor lagging estimate. |
 |
Neither | |


Claims (38)
Priority Applications (1)
| Application Number | Priority Date | Filing Date | Title |
|---|---|---|---|
| US09/577,317 US6681211B1 (en) | 1998-04-24 | 2000-05-24 | Security analyst estimates performance viewing system and method |
Applications Claiming Priority (4)
| Application Number | Priority Date | Filing Date | Title |
|---|---|---|---|
| US8286898P | 1998-04-24 | 1998-04-24 | |
| US09/296,620 US6510419B1 (en) | 1998-04-24 | 1999-04-23 | Security analyst performance tracking and analysis system and method |
| US09/524,253 US7167838B1 (en) | 1998-04-24 | 2000-03-13 | Security analyst estimates performance viewing system and method |
| US09/577,317 US6681211B1 (en) | 1998-04-24 | 2000-05-24 | Security analyst estimates performance viewing system and method |
Related Parent Applications (1)
| Application Number | Title | Priority Date | Filing Date |
|---|---|---|---|
| US09/524,253 Division US7167838B1 (en) | 1998-04-24 | 2000-03-13 | Security analyst estimates performance viewing system and method |
Publications (1)
| Publication Number | Publication Date |
|---|---|
| US6681211B1 true US6681211B1 (en) | 2004-01-20 |
Family
ID=30003660
Family Applications (2)
| Application Number | Title | Priority Date | Filing Date |
|---|---|---|---|
| US09/524,253 Expired - Lifetime US7167838B1 (en) | 1998-04-24 | 2000-03-13 | Security analyst estimates performance viewing system and method |
| US09/577,317 Expired - Lifetime US6681211B1 (en) | 1998-04-24 | 2000-05-24 | Security analyst estimates performance viewing system and method |
Family Applications Before (1)
| Application Number | Title | Priority Date | Filing Date |
|---|---|---|---|
| US09/524,253 Expired - Lifetime US7167838B1 (en) | 1998-04-24 | 2000-03-13 | Security analyst estimates performance viewing system and method |
Country Status (1)
| Country | Link |
|---|---|
| US (2) | US7167838B1 (en) |
Cited By (98)
| Publication number | Priority date | Publication date | Assignee | Title |
|---|---|---|---|---|
| US20010039526A1 (en) * | 2000-03-17 | 2001-11-08 | Pittenger Robert C. | Securities grading system |
| US20020004774A1 (en) * | 2000-03-27 | 2002-01-10 | Tony Defarlo | Data analysis system for tracking financial trader history and profiling trading behavior |
| US20020007332A1 (en) * | 2000-06-27 | 2002-01-17 | Asf-Ip, Inc. | Method and system for evaluation of potential funding sources for financial plans |
| US20020010606A1 (en) * | 1998-04-08 | 2002-01-24 | Hitachi, Ltd. | Freight information management method and freight management system using electronic tags |
| US20020128939A1 (en) * | 2000-12-22 | 2002-09-12 | Tarrant Jeffrey G. | Method and system for sharing investor information over an electronic network |
| US20020133447A1 (en) * | 2001-01-12 | 2002-09-19 | Smartfolios, Inc. | Computerized method and system for formulating stock portfolios |
| US20030014395A1 (en) * | 2001-07-12 | 2003-01-16 | International Business Machines Corporation | Communication triggered just in time information |
| US20030065604A1 (en) * | 2001-10-03 | 2003-04-03 | Joseph Gatto | Methods and systems for measuring performance of a security analyst |
| US20030065605A1 (en) * | 2001-10-03 | 2003-04-03 | Joseph Gatto | Methods and systems for measuring performance of a security analyst |
| US20030105699A1 (en) * | 2001-12-03 | 2003-06-05 | Richard Redpath | Technique for calculating and displaying securities options data to produce a visual pattern of potential future values |
| US20030110120A1 (en) * | 2001-12-06 | 2003-06-12 | Salehi James D. | Method and system for displaying price charts |
| US20040039683A1 (en) * | 2000-10-27 | 2004-02-26 | Mcgeorge Jeffrey Bruce | Trading system |
| US20040049518A1 (en) * | 2001-10-22 | 2004-03-11 | Finlab Sa | Historical data recording and visualizing system and method |
| US20040138998A1 (en) * | 2002-11-14 | 2004-07-15 | David Lawrence | Independent research consensus earnings estimates and methods of determining such |
| US20040179011A1 (en) * | 2003-03-14 | 2004-09-16 | Marshall James F. | Data display method and system |
| US20040243527A1 (en) * | 2003-05-28 | 2004-12-02 | Gross John N. | Method of testing online recommender system |
| US20040244029A1 (en) * | 2003-05-28 | 2004-12-02 | Gross John N. | Method of correlating advertising and recommender systems |
| US20040249868A1 (en) * | 2001-11-14 | 2004-12-09 | Shi-Hui Tsai | Method and system for estimating exportation time |
| US20040254870A1 (en) * | 2003-06-16 | 2004-12-16 | Chitaley Ani D. | Predicting a future price range for a desired volume |
| US20050004283A1 (en) * | 2003-04-15 | 2005-01-06 | Jutta Lindemann | (Meth)acrylate resins and their use |
| US6876955B1 (en) * | 2001-12-28 | 2005-04-05 | Fannie Mae | Method and apparatus for predicting and reporting a real estate value based on a weighted average of predicted values |
| US20050080695A1 (en) * | 2003-10-09 | 2005-04-14 | Gatto Joseph G. | System and method for facilitating the selection of security analyst research reports |
| US20050108025A1 (en) * | 2003-11-14 | 2005-05-19 | First American Real Estate Solutions, L.P. | Method for mortgage fraud detection |
| US20050137963A1 (en) * | 1999-05-20 | 2005-06-23 | Ameritrade Holding Corporation | Stock purchase indices |
| US20050171822A1 (en) * | 2004-02-03 | 2005-08-04 | First American Real Estate Solutions, L.P. | Responsive confidence scoring method for a proposed valuation of aproperty |
| US20050187855A1 (en) * | 2004-02-20 | 2005-08-25 | Brennan David P. | Method for analyzing trade data |
| US20050203896A1 (en) * | 2004-03-05 | 2005-09-15 | Weild David Iv | Analyst search engine method and system |
| US20050261999A1 (en) * | 2004-05-20 | 2005-11-24 | Rowady E P Jr | Event-driven financial analysis interface and system |
| US20050267824A1 (en) * | 2004-05-28 | 2005-12-01 | Hurewitz Barry S | Matching resources of a securities research department to accounts of the department |
| US20050289038A1 (en) * | 2004-06-28 | 2005-12-29 | Alexander Karapetian | Method and system for voting for a future price of an asset |
| US20060010053A1 (en) * | 2004-07-12 | 2006-01-12 | Pension Builders And Consultants | Asset allocation based system for individual investor portfolio selection |
| US20060015357A1 (en) * | 2004-07-16 | 2006-01-19 | First American Real Estate Solutions, L.P. | Method and apparatus for spatiotemporal valuation of real estate |
| US20060015425A1 (en) * | 2004-07-15 | 2006-01-19 | Brooks Kent F | System and method for providing customizable investment tools |
| WO2006010044A2 (en) * | 2004-07-09 | 2006-01-26 | Gapyx, Llc | System and method for behavioral finance |
| US20060041456A1 (en) * | 2004-05-28 | 2006-02-23 | Hurewitz Barry S | Systems and method for determining the cost of a securities research department to service a client of the department |
| US20060059075A1 (en) * | 2004-09-10 | 2006-03-16 | Hurewitz Barry S | Systems and methods for auctioning access to securities research resources |
| US7028006B1 (en) * | 2000-10-03 | 2006-04-11 | Pricemetrix, Inc. | Peer based doctrine performance framework |
| US20060080140A1 (en) * | 2004-02-09 | 2006-04-13 | Epic Systems Corporation | System and method for providing a clinical summary of patient information in various health care settings |
| US20060085234A1 (en) * | 2004-09-17 | 2006-04-20 | First American Real Estate Solutions, L.P. | Method and apparatus for constructing a forecast standard deviation for automated valuation modeling |
| US20060116943A1 (en) * | 2004-11-30 | 2006-06-01 | Pascal Willain | Method to determine price inflections of securities |
| US20060161493A1 (en) * | 1999-06-18 | 2006-07-20 | Thomson Financial, Inc. | System, method and computer readable medium containing instructions for evaluating and disseminating investor performance information |
| US20060161472A1 (en) * | 2004-12-30 | 2006-07-20 | Weild David Iv | Method and system for ranking research providers |
| US20060161448A1 (en) * | 2004-12-30 | 2006-07-20 | The National Research Exchange | Method and system for rating / ranking third parties |
| US20060190316A1 (en) * | 2004-12-31 | 2006-08-24 | Dankowych John A | Computer based system and method for gathering and processing scientific project data |
| US20060218179A1 (en) * | 2005-03-25 | 2006-09-28 | The Motley Fool, Inc. | System, method, and computer program product for scoring items based on user sentiment and for determining the proficiency of predictors |
| US20060229962A1 (en) * | 2005-04-08 | 2006-10-12 | Hiskett Herbert C | Evaluation of securities |
| US20060265365A1 (en) * | 2002-05-31 | 2006-11-23 | Microsoft Corporation | System and method for collecting and storing event data from distributed transactional application |
| US20060271469A1 (en) * | 2000-11-03 | 2006-11-30 | Lehman Brothers Inc. | Tool for estimating a cost of a trade |
| US20060271472A1 (en) * | 2005-05-24 | 2006-11-30 | First American Real Estate Solutions, L.P. | Method and apparatus for advanced mortgage diagnostic analytics |
| US20070011073A1 (en) * | 2005-03-25 | 2007-01-11 | The Motley Fool, Inc. | System, method, and computer program product for scoring items based on user sentiment and for determining the proficiency of predictors |
| US7171384B1 (en) * | 2000-02-14 | 2007-01-30 | Ubs Financial Services, Inc. | Browser interface and network based financial service system |
| US20070033122A1 (en) * | 2005-08-04 | 2007-02-08 | First American Real Estate Solutions, Lp | Method and apparatus for computing selection criteria for an automated valuation model |
| US20070033126A1 (en) * | 2005-08-05 | 2007-02-08 | Cagan Christopher L | Method and system for updating a loan portfolio with information on secondary liens |
| US20070043650A1 (en) * | 2005-08-16 | 2007-02-22 | Hughes John M | Systems and methods for providing investment opportunities |
| US20070136124A1 (en) * | 2005-12-12 | 2007-06-14 | United Technologies Corporation | Method, program, and system for conducting trade studies and evaluation activities |
| US7249042B1 (en) * | 2000-11-01 | 2007-07-24 | Microsoft Corporation | Method and system for visually indicating project task durations are estimated using a character |
| US7333951B1 (en) * | 2000-03-20 | 2008-02-19 | Charles Schwab & Co. | Method and system for building and maintenance watch lists |
| US7337135B1 (en) * | 2000-07-13 | 2008-02-26 | C4Cast.Com, Inc. | Asset price forecasting |
| US20080221958A1 (en) * | 2007-03-07 | 2008-09-11 | Microsoft Corporation | Techniques to manage information for dynamic reports using time periods for a business model |
| US20080228804A1 (en) * | 2007-03-15 | 2008-09-18 | Accenture Global Services Gmbh | Presentation of information elements in an analyst network |
| US20080256102A1 (en) * | 2007-04-16 | 2008-10-16 | Hewlett-Packard Development Company, L.P. | Apparatus and Method for Processing Management Information |
| US20090006268A1 (en) * | 2007-06-26 | 2009-01-01 | Wall Street On Demand | Computer-based method for teaming research analysts to generate improved securities investment recommendations |
| US20090077059A1 (en) * | 2007-09-19 | 2009-03-19 | Torres Robert J | Method and apparatus for linkage of quantitative and qualitative textual, audio, visual and other information searches to metric displays |
| US20090186689A1 (en) * | 2008-01-21 | 2009-07-23 | Hughes John M | Systems and methods for providing investment opportunities |
| US20100049664A1 (en) * | 2008-08-21 | 2010-02-25 | Yi-Hsuan Kuo | Method and system for user-defined alerting of securities information |
| US20100067029A1 (en) * | 2003-03-14 | 2010-03-18 | Marshall James F | Colored investment data display system and method |
| US7729965B1 (en) | 2005-04-26 | 2010-06-01 | Fannie Mae | Collateral valuation confidence scoring system |
| US7739164B1 (en) * | 2003-10-07 | 2010-06-15 | Trading Technologies International, Inc. | System and method for displaying risk data in an electronic trading environment |
| US7752118B1 (en) * | 2003-10-07 | 2010-07-06 | Trading Technologies International, Inc. | System and method for risk grid display in an electronic trading environment |
| US7752112B2 (en) | 2006-11-09 | 2010-07-06 | Starmine Corporation | System and method for using analyst data to identify peer securities |
| US7765125B1 (en) | 2005-01-12 | 2010-07-27 | Fannie Mae | Trunk branch repeated transaction index for property valuation |
| US20100191663A1 (en) * | 2003-05-28 | 2010-07-29 | Gross John N | Method of testing item availability and delivery performance of an e-commerce site |
| US7769654B1 (en) | 2004-05-28 | 2010-08-03 | Morgan Stanley | Systems and methods for determining fair value prices for equity research |
| US7783547B1 (en) | 2004-12-10 | 2010-08-24 | HedgeCity Corporation | System and method for determining hedge strategy stock market forecasts |
| US20100218136A1 (en) * | 2004-05-13 | 2010-08-26 | Scottrade, Inc. | Method and Apparatus for User-Interactive Financial Instrument Trading |
| US7822691B1 (en) | 2001-12-28 | 2010-10-26 | Fannie Mae | Method for determining house prices indices |
| US7831492B1 (en) | 2005-01-12 | 2010-11-09 | Fannie Mae | Multiple transaction property valuation |
| US20100312613A1 (en) * | 2003-05-28 | 2010-12-09 | Gross John N | Method of evaluating learning rate of recommender systems |
| US7877309B2 (en) | 2004-10-18 | 2011-01-25 | Starmine Corporation | System and method for analyzing analyst recommendations on a single stock basis |
| US20110078059A1 (en) * | 2009-09-30 | 2011-03-31 | Royal Bank Of Canada | System and method for monitoring securities holdings for related entities |
| US7930254B1 (en) | 2005-08-05 | 2011-04-19 | Fannie Mae | Property value estimation using feature distance from comparable sales |
| US7953652B1 (en) | 2006-06-12 | 2011-05-31 | Morgan Stanley | Profit model for non-execution services |
| US20110173135A1 (en) * | 2006-03-01 | 2011-07-14 | Realtick Llc | Methods and Systems for Risk Management |
| US7983925B1 (en) | 2001-12-31 | 2011-07-19 | Fannie Mae | Efficient computation method for determining house price indices |
| US8078522B1 (en) | 2007-03-09 | 2011-12-13 | Uat, Inc. | System and method for exchanging institutional research and trade order execution services |
| US8118654B1 (en) * | 2006-12-26 | 2012-02-21 | Jean-Francois Pascal Nicolas | Financial game with combined assets |
| US20120317053A1 (en) * | 2011-06-10 | 2012-12-13 | Benchmark Solutions Holdings, Inc. | Fixed income securities market data display |
| US8566146B1 (en) * | 2012-05-10 | 2013-10-22 | Morgan Stanley & Co. Llc | Computer-based systems and method for computing a score for contacts of a financial services firm indicative of resources to be deployed by the financial services firm for the contacts to maximize revenue for the financial services firm |
| US8662977B1 (en) * | 2006-12-26 | 2014-03-04 | Jean-Francois Pascal Nicolas | Multiple plays for free games |
| US8676921B1 (en) * | 2000-10-03 | 2014-03-18 | Nokia Corporation | Contextual mapping based learning by converting information |
| US8738388B1 (en) | 2005-01-12 | 2014-05-27 | Fannie Mae | Market based data cleaning |
| USD732565S1 (en) * | 2012-06-05 | 2015-06-23 | P&W Solutions Co., Ltd. | Display screen with graphical user interface |
| USD748661S1 (en) * | 2013-12-30 | 2016-02-02 | Emc Corporation | Display screen with graphical user interface |
| US9508101B1 (en) * | 2001-09-21 | 2016-11-29 | Google Inc. | Systems and methods for providing stock ticker information |
| USD811422S1 (en) * | 2016-01-22 | 2018-02-27 | Google Llc | Portion of a display screen with a graphical user interface |
| USD820288S1 (en) * | 2013-12-13 | 2018-06-12 | Kbc Advanced Technologies Plc | Display screen with graphical user interface |
| US20200034336A1 (en) * | 2015-05-18 | 2020-01-30 | Interactive Data Pricing And Reference Data Llc | Data conversion and distribution systems |
| US20220058513A1 (en) * | 2020-08-19 | 2022-02-24 | Accenture Global Solutions Limited | Veracity assessment of a data model |
Families Citing this family (19)
| Publication number | Priority date | Publication date | Assignee | Title |
|---|---|---|---|---|
| US6876991B1 (en) | 1999-11-08 | 2005-04-05 | Collaborative Decision Platforms, Llc. | System, method and computer program product for a collaborative decision platform |
| US7383219B1 (en) * | 2000-07-13 | 2008-06-03 | C4Cast.Com, Inc. | Asset portfolio tracking |
| US7962398B1 (en) * | 2000-09-15 | 2011-06-14 | Charles Schwab & Co. | Method and system for executing trades in a user preferred security |
| US7401039B1 (en) * | 2000-12-15 | 2008-07-15 | Ebay Inc. | Analytical tools for a community of investors having investment portfolios |
| US7818224B2 (en) * | 2001-03-22 | 2010-10-19 | Boerner Sean T | Method and system to identify discrete trends in time series |
| AU2002951706A0 (en) * | 2002-09-27 | 2002-10-17 | Pangaea Pty Ltd | A financial management system |
| US20040068456A1 (en) * | 2002-10-07 | 2004-04-08 | Korisch Semmen I. | Method of designing a personal investment portfolio of predetermined investment specifications |
| EP1563422A1 (en) * | 2002-10-30 | 2005-08-17 | Ran Zilberman | Electronic interpretation of financials |
| US20040249687A1 (en) * | 2003-06-09 | 2004-12-09 | Lowell James H. | System and method for evaluating investment fund manager performance |
| FI119535B (en) * | 2005-10-03 | 2008-12-15 | Pulse Finland Oy | Multiple-band antenna |
| FI119009B (en) * | 2005-10-03 | 2008-06-13 | Pulse Finland Oy | Multiple-band antenna |
| US7542939B2 (en) * | 2005-10-31 | 2009-06-02 | Penson Worldwide, Inc. | Modeling financial instruments using bid and ask prices |
| WO2008070024A1 (en) * | 2006-12-04 | 2008-06-12 | Penson Worldwide, Inc. | Real time trading of foreign financial instruments local currency |
| WO2008156777A2 (en) * | 2007-06-18 | 2008-12-24 | Penson Worldwide, Inc. | Order routing system and method incorporating dark pools |
| US8341065B2 (en) * | 2007-09-13 | 2012-12-25 | Microsoft Corporation | Continuous betting interface to prediction market |
| US8229824B2 (en) * | 2007-09-13 | 2012-07-24 | Microsoft Corporation | Combined estimate contest and prediction market |
| US7880741B2 (en) * | 2007-09-13 | 2011-02-01 | Microsoft Corporation | User interface for expressing forecasting estimates |
| FI124129B (en) * | 2007-09-28 | 2014-03-31 | Pulse Finland Oy | Dual antenna |
| US20100325031A1 (en) * | 2009-06-18 | 2010-12-23 | Penson Worldwide, Inc. | Method and system for trading financial assets |
Citations (44)
| Publication number | Priority date | Publication date | Assignee | Title |
|---|---|---|---|---|
| US3270190A (en) | 1962-10-01 | 1966-08-30 | Electronic Stock Evaluator Cor | Securities evaluator |
| US5006998A (en) | 1987-11-05 | 1991-04-09 | Hitachi, Ltd. | Computer system with easy input means for consultation |
| US5132899A (en) | 1989-10-16 | 1992-07-21 | Fox Philip J | Stock and cash portfolio development system |
| US5365425A (en) | 1993-04-22 | 1994-11-15 | The United States Of America As Represented By The Secretary Of The Air Force | Method and system for measuring management effectiveness |
| US5500795A (en) | 1992-07-30 | 1996-03-19 | Teknekron Infoswitch Corporation | Method and system for monitoring and controlling the performance of a call processing center |
| US5502637A (en) | 1994-06-15 | 1996-03-26 | Thomson Shared Services, Inc. | Investment research delivery system |
| US5608620A (en) | 1990-03-19 | 1997-03-04 | Lundgren; Carl A. | Method of eliciting unbiased forecasts by relating a forecaster's pay to the forecaster's contribution to a collective forecast |
| US5613072A (en) | 1991-02-06 | 1997-03-18 | Risk Data Corporation | System for funding future workers compensation losses |
| US5675746A (en) | 1992-09-30 | 1997-10-07 | Marshall; Paul S. | Virtual reality generator for use with financial information |
| US5749077A (en) | 1994-11-28 | 1998-05-05 | Fs Holdings, Inc. | Method and apparatus for updating and selectively accessing financial records related to investments |
| US5761442A (en) | 1994-08-31 | 1998-06-02 | Advanced Investment Technology, Inc. | Predictive neural network means and method for selecting a portfolio of securities wherein each network has been trained using data relating to a corresponding security |
| US5774880A (en) | 1992-06-10 | 1998-06-30 | Cantor Fitzgerald & Co., Inc. | Fixed income portfolio index processor |
| US5774881A (en) | 1995-10-30 | 1998-06-30 | Efi Actuaries | Method of determining optimal asset allocation utilizing asset cash flow simulation |
| US5802518A (en) | 1996-06-04 | 1998-09-01 | Multex Systems, Inc. | Information delivery system and method |
| US5812988A (en) | 1993-12-06 | 1998-09-22 | Investments Analytic, Inc. | Method and system for jointly estimating cash flows, simulated returns, risk measures and present values for a plurality of assets |
| US5819271A (en) | 1996-06-04 | 1998-10-06 | Multex Systems, Inc. | Corporate information communication and delivery system and method including entitlable hypertext links |
| US5852811A (en) | 1987-04-15 | 1998-12-22 | Proprietary Financial Products, Inc. | Method for managing financial accounts by a preferred allocation of funds among accounts |
| US5864871A (en) | 1996-06-04 | 1999-01-26 | Multex Systems | Information delivery system and method including on-line entitlements |
| US5893079A (en) | 1994-12-13 | 1999-04-06 | Fs Holdings, Inc. | System for receiving, processing, creating, storing, and disseminating investment information |
| US5909669A (en) | 1996-04-01 | 1999-06-01 | Electronic Data Systems Corporation | System and method for generating a knowledge worker productivity assessment |
| US5911136A (en) | 1987-04-15 | 1999-06-08 | Proprietary Financial Products, Inc. | System for prioritized operation of a personal financial account comprising liabilities and investment assets |
| US5918217A (en) | 1997-12-10 | 1999-06-29 | Financial Engines, Inc. | User interface for a financial advisory system |
| US5946666A (en) | 1996-05-21 | 1999-08-31 | Albert Einstein Healthcare Network | Monitoring device for financial securities |
| US5950176A (en) | 1996-03-25 | 1999-09-07 | Hsx, Inc. | Computer-implemented securities trading system with a virtual specialist function |
| US5948054A (en) | 1996-02-27 | 1999-09-07 | Sun Microsystems, Inc. | Method and system for facilitating the exchange of information between human users in a networked computer system |
| US5956691A (en) * | 1997-01-07 | 1999-09-21 | Second Opinion Financial Systems, Inc. | Dynamic policy illustration system |
| US5963922A (en) | 1996-02-29 | 1999-10-05 | Helmering; Paul F. | System for graphically mapping related elements of a plurality of transactions |
| US6012043A (en) | 1996-09-09 | 2000-01-04 | Nationwide Mutual Insurance Co. | Computerized system and method used in financial planning |
| US6012042A (en) | 1995-08-16 | 2000-01-04 | Window On Wallstreet Inc | Security analysis system |
| US6021397A (en) | 1997-12-02 | 2000-02-01 | Financial Engines, Inc. | Financial advisory system |
| JP2000090150A (en) | 1998-09-10 | 2000-03-31 | Cwl:Kk | Stock price estimation method and device using trend line |
| US6064986A (en) | 1997-09-23 | 2000-05-16 | Edelman Financial Services, Inc. | Computer assisted and/or implemented process and architecture for customer account creation, maintenance and administration for an investment and/or retirement program |
| US6119103A (en) * | 1997-05-27 | 2000-09-12 | Visa International Service Association | Financial risk prediction systems and methods therefor |
| US6125355A (en) | 1997-12-02 | 2000-09-26 | Financial Engines, Inc. | Pricing module for financial advisory system |
| US6154732A (en) | 1997-07-25 | 2000-11-28 | Guidedchoice.Com | System for providing investment advice and management of pension assets |
| US6236980B1 (en) | 1998-04-09 | 2001-05-22 | John P Reese | Magazine, online, and broadcast summary recommendation reporting system to aid in decision making |
| US6253192B1 (en) * | 1996-08-30 | 2001-06-26 | The Quantam Consultancy Group (Proprietary) Limited | Method of personal financial planning |
| WO2001080124A2 (en) | 2000-04-12 | 2001-10-25 | Thomson Financial Inc. | System, method and computer readable medium containing instructions for evaluating and disseminating securities analyst performance information |
| US6317726B1 (en) * | 1996-12-30 | 2001-11-13 | Netfolio, Inc. | Automated strategies for investment management |
| US20020019791A1 (en) | 2000-03-13 | 2002-02-14 | Goss Benjamin Mark | Electronic financial system |
| US20020022988A1 (en) | 1999-06-18 | 2002-02-21 | Columbus Craig E. | System, method and computer readable medium containing instructions for evaluating and disseminating securities analyst performance information |
| US6370516B1 (en) | 1998-03-16 | 2002-04-09 | John P Reese | Computer based device to report the results of codified methodologies of financial advisors applied to a single security or element |
| US20020082966A1 (en) | 1999-11-16 | 2002-06-27 | Dana Commercial Credit Corporation | System and method for benchmarking asset characteristics |
| US6510419B1 (en) | 1998-04-24 | 2003-01-21 | Starmine Corporation | Security analyst performance tracking and analysis system and method |
Family Cites Families (7)
| Publication number | Priority date | Publication date | Assignee | Title |
|---|---|---|---|---|
| US5819226A (en) | 1992-09-08 | 1998-10-06 | Hnc Software Inc. | Fraud detection using predictive modeling |
| US6064984A (en) * | 1996-08-29 | 2000-05-16 | Marketknowledge, Inc. | Graphical user interface for a computer-implemented financial planning tool |
| US5845285A (en) | 1997-01-07 | 1998-12-01 | Klein; Laurence C. | Computer system and method of data analysis |
| US6208720B1 (en) | 1998-04-23 | 2001-03-27 | Mci Communications Corporation | System, method and computer program product for a dynamic rules-based threshold engine |
| US7016872B1 (en) * | 1999-06-18 | 2006-03-21 | Thomson Financial Inc. | System, method and computer readable medium containing instructions for evaluating and disseminating investor performance information |
| US6792399B1 (en) | 1999-09-08 | 2004-09-14 | C4Cast.Com, Inc. | Combination forecasting using clusterization |
| US6606615B1 (en) | 1999-09-08 | 2003-08-12 | C4Cast.Com, Inc. | Forecasting contest |
-
2000
- 2000-03-13 US US09/524,253 patent/US7167838B1/en not_active Expired - Lifetime
- 2000-05-24 US US09/577,317 patent/US6681211B1/en not_active Expired - Lifetime
Patent Citations (44)
| Publication number | Priority date | Publication date | Assignee | Title |
|---|---|---|---|---|
| US3270190A (en) | 1962-10-01 | 1966-08-30 | Electronic Stock Evaluator Cor | Securities evaluator |
| US5911136A (en) | 1987-04-15 | 1999-06-08 | Proprietary Financial Products, Inc. | System for prioritized operation of a personal financial account comprising liabilities and investment assets |
| US5852811A (en) | 1987-04-15 | 1998-12-22 | Proprietary Financial Products, Inc. | Method for managing financial accounts by a preferred allocation of funds among accounts |
| US5006998A (en) | 1987-11-05 | 1991-04-09 | Hitachi, Ltd. | Computer system with easy input means for consultation |
| US5132899A (en) | 1989-10-16 | 1992-07-21 | Fox Philip J | Stock and cash portfolio development system |
| US5608620A (en) | 1990-03-19 | 1997-03-04 | Lundgren; Carl A. | Method of eliciting unbiased forecasts by relating a forecaster's pay to the forecaster's contribution to a collective forecast |
| US5613072A (en) | 1991-02-06 | 1997-03-18 | Risk Data Corporation | System for funding future workers compensation losses |
| US5774880A (en) | 1992-06-10 | 1998-06-30 | Cantor Fitzgerald & Co., Inc. | Fixed income portfolio index processor |
| US5500795A (en) | 1992-07-30 | 1996-03-19 | Teknekron Infoswitch Corporation | Method and system for monitoring and controlling the performance of a call processing center |
| US5675746A (en) | 1992-09-30 | 1997-10-07 | Marshall; Paul S. | Virtual reality generator for use with financial information |
| US5365425A (en) | 1993-04-22 | 1994-11-15 | The United States Of America As Represented By The Secretary Of The Air Force | Method and system for measuring management effectiveness |
| US5812988A (en) | 1993-12-06 | 1998-09-22 | Investments Analytic, Inc. | Method and system for jointly estimating cash flows, simulated returns, risk measures and present values for a plurality of assets |
| US5502637A (en) | 1994-06-15 | 1996-03-26 | Thomson Shared Services, Inc. | Investment research delivery system |
| US5761442A (en) | 1994-08-31 | 1998-06-02 | Advanced Investment Technology, Inc. | Predictive neural network means and method for selecting a portfolio of securities wherein each network has been trained using data relating to a corresponding security |
| US5749077A (en) | 1994-11-28 | 1998-05-05 | Fs Holdings, Inc. | Method and apparatus for updating and selectively accessing financial records related to investments |
| US5893079A (en) | 1994-12-13 | 1999-04-06 | Fs Holdings, Inc. | System for receiving, processing, creating, storing, and disseminating investment information |
| US6012042A (en) | 1995-08-16 | 2000-01-04 | Window On Wallstreet Inc | Security analysis system |
| US5774881A (en) | 1995-10-30 | 1998-06-30 | Efi Actuaries | Method of determining optimal asset allocation utilizing asset cash flow simulation |
| US5948054A (en) | 1996-02-27 | 1999-09-07 | Sun Microsystems, Inc. | Method and system for facilitating the exchange of information between human users in a networked computer system |
| US5963922A (en) | 1996-02-29 | 1999-10-05 | Helmering; Paul F. | System for graphically mapping related elements of a plurality of transactions |
| US5950176A (en) | 1996-03-25 | 1999-09-07 | Hsx, Inc. | Computer-implemented securities trading system with a virtual specialist function |
| US5909669A (en) | 1996-04-01 | 1999-06-01 | Electronic Data Systems Corporation | System and method for generating a knowledge worker productivity assessment |
| US5946666A (en) | 1996-05-21 | 1999-08-31 | Albert Einstein Healthcare Network | Monitoring device for financial securities |
| US5802518A (en) | 1996-06-04 | 1998-09-01 | Multex Systems, Inc. | Information delivery system and method |
| US5864871A (en) | 1996-06-04 | 1999-01-26 | Multex Systems | Information delivery system and method including on-line entitlements |
| US5819271A (en) | 1996-06-04 | 1998-10-06 | Multex Systems, Inc. | Corporate information communication and delivery system and method including entitlable hypertext links |
| US6253192B1 (en) * | 1996-08-30 | 2001-06-26 | The Quantam Consultancy Group (Proprietary) Limited | Method of personal financial planning |
| US6012043A (en) | 1996-09-09 | 2000-01-04 | Nationwide Mutual Insurance Co. | Computerized system and method used in financial planning |
| US6317726B1 (en) * | 1996-12-30 | 2001-11-13 | Netfolio, Inc. | Automated strategies for investment management |
| US5956691A (en) * | 1997-01-07 | 1999-09-21 | Second Opinion Financial Systems, Inc. | Dynamic policy illustration system |
| US6119103A (en) * | 1997-05-27 | 2000-09-12 | Visa International Service Association | Financial risk prediction systems and methods therefor |
| US6154732A (en) | 1997-07-25 | 2000-11-28 | Guidedchoice.Com | System for providing investment advice and management of pension assets |
| US6064986A (en) | 1997-09-23 | 2000-05-16 | Edelman Financial Services, Inc. | Computer assisted and/or implemented process and architecture for customer account creation, maintenance and administration for an investment and/or retirement program |
| US6021397A (en) | 1997-12-02 | 2000-02-01 | Financial Engines, Inc. | Financial advisory system |
| US6125355A (en) | 1997-12-02 | 2000-09-26 | Financial Engines, Inc. | Pricing module for financial advisory system |
| US5918217A (en) | 1997-12-10 | 1999-06-29 | Financial Engines, Inc. | User interface for a financial advisory system |
| US6370516B1 (en) | 1998-03-16 | 2002-04-09 | John P Reese | Computer based device to report the results of codified methodologies of financial advisors applied to a single security or element |
| US6236980B1 (en) | 1998-04-09 | 2001-05-22 | John P Reese | Magazine, online, and broadcast summary recommendation reporting system to aid in decision making |
| US6510419B1 (en) | 1998-04-24 | 2003-01-21 | Starmine Corporation | Security analyst performance tracking and analysis system and method |
| JP2000090150A (en) | 1998-09-10 | 2000-03-31 | Cwl:Kk | Stock price estimation method and device using trend line |
| US20020022988A1 (en) | 1999-06-18 | 2002-02-21 | Columbus Craig E. | System, method and computer readable medium containing instructions for evaluating and disseminating securities analyst performance information |
| US20020082966A1 (en) | 1999-11-16 | 2002-06-27 | Dana Commercial Credit Corporation | System and method for benchmarking asset characteristics |
| US20020019791A1 (en) | 2000-03-13 | 2002-02-14 | Goss Benjamin Mark | Electronic financial system |
| WO2001080124A2 (en) | 2000-04-12 | 2001-10-25 | Thomson Financial Inc. | System, method and computer readable medium containing instructions for evaluating and disseminating securities analyst performance information |
Non-Patent Citations (79)
| Title |
|---|
| "A Journal of Accounting, Finance and Business Studies" vol. 30, No. 1 Mar. 1994. |
| "Do Stock Prices Fully reflect the Implications of Current Earnings for Future Earnings for AR1 Firms" Brown et al. 2000. |
| "Enhancing Earnings Predictability Using Individual Analyst Forecasts", Herzberg et al. Summer 1999. |
| "Predicting Individual Analyst Earnings Forecast Accuracy", Brown et al. Sep. 29, 1999. |
| "Profiling From Predicting Earnings Surprise", Brown et al. 1998. |
| "The Information Content of Analyst Stock Recommendations" Kirsche et al. Aug. 8, 2000. |
| Accounting Horizons, vol. 10, No. 3 Sep. 1996. |
| Accounting Horizons, vol. 10, No. 4, Dec. 1996. |
| Accounting Horizons, vol. 11, No. 4 Dec. 1997. |
| Accounting Horizons, vol. 13, No. 4 Dec. 1999. |
| Accounting Organizations and Society, vol. 21, No. 7/8/Oct./Nov. 1996. |
| Brown et al. Composite Analyst Earnings Forecasts: The Next Generation. Journal of Business Forecasting, Summer 1990. vol. 9 Issue 2. |
| CA Magazine Apr. 1996. |
| Charles Schwab Introduces Analytics Fund; Utilizes Quantitative Techniques To Seek Above-Market Returns, Business Editors. |
| Contemporary Accounting Research vol. 8, No. 1 Fall 1991. |
| Financial Analysts Journal Mar./Apr. 1997. |
| Financial Analysts Journal Nov./Dec. 1997. |
| Financial Analysts Journal, Jan./Feb. 1996. |
| Financial Analysts Journal, Mar./Apr. 1997 "Earnings Suerprise Research: Synthesis and Perspectives" Brown. |
| Financial Analysts Journal, vol. 55, No. 5 Sep./Oct. 1999. |
| Financial Analysts Journal/Jan.-Feb. 1996 "Analyst Forecasting Errors and their Implications for Security Analysis: An Alternative Perspective". |
| Herzberg et al. Enhancing Earnings Predictability Using Individual Analyst Forecasts. The Journal of Investing. Summer 1999. |
| Ho et al. Market Reactions to Messages From Brokerage Ratings Systems. Financial Analysts Journal. Feb. 1998 vol. 54, Issue 1. |
| http://interactive.wsj.com/public/current/articles/SB963944657420928118.htm (Jan. 5, 2001). |
| http://interactive.wsj.com/public/current/articles/SB963945297966625438.htm (Jan. 5, 2001). |
| http://interactive.wsj.com/public/current/articles/SB963945478117361937.htm (Jan. 5, 2001). |
| http://interactive.wsj.com/public/current/articles/SB963945615772798263.htm (Jan. 5, 2001). |
| http://interactive.wsj.com/public/current/articles/SB963945742428637569.htm (Jan. 5, 2001). |
| http://interactive.wsj.com/public/current/summaries/best00.htm (Jan. 5, 2001). |
| http://my.zacks.com/?ALERT+www.zacks.com (printed Feb. 2, 2001). |
| http://www.bulldogresearch.com/default.asp (printed Feb. 5, 2001). |
| http://www.cianet.com (printed Feb. 5, 2001). |
| http://www.factset.com (printed Feb. 5, 2001). |
| http://www.findarticles.com/m4PRN/1999_Oct_14/56284107/p1/article.jhtml (printed Feb. 5, 2001). |
| http://www.iexchange.com (printed Feb. 5, 2001). |
| http://www.validea.com/home/home.asp (printed Feb. 5, 2001). |
| https://www.invesars.com/home.asp (printed Mar. 26, 2001). |
| I/B/E/S Internation Inc., Active Express. |
| International Journal of Forecasting vol. 7, No. 3 (1991) pp. 257-408. |
| International Journal of Forecasting, vol. 11, No. 3 (1995) pp. 361-500. |
| International Journal of Forecasting, vol. 12, No. 1 (1996) pp. 1-192. |
| International Journal of Forecasting, vol. 9, No. 3 (1993) pp. 295-436. |
| International Search Report. |
| Journal of Accounting & Economics vol. 9 1987 (MSG.V. 9 No. 3). |
| Journal of Accounting & Economics vol. 9, No. 2 Jul. 1987. |
| Journal of Accounting & Economics, vol. 15, No. 2/3 Jun./Sep. 1992. |
| Journal of Accounting and Economics vol. 25, No. 3 Jun. 1998. |
| Journal of Accounting Auditing & Finance vol. 9, No. 4 (new series) Fall 1994. |
| Journal of Accounting Research Col. 29, No. 2 1991. |
| Journal of Accounting Research vol. 17, No. 2 Autumn 1979. |
| Journal of Accounting Research vol. 23, No. 1 Spring 1985. |
| Journal of Accounting Research vol. 25, No. 1 Spring 1987. |
| Journal of Accounting Research vol. 38, No. 1 Spring 2000. |
| Journal of Accounting Research, vol. 24 Supplement 1986 "Evidence on the Incremental Information Content of Additional Firm Dsisclosures made Concurrently with Earnings" Hoskin et al. |
| Journal of Business Finance & Accounting, vol. 19, No. 4 Jun. 1992. |
| Journal of Forecasting, vol. 2 325-330 1983) "Perspective on Forecasting Research in Accounting and Finance". |
| Lamonica et al. The Best and Worst: Bloomerberg's Second Annual Analysts Survey, and the Top Analysts Top Picks. Financial World Jan. 30, 1996. vol. 165. Issue 2. |
| Mozes et al. Modeling Earnings Expectations Based on Clusters of Analyst Forecasts The Journal of Investing Spring 1999. |
| The Accounting Review Quarterly Journal of the American Accounting Association vol. LX Apr. 1985 No. 2. |
| The Accounting Review vol. 67, No. 4 Oct. 1992. |
| The Accounting Review, vol. 68, No. 3, Jul. 1993. |
| The CPA Journal May 1995. |
| The Journal of Canadian Academic Accounting Association, vol. 14, No. 1, Spring 1997. |
| The Journal of Canadian Academic Accounting Association, vol. 16, No. 1, Spring 1999. |
| The Journal of Finance vol. 46, No. 2 Jun. 1991. |
| The Journal of Finance vol. XLIX, No. 1 Mar. 1994. |
| The Journal of Finance, vol. 46, No. 1 Mar. 1991. |
| The Journal of Finance, vol. 55, No. 5 Oct. 2000. |
| The Journal of Finance, vol. LIV, No. 5 Oct. 1999, "What os the Intrinsic value of the Dow", Lee et al. |
| The Journal of Finance, vol. XLIX, No. 3, Jul. 1993 Market Integration and Prive Execution for NYSE-Listed Securities. |
| The Journal of Finance, vol. XLVIII, No. 2 Jun. 1993 "Summing Up". |
| The Journal of Finance, vol. XLVIII, No. 2 Jun. 1993 "Yes, Discounts on Closed-End Funds are a Sentiment Index". |
| The Journal of Finance, vol. XXXIII, Mar. 1978, No. 1. |
| The Journal of Portfolio Management "Analysts can Forecast Accuragely" Brown et al. |
| The Journal of Portfolio Management vol. 23, No. 4 Summer 1997. |
| The Journal of the Canadian Academic Accounting Association vol. 11, No. 1-1 Summer 1994. |
| The Journal of the Canadian Academic Accounting Association, vol. 14, No. 2 Summer 1997. |
| The Predictive Value of Interim Reports for Improving Forecasts of Future Quarterly Earnings, Apr. 1978. |
| The Review of Financial Studies 1993, vol. 6, No. 2 pp. 345-374 "Spreads, Depths and the Impact of Earnings Information: An Intraday Analysis". |
Cited By (199)
| Publication number | Priority date | Publication date | Assignee | Title |
|---|---|---|---|---|
| US20020010606A1 (en) * | 1998-04-08 | 2002-01-24 | Hitachi, Ltd. | Freight information management method and freight management system using electronic tags |
| US7882005B2 (en) * | 1999-05-20 | 2011-02-01 | Ameritrade Ip Company, Inc. | Stock purchase indices |
| US8412612B2 (en) | 1999-05-20 | 2013-04-02 | Td Ameritrade Ip Company, Inc. | Stock purchase indices |
| US20050137963A1 (en) * | 1999-05-20 | 2005-06-23 | Ameritrade Holding Corporation | Stock purchase indices |
| US8180696B2 (en) | 1999-05-20 | 2012-05-15 | Ameritrade Ip Company, Inc. | Stock purchase indices |
| US20110093407A1 (en) * | 1999-05-20 | 2011-04-21 | Ameritrade Ip Company, Inc. | Stock Purchase Indices |
| US8412611B2 (en) | 1999-05-20 | 2013-04-02 | Td Ameritrade Ip Company, Inc. | Stock purchase indices |
| US7788165B2 (en) * | 1999-06-18 | 2010-08-31 | Thomson Financial Llc | System, method and computer readable medium containing instructions for evaluating and disseminating investor performance information |
| US20060161493A1 (en) * | 1999-06-18 | 2006-07-20 | Thomson Financial, Inc. | System, method and computer readable medium containing instructions for evaluating and disseminating investor performance information |
| US7171384B1 (en) * | 2000-02-14 | 2007-01-30 | Ubs Financial Services, Inc. | Browser interface and network based financial service system |
| US20010039526A1 (en) * | 2000-03-17 | 2001-11-08 | Pittenger Robert C. | Securities grading system |
| US20070174168A1 (en) * | 2000-03-17 | 2007-07-26 | Newsgrade Corporation | Securities grading system |
| US8170939B2 (en) | 2000-03-20 | 2012-05-01 | Charles Schwab & Co. | Method and system for building and maintenance watch lists |
| US7333951B1 (en) * | 2000-03-20 | 2008-02-19 | Charles Schwab & Co. | Method and system for building and maintenance watch lists |
| US8660929B2 (en) | 2000-03-20 | 2014-02-25 | Charles Schwab & Co. | Method and system for building and maintenance watch lists |
| US20020004774A1 (en) * | 2000-03-27 | 2002-01-10 | Tony Defarlo | Data analysis system for tracking financial trader history and profiling trading behavior |
| US20020007332A1 (en) * | 2000-06-27 | 2002-01-17 | Asf-Ip, Inc. | Method and system for evaluation of potential funding sources for financial plans |
| US7337135B1 (en) * | 2000-07-13 | 2008-02-26 | C4Cast.Com, Inc. | Asset price forecasting |
| US7028006B1 (en) * | 2000-10-03 | 2006-04-11 | Pricemetrix, Inc. | Peer based doctrine performance framework |
| US20140201611A1 (en) * | 2000-10-03 | 2014-07-17 | Nokia Corporation | Contextual mapping based learning by converting information |
| US8676921B1 (en) * | 2000-10-03 | 2014-03-18 | Nokia Corporation | Contextual mapping based learning by converting information |
| US7941357B2 (en) * | 2000-10-27 | 2011-05-10 | Markets-Alert Pty Ltd | Trading system |
| US20040039683A1 (en) * | 2000-10-27 | 2004-02-26 | Mcgeorge Jeffrey Bruce | Trading system |
| US8606609B2 (en) | 2000-11-01 | 2013-12-10 | Microsoft Corporation | Method and system for visually indicating project task durations are estimated using a single character |
| US7249042B1 (en) * | 2000-11-01 | 2007-07-24 | Microsoft Corporation | Method and system for visually indicating project task durations are estimated using a character |
| US20060271469A1 (en) * | 2000-11-03 | 2006-11-30 | Lehman Brothers Inc. | Tool for estimating a cost of a trade |
| US7440920B2 (en) * | 2000-11-03 | 2008-10-21 | Lehman Brothers Inc. | Tool for estimating a cost of a trade |
| US20020128939A1 (en) * | 2000-12-22 | 2002-09-12 | Tarrant Jeffrey G. | Method and system for sharing investor information over an electronic network |
| US20020133447A1 (en) * | 2001-01-12 | 2002-09-19 | Smartfolios, Inc. | Computerized method and system for formulating stock portfolios |
| US20030014395A1 (en) * | 2001-07-12 | 2003-01-16 | International Business Machines Corporation | Communication triggered just in time information |
| US9508101B1 (en) * | 2001-09-21 | 2016-11-29 | Google Inc. | Systems and methods for providing stock ticker information |
| US10108716B1 (en) | 2001-09-21 | 2018-10-23 | Google Llc | Systems and methods for providing stock ticker information |
| US20030065605A1 (en) * | 2001-10-03 | 2003-04-03 | Joseph Gatto | Methods and systems for measuring performance of a security analyst |
| US20030065604A1 (en) * | 2001-10-03 | 2003-04-03 | Joseph Gatto | Methods and systems for measuring performance of a security analyst |
| US7636680B2 (en) | 2001-10-03 | 2009-12-22 | Starmine Corporation | Methods and systems for measuring performance of a security analyst |
| US20040049518A1 (en) * | 2001-10-22 | 2004-03-11 | Finlab Sa | Historical data recording and visualizing system and method |
| US20040249868A1 (en) * | 2001-11-14 | 2004-12-09 | Shi-Hui Tsai | Method and system for estimating exportation time |
| US6901416B2 (en) * | 2001-11-14 | 2005-05-31 | Inventec Corporation | Method and system for estimating exportation time |
| US20030105699A1 (en) * | 2001-12-03 | 2003-06-05 | Richard Redpath | Technique for calculating and displaying securities options data to produce a visual pattern of potential future values |
| US20030110120A1 (en) * | 2001-12-06 | 2003-06-12 | Salehi James D. | Method and system for displaying price charts |
| US7822691B1 (en) | 2001-12-28 | 2010-10-26 | Fannie Mae | Method for determining house prices indices |
| US11288690B1 (en) | 2001-12-28 | 2022-03-29 | Fannie Mae | Method for determining house price indices |
| US7305328B1 (en) * | 2001-12-28 | 2007-12-04 | Fannie Mae | Method and apparatus for predicting and reporting a real estate value based on a weighted average of predicted values |
| US6876955B1 (en) * | 2001-12-28 | 2005-04-05 | Fannie Mae | Method and apparatus for predicting and reporting a real estate value based on a weighted average of predicted values |
| US7983925B1 (en) | 2001-12-31 | 2011-07-19 | Fannie Mae | Efficient computation method for determining house price indices |
| US7941524B2 (en) * | 2002-05-31 | 2011-05-10 | Microsoft Corporation | System and method for collecting and storing event data from distributed transactional applications |
| US20060265365A1 (en) * | 2002-05-31 | 2006-11-23 | Microsoft Corporation | System and method for collecting and storing event data from distributed transactional application |
| US20100217693A1 (en) * | 2002-11-14 | 2010-08-26 | David Lawrence | Independent Research Consensus Earnings Estimates and Methods of Determining Such |
| US7702574B2 (en) * | 2002-11-14 | 2010-04-20 | Goldman Sachs & Co. | Independent research consensus earnings estimates and methods of determining such |
| US20040138998A1 (en) * | 2002-11-14 | 2004-07-15 | David Lawrence | Independent research consensus earnings estimates and methods of determining such |
| US20130218737A1 (en) * | 2002-11-14 | 2013-08-22 | Goldman, Sachs & Co. | Independent Research Consensus Earnings Estimates And Methods Of Determining Such |
| US8364580B2 (en) | 2002-11-14 | 2013-01-29 | Goldman, Sachs & Co. | Independent research consensus earnings estimates and methods of determining such |
| US8289330B2 (en) | 2003-03-14 | 2012-10-16 | Spectrum Investment Advisors, Inc. | Colored investment data display system and method |
| US20100067029A1 (en) * | 2003-03-14 | 2010-03-18 | Marshall James F | Colored investment data display system and method |
| US7961190B2 (en) | 2003-03-14 | 2011-06-14 | Marshall James F | Colored investment data display system and method |
| US20040179011A1 (en) * | 2003-03-14 | 2004-09-16 | Marshall James F. | Data display method and system |
| US20050004283A1 (en) * | 2003-04-15 | 2005-01-06 | Jutta Lindemann | (Meth)acrylate resins and their use |
| US20040243527A1 (en) * | 2003-05-28 | 2004-12-02 | Gross John N. | Method of testing online recommender system |
| US20100191663A1 (en) * | 2003-05-28 | 2010-07-29 | Gross John N | Method of testing item availability and delivery performance of an e-commerce site |
| US8630960B2 (en) | 2003-05-28 | 2014-01-14 | John Nicholas Gross | Method of testing online recommender system |
| US20100312613A1 (en) * | 2003-05-28 | 2010-12-09 | Gross John N | Method of evaluating learning rate of recommender systems |
| US8249955B2 (en) | 2003-05-28 | 2012-08-21 | John Nicholas Gross | Method of testing item availability and delivery performance of an e-commerce site |
| US20040244029A1 (en) * | 2003-05-28 | 2004-12-02 | Gross John N. | Method of correlating advertising and recommender systems |
| US7761388B2 (en) * | 2003-06-16 | 2010-07-20 | Fmr Llc | Predicting a future price range for a desired volume |
| US20040254870A1 (en) * | 2003-06-16 | 2004-12-16 | Chitaley Ani D. | Predicting a future price range for a desired volume |
| WO2004114189A1 (en) * | 2003-06-16 | 2004-12-29 | Fmr Corp. | Predicting a future price range for a desired volume |
| US20100262532A1 (en) * | 2003-06-16 | 2010-10-14 | FMR Corp., a MA corporation | Predicting a Future Price Range for a Desired Volume |
| US8311919B2 (en) * | 2003-10-07 | 2012-11-13 | Trading Technologies International, Inc. | System and method for displaying risk data in an electronic trading environment |
| US8204811B2 (en) * | 2003-10-07 | 2012-06-19 | Trading Technologies International, Inc. | System and method for displaying risk data in an electronic trading environment |
| US20100211525A1 (en) * | 2003-10-07 | 2010-08-19 | Trading Technologies International, Inc. | System and Method for Displaying Risk Data in an Electronic Trading Environment |
| US10529023B2 (en) * | 2003-10-07 | 2020-01-07 | Trading Technologies International, Inc. | System and method for displaying risk data in an electronic trading environment |
| US8046282B2 (en) * | 2003-10-07 | 2011-10-25 | Trading Technologies International, Inc. | System and method for displaying risk data in an electronic trading environment |
| US9984413B2 (en) * | 2003-10-07 | 2018-05-29 | Trading Technologies International, Inc. | System and method for displaying risk data in an electronic trading environment |
| US9830653B2 (en) * | 2003-10-07 | 2017-11-28 | Trading Technologies International, Inc. | System and method for displaying risk data in an electronic trading environment |
| US20120011042A1 (en) * | 2003-10-07 | 2012-01-12 | Trading Technologies International, Inc. | System and Method for Displaying Risk Data in an Electronic Trading Environment |
| US7752118B1 (en) * | 2003-10-07 | 2010-07-06 | Trading Technologies International, Inc. | System and method for risk grid display in an electronic trading environment |
| US8775289B2 (en) * | 2003-10-07 | 2014-07-08 | Trading Technologies International, Inc. | System and method for displaying risk data in an electronic trading environment |
| US20140108217A1 (en) * | 2003-10-07 | 2014-04-17 | Trading Technologies International, Inc. | System and Method for Displaying Risk Data in an Electronic Trading Environment |
| US7739164B1 (en) * | 2003-10-07 | 2010-06-15 | Trading Technologies International, Inc. | System and method for displaying risk data in an electronic trading environment |
| US7774249B1 (en) | 2003-10-07 | 2010-08-10 | Trading Technologies International, Inc. | System and method for risk grid display in an electronic trading environment |
| US20120226597A1 (en) * | 2003-10-07 | 2012-09-06 | Trading Technologies International, Inc. | System and method for displaying risk data in an electronic trading environment |
| US8484114B2 (en) * | 2003-10-07 | 2013-07-09 | Trading Technologies International, Inc. | System and method for displaying risk data in an electronic trading environment |
| US20050080695A1 (en) * | 2003-10-09 | 2005-04-14 | Gatto Joseph G. | System and method for facilitating the selection of security analyst research reports |
| US20050108025A1 (en) * | 2003-11-14 | 2005-05-19 | First American Real Estate Solutions, L.P. | Method for mortgage fraud detection |
| US7599882B2 (en) | 2003-11-14 | 2009-10-06 | First American Corelogic, Inc. | Method for mortgage fraud detection |
| US20100088242A1 (en) * | 2003-11-14 | 2010-04-08 | First American Corelogic, Inc. | Method for mortgage fraud detection |
| US20050171822A1 (en) * | 2004-02-03 | 2005-08-04 | First American Real Estate Solutions, L.P. | Responsive confidence scoring method for a proposed valuation of aproperty |
| US20060080140A1 (en) * | 2004-02-09 | 2006-04-13 | Epic Systems Corporation | System and method for providing a clinical summary of patient information in various health care settings |
| US20050187855A1 (en) * | 2004-02-20 | 2005-08-25 | Brennan David P. | Method for analyzing trade data |
| US20050216323A1 (en) * | 2004-03-05 | 2005-09-29 | Weild David Iv | Paid-for research method and system |
| US20050203769A1 (en) * | 2004-03-05 | 2005-09-15 | Weild David Iv | Data structure with market capitalization breakdown |
| US20050203896A1 (en) * | 2004-03-05 | 2005-09-15 | Weild David Iv | Analyst search engine method and system |
| US20050216322A1 (en) * | 2004-03-05 | 2005-09-29 | Weild David Iv | Data structure with experience descriptors |
| US20050216297A1 (en) * | 2004-03-05 | 2005-09-29 | Weild David Iv | Paid-for research method and system |
| US20050203894A1 (en) * | 2004-03-05 | 2005-09-15 | Weild David Iv | Paid-for research method and system |
| US20050216491A1 (en) * | 2004-03-05 | 2005-09-29 | Weild David Iv | Data structure with code of conduct |
| US20050203895A1 (en) * | 2004-03-05 | 2005-09-15 | Weild David Iv | Data structure with performance descriptors |
| US20100218136A1 (en) * | 2004-05-13 | 2010-08-26 | Scottrade, Inc. | Method and Apparatus for User-Interactive Financial Instrument Trading |
| US20050261999A1 (en) * | 2004-05-20 | 2005-11-24 | Rowady E P Jr | Event-driven financial analysis interface and system |
| US7565417B2 (en) | 2004-05-20 | 2009-07-21 | Rowady Jr E Paul | Event-driven financial analysis interface and system |
| US7769654B1 (en) | 2004-05-28 | 2010-08-03 | Morgan Stanley | Systems and methods for determining fair value prices for equity research |
| US7734517B2 (en) | 2004-05-28 | 2010-06-08 | Morgan Stanley | Systems and method for determining the cost of a securities research department to service a client of the department |
| US8209253B2 (en) * | 2004-05-28 | 2012-06-26 | Morgan Stanley | Matching resources of a securities research department to accounts of the department |
| US7689490B2 (en) * | 2004-05-28 | 2010-03-30 | Morgan Stanley | Matching resources of a securities research department to accounts of the department |
| US20060041456A1 (en) * | 2004-05-28 | 2006-02-23 | Hurewitz Barry S | Systems and method for determining the cost of a securities research department to service a client of the department |
| US20120265571A1 (en) * | 2004-05-28 | 2012-10-18 | Morgan Stanley | Matching resources of a securities research department to accounts of the department |
| US20050267824A1 (en) * | 2004-05-28 | 2005-12-01 | Hurewitz Barry S | Matching resources of a securities research department to accounts of the department |
| US20100145757A1 (en) * | 2004-05-28 | 2010-06-10 | Morgan Stanley | Matching resources of a securities research department to accounts of the department |
| US20050289038A1 (en) * | 2004-06-28 | 2005-12-29 | Alexander Karapetian | Method and system for voting for a future price of an asset |
| WO2006010044A2 (en) * | 2004-07-09 | 2006-01-26 | Gapyx, Llc | System and method for behavioral finance |
| US20060036542A1 (en) * | 2004-07-09 | 2006-02-16 | Mcnair Douglas S | System and method for behavioral finance |
| WO2006010044A3 (en) * | 2004-07-09 | 2006-11-23 | Gapyx Llc | System and method for behavioral finance |
| US8442889B2 (en) | 2004-07-12 | 2013-05-14 | Darrin B. Farrow | Asset allocation based system for individual investor portfolio selection |
| US20060010053A1 (en) * | 2004-07-12 | 2006-01-12 | Pension Builders And Consultants | Asset allocation based system for individual investor portfolio selection |
| US20060015425A1 (en) * | 2004-07-15 | 2006-01-19 | Brooks Kent F | System and method for providing customizable investment tools |
| US7672889B2 (en) | 2004-07-15 | 2010-03-02 | Brooks Kent F | System and method for providing customizable investment tools |
| US20060015357A1 (en) * | 2004-07-16 | 2006-01-19 | First American Real Estate Solutions, L.P. | Method and apparatus for spatiotemporal valuation of real estate |
| US7904364B2 (en) * | 2004-09-10 | 2011-03-08 | Morgan Stanley | Systems and methods for auctioning access to securities research resources |
| US7752103B2 (en) | 2004-09-10 | 2010-07-06 | Morgan Stanley | Systems and methods for auctioning access to securities research resources |
| US20100257086A1 (en) * | 2004-09-10 | 2010-10-07 | Hurewitz Barry S | Systems and methods for auctioning access to securities research resources |
| US20060059075A1 (en) * | 2004-09-10 | 2006-03-16 | Hurewitz Barry S | Systems and methods for auctioning access to securities research resources |
| US20060085234A1 (en) * | 2004-09-17 | 2006-04-20 | First American Real Estate Solutions, L.P. | Method and apparatus for constructing a forecast standard deviation for automated valuation modeling |
| US8311923B2 (en) | 2004-10-18 | 2012-11-13 | Thomson Reuters (Markets) Llc | System and method for analyzing analyst recommendations on a single stock basis |
| US7877309B2 (en) | 2004-10-18 | 2011-01-25 | Starmine Corporation | System and method for analyzing analyst recommendations on a single stock basis |
| US20060116943A1 (en) * | 2004-11-30 | 2006-06-01 | Pascal Willain | Method to determine price inflections of securities |
| US7783547B1 (en) | 2004-12-10 | 2010-08-24 | HedgeCity Corporation | System and method for determining hedge strategy stock market forecasts |
| US20060161472A1 (en) * | 2004-12-30 | 2006-07-20 | Weild David Iv | Method and system for ranking research providers |
| US20060161448A1 (en) * | 2004-12-30 | 2006-07-20 | The National Research Exchange | Method and system for rating / ranking third parties |
| US20060190316A1 (en) * | 2004-12-31 | 2006-08-24 | Dankowych John A | Computer based system and method for gathering and processing scientific project data |
| US7765125B1 (en) | 2005-01-12 | 2010-07-27 | Fannie Mae | Trunk branch repeated transaction index for property valuation |
| US8214275B1 (en) | 2005-01-12 | 2012-07-03 | Fannie Mae | Multiple transaction property valuation |
| US8738388B1 (en) | 2005-01-12 | 2014-05-27 | Fannie Mae | Market based data cleaning |
| US7831492B1 (en) | 2005-01-12 | 2010-11-09 | Fannie Mae | Multiple transaction property valuation |
| US7813986B2 (en) | 2005-03-25 | 2010-10-12 | The Motley Fool, Llc | System, method, and computer program product for scoring items based on user sentiment and for determining the proficiency of predictors |
| US20070011073A1 (en) * | 2005-03-25 | 2007-01-11 | The Motley Fool, Inc. | System, method, and computer program product for scoring items based on user sentiment and for determining the proficiency of predictors |
| US20060217994A1 (en) * | 2005-03-25 | 2006-09-28 | The Motley Fool, Inc. | Method and system for harnessing collective knowledge |
| US7882006B2 (en) | 2005-03-25 | 2011-02-01 | The Motley Fool, Llc | System, method, and computer program product for scoring items based on user sentiment and for determining the proficiency of predictors |
| US20060218179A1 (en) * | 2005-03-25 | 2006-09-28 | The Motley Fool, Inc. | System, method, and computer program product for scoring items based on user sentiment and for determining the proficiency of predictors |
| US20060229962A1 (en) * | 2005-04-08 | 2006-10-12 | Hiskett Herbert C | Evaluation of securities |
| US7523056B2 (en) * | 2005-04-08 | 2009-04-21 | Herbert Charles Hiskett | Evaluation of securities |
| US7729965B1 (en) | 2005-04-26 | 2010-06-01 | Fannie Mae | Collateral valuation confidence scoring system |
| US7853518B2 (en) | 2005-05-24 | 2010-12-14 | Corelogic Information Solutions, Inc. | Method and apparatus for advanced mortgage diagnostic analytics |
| US20060271472A1 (en) * | 2005-05-24 | 2006-11-30 | First American Real Estate Solutions, L.P. | Method and apparatus for advanced mortgage diagnostic analytics |
| US20070033122A1 (en) * | 2005-08-04 | 2007-02-08 | First American Real Estate Solutions, Lp | Method and apparatus for computing selection criteria for an automated valuation model |
| US7873570B2 (en) | 2005-08-05 | 2011-01-18 | Corelogic Information Solutions, Inc. | Method and system for updating a loan portfolio with information on secondary liens |
| US7809635B2 (en) | 2005-08-05 | 2010-10-05 | Corelogic Information Solutions, Inc. | Method and system for updating a loan portfolio with information on secondary liens |
| US20070033126A1 (en) * | 2005-08-05 | 2007-02-08 | Cagan Christopher L | Method and system for updating a loan portfolio with information on secondary liens |
| US7930254B1 (en) | 2005-08-05 | 2011-04-19 | Fannie Mae | Property value estimation using feature distance from comparable sales |
| US20070043650A1 (en) * | 2005-08-16 | 2007-02-22 | Hughes John M | Systems and methods for providing investment opportunities |
| US20070043653A1 (en) * | 2005-08-16 | 2007-02-22 | Hughes John M | Systems and methods for providing investment opportunities |
| US7865423B2 (en) | 2005-08-16 | 2011-01-04 | Bridgetech Capital, Inc. | Systems and methods for providing investment opportunities |
| US20070136124A1 (en) * | 2005-12-12 | 2007-06-14 | United Technologies Corporation | Method, program, and system for conducting trade studies and evaluation activities |
| US8370183B2 (en) * | 2005-12-12 | 2013-02-05 | United Technologies Corporation | Method, program, and system for conducting trade studies and evaluation activities |
| US20110173135A1 (en) * | 2006-03-01 | 2011-07-14 | Realtick Llc | Methods and Systems for Risk Management |
| US8370237B1 (en) | 2006-06-12 | 2013-02-05 | Morgan Stanley | Profit model for non-execution services |
| US7953652B1 (en) | 2006-06-12 | 2011-05-31 | Morgan Stanley | Profit model for non-execution services |
| US7752112B2 (en) | 2006-11-09 | 2010-07-06 | Starmine Corporation | System and method for using analyst data to identify peer securities |
| US8662977B1 (en) * | 2006-12-26 | 2014-03-04 | Jean-Francois Pascal Nicolas | Multiple plays for free games |
| US8118654B1 (en) * | 2006-12-26 | 2012-02-21 | Jean-Francois Pascal Nicolas | Financial game with combined assets |
| US20080221958A1 (en) * | 2007-03-07 | 2008-09-11 | Microsoft Corporation | Techniques to manage information for dynamic reports using time periods for a business model |
| US8239248B2 (en) * | 2007-03-07 | 2012-08-07 | Microsoft Corporation | Techniques to manage information for dynamic reports using time periods for a business model |
| US8396786B2 (en) | 2007-03-09 | 2013-03-12 | Uat, Inc. | System and method for exchanging institutional research and trade order execution services |
| US8078522B1 (en) | 2007-03-09 | 2011-12-13 | Uat, Inc. | System and method for exchanging institutional research and trade order execution services |
| US8635148B2 (en) | 2007-03-09 | 2014-01-21 | Uat, Inc. | System and method for exchanging institutional research and trade order execution services |
| US20080228804A1 (en) * | 2007-03-15 | 2008-09-18 | Accenture Global Services Gmbh | Presentation of information elements in an analyst network |
| US8744996B2 (en) * | 2007-03-15 | 2014-06-03 | Accenture Global Services Limited | Presentation of information elements in an analyst network |
| US7836175B2 (en) * | 2007-04-16 | 2010-11-16 | Hewlett-Packard Development Company, L.P. | Apparatus and method for processing management information |
| US20080256102A1 (en) * | 2007-04-16 | 2008-10-16 | Hewlett-Packard Development Company, L.P. | Apparatus and Method for Processing Management Information |
| US20090006268A1 (en) * | 2007-06-26 | 2009-01-01 | Wall Street On Demand | Computer-based method for teaming research analysts to generate improved securities investment recommendations |
| US8185469B2 (en) | 2007-06-26 | 2012-05-22 | Markit On Demand, Inc. | Computer-based method for teaming research analysts to generate improved securities investment recommendations |
| US20110191261A1 (en) * | 2007-06-26 | 2011-08-04 | Wall Street On Demand | Computer-based method for teaming research analysts to generate improved securities investment recommendations |
| US7941359B2 (en) | 2007-06-26 | 2011-05-10 | Wall Street On Demand | Computer-based method for teaming research analysts to generate improved securities investment recommendations |
| US20090077059A1 (en) * | 2007-09-19 | 2009-03-19 | Torres Robert J | Method and apparatus for linkage of quantitative and qualitative textual, audio, visual and other information searches to metric displays |
| US20090186689A1 (en) * | 2008-01-21 | 2009-07-23 | Hughes John M | Systems and methods for providing investment opportunities |
| US20100049664A1 (en) * | 2008-08-21 | 2010-02-25 | Yi-Hsuan Kuo | Method and system for user-defined alerting of securities information |
| US8589260B2 (en) | 2009-09-30 | 2013-11-19 | Royal Bank Of Canada | System and method for monitoring securities holdings for related entities |
| US20110078059A1 (en) * | 2009-09-30 | 2011-03-31 | Royal Bank Of Canada | System and method for monitoring securities holdings for related entities |
| US20120317053A1 (en) * | 2011-06-10 | 2012-12-13 | Benchmark Solutions Holdings, Inc. | Fixed income securities market data display |
| US8566146B1 (en) * | 2012-05-10 | 2013-10-22 | Morgan Stanley & Co. Llc | Computer-based systems and method for computing a score for contacts of a financial services firm indicative of resources to be deployed by the financial services firm for the contacts to maximize revenue for the financial services firm |
| USD733737S1 (en) * | 2012-06-05 | 2015-07-07 | P&W Solutions Co., Ltd. | Display screen with graphical user interface |
| USD733736S1 (en) * | 2012-06-05 | 2015-07-07 | P&W Solutions Co., Ltd. | Display screen with graphical user interface |
| USD737840S1 (en) * | 2012-06-05 | 2015-09-01 | P & W Solutions Co., Ltd. | Display screen with graphical user interface |
| USD732565S1 (en) * | 2012-06-05 | 2015-06-23 | P&W Solutions Co., Ltd. | Display screen with graphical user interface |
| USD733738S1 (en) * | 2012-06-05 | 2015-07-07 | P&W Solutions Co., Ltd. | Display screen with graphical user interface |
| USD733178S1 (en) * | 2012-06-05 | 2015-06-30 | P&W Solutions Co., Ltd. | Display screen with graphical user interface |
| USD872757S1 (en) * | 2013-12-13 | 2020-01-14 | Kbc Advanced Technologies Limited | Display screen with graphical user interface with timeline |
| USD820288S1 (en) * | 2013-12-13 | 2018-06-12 | Kbc Advanced Technologies Plc | Display screen with graphical user interface |
| USD872756S1 (en) * | 2013-12-13 | 2020-01-14 | Kbc Advanced Technologies Limited | Display screen with graphical user interface for workflow |
| USD748661S1 (en) * | 2013-12-30 | 2016-02-02 | Emc Corporation | Display screen with graphical user interface |
| US10963427B2 (en) | 2015-05-18 | 2021-03-30 | Interactive Data Pricing And Reference Data Llc | Data conversion and distribution systems |
| US10740292B2 (en) * | 2015-05-18 | 2020-08-11 | Interactive Data Pricing And Reference Data Llc | Data conversion and distribution systems |
| US10838921B2 (en) | 2015-05-18 | 2020-11-17 | Interactive Data Pricing And Reference Data Llc | System and method for dynamically updating and displaying backtesting data |
| US20200034336A1 (en) * | 2015-05-18 | 2020-01-30 | Interactive Data Pricing And Reference Data Llc | Data conversion and distribution systems |
| US11119983B2 (en) | 2015-05-18 | 2021-09-14 | Ice Data Pricing & Reference Data, Llc | Data conversion and distribution systems |
| US11294863B2 (en) | 2015-05-18 | 2022-04-05 | Ice Data Pricing & Reference Data, Llc | Data conversion and distribution systems |
| US11593305B2 (en) | 2015-05-18 | 2023-02-28 | Ice Data Pricing & Reference Data, Llc | Data conversion and distribution systems |
| US11841828B2 (en) | 2015-05-18 | 2023-12-12 | Ice Data Pricing & Reference Data, Llc | Data conversion and distribution systems |
| USD811422S1 (en) * | 2016-01-22 | 2018-02-27 | Google Llc | Portion of a display screen with a graphical user interface |
| US20220058513A1 (en) * | 2020-08-19 | 2022-02-24 | Accenture Global Solutions Limited | Veracity assessment of a data model |
Also Published As
| Publication number | Publication date |
|---|---|
| US7167838B1 (en) | 2007-01-23 |
Similar Documents
| Publication | Publication Date | Title |
|---|---|---|
| US6681211B1 (en) | Security analyst estimates performance viewing system and method | |
| US7509277B1 (en) | Security analyst estimates performance viewing system and method | |
| US7539637B2 (en) | Security analyst estimates performance viewing system and method | |
| US7603308B2 (en) | Security analyst estimates performance viewing system and method | |
| US6510419B1 (en) | Security analyst performance tracking and analysis system and method | |
| US10176533B2 (en) | Interactive chart utilizing shifting control to render shifting of time domains of data series | |
| US7991672B2 (en) | System and method of visual illustration of stock market performance | |
| US8577775B1 (en) | Systems and methods for managing investments | |
| US20050192930A1 (en) | System and method of real estate data analysis and display to support business management | |
| US10140661B2 (en) | Systems and methods for managing investments | |
| US7711623B2 (en) | Decision assistance platform configured for facilitating financial consulting services | |
| US20100262901A1 (en) | Engineering process for a real-time user-defined data collection, analysis, and optimization tool (dot) | |
| US20100169237A1 (en) | Investment classification and tracking system using diamond ratings | |
| EP1955273A2 (en) | Electronic enterprise capital marketplace and monitoring apparatus and method | |
| US20080172348A1 (en) | Statistical Determination of Multi-Dimensional Targets | |
| WO2008034098A2 (en) | Investment classification and tracking system | |
| CA2443657A1 (en) | Business performance presentation user interface and method for presenting business performance | |
| US20120317052A1 (en) | Collectively analyzing holdings across multiple fixed income products | |
| US20050267835A1 (en) | System and method for evaluating exposure across a group of investment portfolios by category | |
| US20050080695A1 (en) | System and method for facilitating the selection of security analyst research reports | |
| US8595123B1 (en) | Option search criteria testing | |
| US20130311400A1 (en) | System for real time continuous data processing for investment portfolios | |
| US20070299787A1 (en) | System, method, and computer program for analyzing stocks | |
| CA2640068A1 (en) | System and method configured for facilitating financial analysis | |
| US20030105695A1 (en) | Processing system for market efficiency value added |
Legal Events
| Date | Code | Title | Description |
|---|---|---|---|
| AS | Assignment |
Owner name: STARMINE CORPORATION, CALIFORNIA Free format text: ASSIGNMENT OF ASSIGNORS INTEREST;ASSIGNOR:GATTO, JOSEPH G.;REEL/FRAME:011082/0054 Effective date: 20000818 |
|
| STCF | Information on status: patent grant |
Free format text: PATENTED CASE |
|
| FPAY | Fee payment |
Year of fee payment: 4 |
|
| FEPP | Fee payment procedure |
Free format text: PAYOR NUMBER ASSIGNED (ORIGINAL EVENT CODE: ASPN); ENTITY STATUS OF PATENT OWNER: LARGE ENTITY Free format text: PAYER NUMBER DE-ASSIGNED (ORIGINAL EVENT CODE: RMPN); ENTITY STATUS OF PATENT OWNER: LARGE ENTITY |
|
| FPAY | Fee payment |
Year of fee payment: 8 |
|
| REFU | Refund |
Free format text: REFUND - PAYMENT OF MAINTENANCE FEE, 12TH YR, SMALL ENTITY (ORIGINAL EVENT CODE: R2553); ENTITY STATUS OF PATENT OWNER: LARGE ENTITY |
|
| FEPP | Fee payment procedure |
Free format text: PAT HOLDER NO LONGER CLAIMS SMALL ENTITY STATUS, ENTITY STATUS SET TO UNDISCOUNTED (ORIGINAL EVENT CODE: STOL); ENTITY STATUS OF PATENT OWNER: LARGE ENTITY |
|
| FPAY | Fee payment |
Year of fee payment: 12 |
|
| FPAY | Fee payment |
Year of fee payment: 12 |
|
| SULP | Surcharge for late payment |
Year of fee payment: 11 |
|
| AS | Assignment |
Owner name: THOMSON FINANCIAL LLC, DELAWARE Free format text: MERGER;ASSIGNOR:STARMINE CORPORATION;REEL/FRAME:037725/0109 Effective date: 20081224 Owner name: THOMSON REUTERS (MARKETS) LLC, NEW YORK Free format text: CHANGE OF NAME;ASSIGNOR:THOMSON FINANCIAL LLC;REEL/FRAME:037813/0169 Effective date: 20090309 |
|
| AS | Assignment |
Owner name: THOMSON FINANCIAL LLC, NEW YORK Free format text: MERGER AND CHANGE OF NAME;ASSIGNORS:STARMINE CORPORATION;THOMSON FINANCIAL LLC;REEL/FRAME:037868/0801 Effective date: 20081231 Owner name: THOMSON REUTERS (MARKETS) LLC, NEW YORK Free format text: CHANGE OF NAME;ASSIGNOR:THOMSON FINANCIAL LLC;REEL/FRAME:037974/0008 Effective date: 20090313 |
|
| AS | Assignment |
Owner name: THOMSON REUTERS GLOBAL RESOURCES, SWITZERLAND Free format text: ASSIGNMENT OF ASSIGNORS INTEREST;ASSIGNOR:THOMSON REUTERS (MARKETS) LLC;REEL/FRAME:038087/0657 Effective date: 20160317 |
|
| AS | Assignment |
Owner name: THOMSON REUTERS GLOBAL RESOURCES UNLIMITED COMPANY Free format text: CHANGE OF NAME;ASSIGNOR:THOMSON REUTERS GLOBAL RESOURCES;REEL/FRAME:044298/0799 Effective date: 20161121 |
|
| AS | Assignment |
Owner name: BANK OF AMERICA, N.A., AS COLLATERAL AGENT, NORTH CAROLINA Free format text: SECURITY AGREEMENT;ASSIGNOR:THOMSON REUTERS (GRC) INC.;REEL/FRAME:047185/0215 Effective date: 20181001 Owner name: BANK OF AMERICA, N.A., AS COLLATERAL AGENT, NORTH Free format text: SECURITY AGREEMENT;ASSIGNOR:THOMSON REUTERS (GRC) INC.;REEL/FRAME:047185/0215 Effective date: 20181001 |
|
| AS | Assignment |
Owner name: DEUTSCHE BANK AG NEW YORK BRANCH, AS COLLATERAL AGENT, NEW YORK Free format text: SECURITY AGREEMENT;ASSIGNOR:THOMSON REUTERS (GRC) INC.;REEL/FRAME:047187/0316 Effective date: 20181001 Owner name: DEUTSCHE BANK AG NEW YORK BRANCH, AS COLLATERAL AG Free format text: SECURITY AGREEMENT;ASSIGNOR:THOMSON REUTERS (GRC) INC.;REEL/FRAME:047187/0316 Effective date: 20181001 |
|
| AS | Assignment |
Owner name: THOMSON REUTERS (GRC) INC., NEW YORK Free format text: ASSIGNMENT OF ASSIGNORS INTEREST;ASSIGNOR:THOMSON REUTERS GLOBAL RESOURCES UNLIMITED COMPANY;REEL/FRAME:047778/0235 Effective date: 20181126 |
|
| AS | Assignment |
Owner name: THOMSON REUTERS (GRC) LLC, NEW YORK Free format text: CHANGE OF NAME;ASSIGNOR:THOMSON REUTERS (GRC) INC.;REEL/FRAME:047964/0065 Effective date: 20181201 |
|
| AS | Assignment |
Owner name: REFINITIV US ORGANIZATION LLC, NEW YORK Free format text: CHANGE OF NAME;ASSIGNOR:THOMSON REUTERS (GRC) LLC;REEL/FRAME:048645/0687 Effective date: 20190228 |
|
| AS | Assignment |
Owner name: REFINITIV US ORGANIZATION LLC (F/K/A THOMSON REUTERS (GRC) INC.), NEW YORK Free format text: RELEASE BY SECURED PARTY;ASSIGNOR:BANK OF AMERICA, N.A., AS COLLATERAL AGENT;REEL/FRAME:055174/0836 Effective date: 20210129 Owner name: REFINITIV US ORGANIZATION LLC (F/K/A THOMSON REUTERS (GRC) INC.), NEW YORK Free format text: RELEASE BY SECURED PARTY;ASSIGNOR:DEUTSCHE BANK TRUST COMPANY AMERICAS, AS NOTES COLLATERAL AGENT;REEL/FRAME:055174/0811 Effective date: 20210129 |