US6961072B2 - Method and system for viewing chromatographic peaks over a network - Google Patents
Method and system for viewing chromatographic peaks over a network Download PDFInfo
- Publication number
- US6961072B2 US6961072B2 US10/126,378 US12637802A US6961072B2 US 6961072 B2 US6961072 B2 US 6961072B2 US 12637802 A US12637802 A US 12637802A US 6961072 B2 US6961072 B2 US 6961072B2
- Authority
- US
- United States
- Prior art keywords
- image file
- datafile
- server
- metafile
- screen display
- Prior art date
- Legal status (The legal status is an assumption and is not a legal conclusion. Google has not performed a legal analysis and makes no representation as to the accuracy of the status listed.)
- Expired - Lifetime, expires
Links
Images


Classifications
-
- H—ELECTRICITY
- H04—ELECTRIC COMMUNICATION TECHNIQUE
- H04L—TRANSMISSION OF DIGITAL INFORMATION, e.g. TELEGRAPHIC COMMUNICATION
- H04L67/00—Network arrangements or protocols for supporting network services or applications
- H04L67/01—Protocols
- H04L67/02—Protocols based on web technology, e.g. hypertext transfer protocol [HTTP]
-
- G—PHYSICS
- G16—INFORMATION AND COMMUNICATION TECHNOLOGY [ICT] SPECIALLY ADAPTED FOR SPECIFIC APPLICATION FIELDS
- G16B—BIOINFORMATICS, i.e. INFORMATION AND COMMUNICATION TECHNOLOGY [ICT] SPECIALLY ADAPTED FOR GENETIC OR PROTEIN-RELATED DATA PROCESSING IN COMPUTATIONAL MOLECULAR BIOLOGY
- G16B45/00—ICT specially adapted for bioinformatics-related data visualisation, e.g. displaying of maps or networks
Definitions
- the present invention relates to a method and system of publishing datafile and metafile images, as well as information relevant to those images, over a network, particularly one using Internet or intranet technology.
- the present invention uses server application technology and JavaScript to allow a user to view GC or GC-MS traces interactively, without downloading or running any application other than the web browser.
- the method publishes datafile and metafile images and relevant information over a network, using Internet or intranet technology.
- processed data files consisting of analytical results are stored on a server at a location separate from the user; i.e., at an analytical laboratory or other storage facility.
- a user such as a geochemist, accesses the data over the Internet, selecting a datafile which references a GC or GC-MS analysis he wishes to view, then transmitting the name of that datafile over a network connection to the server which uses the method of the present invention (hereinafter sometimes called the peak viewing program).
- the peak viewing program which is built using Microsoft Active Service Page (ASP) technology, runs on Microsoft Internet Information Server.
- ASP Microsoft Active Service Page
- the chromatogram trace of the requested GC or GC-MS analysis is generated and converted to a picture (i.e., a .PNG file) by Chromview and MetaConverter, which are components running on the server; the picture is sent to the user on a web page for viewing, zooming, and turning on/off various trace attributes.
- Chromview and MetaConverter components operate on the server, the user does not download or operate any software. The entire operation occurs over a browser window, and it functions within the parameters of normal browser capacity and security.
- the requested datafile could reference a GC-MS analysis, with a variety of ions available for viewing.
- the list of available ions would appear beside the image, each one acting as a hyperlink which would transmit to the server the name of the datafile and the ion requested. If one of the hyperlinks is clicked, the information goes to the server, generating a new .PNG file matching the selected ion, which appears on the screen, again with the list of available ions. If the user wishes to enlarge his view of a particular amplitude or time-related start and end points, he can enter the points he would like to “zoom in” on in a side menu box, or he can use the mouse to select the area to be enlarged by two mouse clicks, one at each diagonal corner of a rectangle defining the area.
- the peak viewing program of the present invention can be plugged into any website that wishes to display GC or GC-MS data online.
- the peak viewing program can read multiple output file formats generated from different vendors.
- Laboratories that deal with GC and GC-MS data can use the peak viewing program as an internal quality control tool or as a data delivery method.
- Chemists who deal with GC and GC-MS data can use the peak viewing program as an add-on to their web-based data browser.
- Yet another object of the present invention is to allow users all over the world to access data residing in a central data storage location.
- Still another object of the present invention is to allow a user to “zoom in” on an area of a chromatogram or fragmentogram without using a downloaded applet.
- a further object of the present invention is to allow a user to “zoom in” on an area of a chromatogram or fragmentogram with two clicks of his mouse, with a process using JavaScript technology coupled with a back-end server application.
- a still further object of the present invention is to allow a user to retrieve a list of available ions and select one or more for processing and display.
- Another object of the present invention is to allow a user to access GC and GC-MS data residing on a server via the Internet, dynamically re-create the chromatograms and fragmentograms from processed data, and display and change attributes of the resulting images.
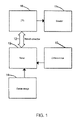
- FIG. 1 depicts a simplified block diagram of the components suitable for practicing a preferred embodiment of the present invention.
- FIG. 2 is a flowchart diagram illustrating the process steps of the present invention.
- FIG. 3 is a representation of a page displaying a list of samples a geochemist may use for selecting data.
- FIG. 4 is a representation of a page displaying a list of data types for which datafiles are available.
- FIG. 5 is a representation of a page displaying a list of thumbnail .PNG files showing images or ions a user can select to view using the present invention.
- FIG. 6 is a representation of a page displaying a chromatogram trace of an ion, the PNG image of which was generated from the datafile.
- FIG. 7 is a representation of a page displaying a picture of a 191 ion trace.
- FIG. 8 is a representation of a page displaying the picture generated by use of peak and baseline labels.
- FIG. 9 is a representation of a page displaying a chromatogram trace, the rectangle (in dotted lines) representing the area selected for enlargement.
- FIG. 10 is a representation of a page displaying the picture generated by the “zoom in” function of the present invention, which has enlarged the rectangular area (in dotted lines) selected in FIG. 9 .
- the user can be coupled over a network's setting or can access the server remotely via an Internet connection.
- the connection operates using Hypertext Transfer Protocol (HTTP).
- HTTP Hypertext Transfer Protocol
- a scientist can “use” the peak viewing program of the present invention by operating a client computer 10 to open a website with the browser 11 ; he clicks on a link to send information over the network connection 12 to the server 13 using Hypertext Markup Language (HTML).
- HTML Hypertext Markup Language
- the information which is processed using Visual Basic and Active Server Pages, relates to GC and GC-MS data in the datafile storage 14 .
- the server 13 uses Chromview.exe 15 to generate a metafile of the selected datafile, then MetaConverts converts the metafile to a .PNG file, then a Chromview and MetaConverter generate a larger image of the file over the browser 11 , along with other information. Since Chromview and MetaConverter (hereinafter simply referred to as Chromview) operate on the server 13 , the user does not need to download or operate any software.
- the browser opens a website showing chromatographic information of interest to the user. Links on the page are associated with the peaks of different chromatograms in the datafile.
- Chromview is activated and, at 23 , chromatographic peaks and related information are sent to the website and displayed to the user.
- the user may select new start/end times and/or amplitudes for the peaks. That information, again at 22 , is sent to the server and processed, Chromview is activated, and, at 23 , new chromatographic peaks and related information are displayed to the user.
- one or more ions may be selected for viewing, or peak/baseline labels may be added for either GC or GC-MS data, and, at 22 , the information is sent to the server 13 and processed, Chromview is activated, and, at 23 , new chromatographic peaks and related information are displayed to the user.
- Shown in FIG. 3 is a sample list 30 produced by an application used to acquire data so that a datafile can be identified and retrieved by the peak viewing program.
- the list allows a user to select from available samples 31 , 32 , 33 by clicking on any of them and selecting the submit sample button 34 , which sends the request to the server and saves it in a session variable.
- the sample is linked to a database and, if datafile information is available for the sample, that information can be retrieved and used to send the datafile information to the peak viewing program.
- the reset button 35 allows a user to reset the window.
- Shown in FIG. 4 is a list 40 of different available traces 41 , 42 , 43 .
- the user can click on one or more of them and then click on the choose ion button 44 in order to see a thumbnail of the related datafiles (see FIG. 5 , infra).
- the choose ion button 44 is activated, the information regarding the related datafile is sent through a network connection to the server, where the application Chromview generates a small .PNG file of that trace.
- the .PNG file is then displayed in a list of .PNG files (if more than one is selected) or by itself.
- FIG. 5 shows a list 50 of thumbnail .PNG files with the images of ions 51 , 52 , 53 a user may wish to view in a larger .PNG format using the peak viewing program.
- These images of ions 51 , 52 , 53 were generated by the user's actions described above; in this instance, the user chose to view all three of the ions listed in list 40 in FIG. 4 , supra.
- the image of each of the ions 51 , 52 , 53 is linked to the name and path of the related datafile, each of which is hosted on the server, which is on the same network as the web server hosting the peak viewing program.
- Each thumbnail .PNG file acts as a hyperlink to the peak viewing program site. Included in the hyperlink is the path of the datafile.
- the browser window When a hyperlink is clicked, the browser window is redirected to the peak viewing program and the datafile information is retrieved, using a server side script that retrieves the name of the path and maps it accordingly. A large .PNG file is then generated, and the peak viewing program application is launched.
- FIG. 6 shows a base example of an image 60 produced by the peak viewing program application.
- the trace 61 shown is a .PNG image of an ion that has been generated from the datafile or series of datafiles.
- the datafile is found on a network server within the same network as the peak viewing program application. (It does not have to be on the same server, merely on the same network.)
- Chromview processes it and uses it to generate a .PNG file.
- the .PNG image it generates is called a Total Ion Count (a TIC).
- a TIC Total Ion Count
- an ion list 62 appears in the space on the right side of the image 60 .
- Each ion is a hyperlink (created on the server using ASP and set to the user's browser and generated as HTML). By clicking on the link, the process that generated the TIC will repeat itself to generate the appropriate image for that ion (see discussion in FIG. 7 , infra).
- Above the ion list 62 is a time start and end 63 (retention time) and an amplitude start and end 64 .
- the TIC image by default appears with the maximum time and amplitude displayed, and with no peaks or baselines. If the user wishes to see a set of start and end points different than the maximum, he can click on the desired points on the .PNG image (see FIG.
- a peak label checkbox 65 and a baseline checkbox 66 On the upper right of the image 60 is a peak label checkbox 65 and a baseline checkbox 66 .
- a peak label checkbox 65 and a baseline checkbox 66 By default, neither checkbox 65 , 66 is checked. However, if a user chooses to check either check box 65 , 66 , he then clicks the update button 67 , which is generated by HTML.
- a .PNG file is generated as described in FIG. 8 , infra.
- the user could be performing these tasks remotely or within a network connection.
- the server with the peak viewing program application and the datafiles must be on the same network.
- FIG. 7 shows an image 70 of a 191-ion 71 , which was selected for viewing by the user in FIG. 6 , supra.
- the name of the ion 72 is listed above the list 73 of available ions. Any other ion may be selected in a similar manner.
- the maximum amplitude and start and end times are plotted out in the .PNG files.
- the start and end times 74 and the amplitude 75 may be changed by clicking on the opposite corners of the area to be enlarged, or by changing the values in the start and end text boxes 74 or the amplitude boxes 75 .
- peaks and baselines can be added by checking the peak box 76 , or the baseline box 77 .
- FIG. 8 shows an image 80 of a chromatogram trace 81 with peak and baseline labels 82 displayed. This information is contained within the datafiles, but is not displayed by default. If the peak box 83 or the baseline box 84 has been checked, and the image updated, the datafile information for the peaks and labels will have been retrieved from the server, and a new .PNG image processed by Chromview. To the user, the same image will appear to remain, with only the labels appearing. A user may select to view only baselines or only peaks. Similarly, values other than defaults may be entered for start and end for amplitude and/or time, in which case the labels will be plotted as well as described.
- the dotted lines form a rectangle 91 representing an area of a chromatogram trace 92 the user has selected to “zoom in” and enlarge.
- the process may be done by clicking on opposite corners 93 , 94 of the area to be enlarged, or by entering new start and end times 95 or amplitudes 96 in the textboxes, and clicking on the update button 97 .
- the resulting trace is shown in FIG. 10 , infra.
- an image 101 showing an enlarged section of the chromatogram trace 102 As shown in FIG. 10 , an image 101 showing an enlarged section of the chromatogram trace 102 . A new .PNG image was generated, plotting only the values defined by the user. Peaks and baselines can be added to the image and, unless otherwise specified by the user, the same start and end points will be returned automatically.
Abstract
Description
Claims (19)
Priority Applications (1)
| Application Number | Priority Date | Filing Date | Title |
|---|---|---|---|
| US10/126,378 US6961072B2 (en) | 2002-04-19 | 2002-04-19 | Method and system for viewing chromatographic peaks over a network |
Applications Claiming Priority (1)
| Application Number | Priority Date | Filing Date | Title |
|---|---|---|---|
| US10/126,378 US6961072B2 (en) | 2002-04-19 | 2002-04-19 | Method and system for viewing chromatographic peaks over a network |
Publications (2)
| Publication Number | Publication Date |
|---|---|
| US20030197717A1 US20030197717A1 (en) | 2003-10-23 |
| US6961072B2 true US6961072B2 (en) | 2005-11-01 |
Family
ID=29215019
Family Applications (1)
| Application Number | Title | Priority Date | Filing Date |
|---|---|---|---|
| US10/126,378 Expired - Lifetime US6961072B2 (en) | 2002-04-19 | 2002-04-19 | Method and system for viewing chromatographic peaks over a network |
Country Status (1)
| Country | Link |
|---|---|
| US (1) | US6961072B2 (en) |
Cited By (4)
| Publication number | Priority date | Publication date | Assignee | Title |
|---|---|---|---|---|
| US20030225734A1 (en) * | 2002-06-04 | 2003-12-04 | Evan Witt | Interactive diagram in markup language page |
| US20050168353A1 (en) * | 2004-01-16 | 2005-08-04 | Mci, Inc. | User interface for defining geographic zones for tracking mobile telemetry devices |
| US20060125826A1 (en) * | 2004-12-10 | 2006-06-15 | Lubkowitz Joaquin A | Method and system for mass spectrometry and gas chromatographic data analysis |
| CN108921802A (en) * | 2018-06-29 | 2018-11-30 | 联想(北京)有限公司 | A kind of image processing method and device |
Citations (7)
| Publication number | Priority date | Publication date | Assignee | Title |
|---|---|---|---|---|
| US6025844A (en) | 1997-06-12 | 2000-02-15 | Netscape Communications Corporation | Method and system for creating dynamic link views |
| US6035323A (en) * | 1997-10-24 | 2000-03-07 | Pictra, Inc. | Methods and apparatuses for distributing a collection of digital media over a network with automatic generation of presentable media |
| US6052110A (en) | 1998-05-11 | 2000-04-18 | Sony Corporation | Dynamic control of zoom operation in computer graphics |
| US6175832B1 (en) * | 1998-05-11 | 2001-01-16 | International Business Machines Corporation | Method, system and program product for establishing a data reporting and display communication over a network |
| US6195449B1 (en) * | 1997-05-18 | 2001-02-27 | Robert Bogden | Method and apparatus for analyzing data files derived from emission spectra from fluorophore tagged nucleotides |
| US6243865B1 (en) * | 1998-04-01 | 2001-06-05 | Multiscience System Ptl Ltd. | Method of relaying digital video & audio data via a communication media |
| US6260044B1 (en) * | 1998-02-04 | 2001-07-10 | Nugenesis Technologies Corporation | Information storage and retrieval system for storing and retrieving the visual form of information from an application in a database |
-
2002
- 2002-04-19 US US10/126,378 patent/US6961072B2/en not_active Expired - Lifetime
Patent Citations (7)
| Publication number | Priority date | Publication date | Assignee | Title |
|---|---|---|---|---|
| US6195449B1 (en) * | 1997-05-18 | 2001-02-27 | Robert Bogden | Method and apparatus for analyzing data files derived from emission spectra from fluorophore tagged nucleotides |
| US6025844A (en) | 1997-06-12 | 2000-02-15 | Netscape Communications Corporation | Method and system for creating dynamic link views |
| US6035323A (en) * | 1997-10-24 | 2000-03-07 | Pictra, Inc. | Methods and apparatuses for distributing a collection of digital media over a network with automatic generation of presentable media |
| US6260044B1 (en) * | 1998-02-04 | 2001-07-10 | Nugenesis Technologies Corporation | Information storage and retrieval system for storing and retrieving the visual form of information from an application in a database |
| US6243865B1 (en) * | 1998-04-01 | 2001-06-05 | Multiscience System Ptl Ltd. | Method of relaying digital video & audio data via a communication media |
| US6052110A (en) | 1998-05-11 | 2000-04-18 | Sony Corporation | Dynamic control of zoom operation in computer graphics |
| US6175832B1 (en) * | 1998-05-11 | 2001-01-16 | International Business Machines Corporation | Method, system and program product for establishing a data reporting and display communication over a network |
Non-Patent Citations (4)
| Title |
|---|
| Dessy, Ray. "Collect Your Wandering Thoughts". Analytical Chemistry. vol. 71, No. 13, pp. 482 A-483 A, 1999. * |
| Goffredo, Mary Ellen. "Data Management Solutions for the Enterprise". Chemistry in Britain. Mar. 2002. * |
| Microsoft(R) Word 2000 (Copyright 1983-1999). * |
| Williams, Dave. "Making Scientific Data an Enduring Asset". BIOPHARM, Mar. 2001. * |
Cited By (5)
| Publication number | Priority date | Publication date | Assignee | Title |
|---|---|---|---|---|
| US20030225734A1 (en) * | 2002-06-04 | 2003-12-04 | Evan Witt | Interactive diagram in markup language page |
| US20050168353A1 (en) * | 2004-01-16 | 2005-08-04 | Mci, Inc. | User interface for defining geographic zones for tracking mobile telemetry devices |
| US20060125826A1 (en) * | 2004-12-10 | 2006-06-15 | Lubkowitz Joaquin A | Method and system for mass spectrometry and gas chromatographic data analysis |
| CN108921802A (en) * | 2018-06-29 | 2018-11-30 | 联想(北京)有限公司 | A kind of image processing method and device |
| US11288776B2 (en) | 2018-06-29 | 2022-03-29 | Lenovo (Beijing) Co., Ltd. | Method and apparatus for image processing |
Also Published As
| Publication number | Publication date |
|---|---|
| US20030197717A1 (en) | 2003-10-23 |
Similar Documents
| Publication | Publication Date | Title |
|---|---|---|
| US7370287B2 (en) | Dynamic controls for use in computing applications | |
| US6538673B1 (en) | Method for extracting digests, reformatting, and automatic monitoring of structured online documents based on visual programming of document tree navigation and transformation | |
| US20060123356A1 (en) | Dynamic and updateable computing application panes | |
| US6571245B2 (en) | Virtual desktop in a computer network | |
| US6412008B1 (en) | System and method for cooperative client/server customization of web pages | |
| US7376653B2 (en) | Creating dynamic web pages at a client browser | |
| US20040054968A1 (en) | Web page with system for displaying miniature visual representations of search engine results | |
| US5737560A (en) | Graphical method and system for accessing information on a communications network | |
| US7287229B2 (en) | Template-driven process system | |
| US20020026441A1 (en) | System and method for integrating multiple applications | |
| US20070130518A1 (en) | Method and apparatus for a personalized web page | |
| US6505343B1 (en) | Document/view application development architecture applied to ActiveX technology for web based application delivery | |
| US7577672B2 (en) | Systems and methods for providing a portal including multiple windows | |
| WO2001025908A2 (en) | Presentation service architectures for netcentric computing systems | |
| JP2006309801A (en) | Distributed publishing for hypermedia on wide area network and integrated development platform for management | |
| GB2361858A (en) | Displaying pages downloaded from over a network in multiple application windows | |
| US20060059422A1 (en) | Desktop application implemented with web paradigm | |
| US20030149749A1 (en) | Method of data refreshing of a mark-up- language document | |
| US20130159480A1 (en) | Smart Browsing Providers | |
| US6931602B1 (en) | Approach facilitating the selection of various machine vision functionality from among different platforms | |
| GB2360431A (en) | Presenting data in a limited display area | |
| US6961072B2 (en) | Method and system for viewing chromatographic peaks over a network | |
| AU779907B2 (en) | Method for extracting digests, reformatting and automatic monitoring of structured online documents based on visual programming of document tree navigation and transformation | |
| EP1388782B1 (en) | Method and computer system for providing stateful favorites | |
| Kleinow et al. | Client/server based statistical computing |
Legal Events
| Date | Code | Title | Description |
|---|---|---|---|
| AS | Assignment |
Owner name: INFOLOGIC, INC., TEXAS Free format text: ASSIGNMENT OF ASSIGNORS INTEREST;ASSIGNOR:XU, YUBO;REEL/FRAME:012825/0114 Effective date: 20020419 |
|
| AS | Assignment |
Owner name: INFOLOGIC, INC., TEXAS Free format text: ASSIGNMENT OF ASSIGNORS INTEREST;ASSIGNORS:STANSBURY, DAVID;GUO, JIANDONG;FURR, DAVID;REEL/FRAME:013994/0091;SIGNING DATES FROM 20030210 TO 20030408 |
|
| STCF | Information on status: patent grant |
Free format text: PATENTED CASE |
|
| AS | Assignment |
Owner name: OMNI LABORATORIES, INC., TEXAS Free format text: ASSIGNMENT OF ASSIGNORS INTEREST;ASSIGNOR:INFOLOGIC, INC.;REEL/FRAME:020941/0942 Effective date: 20080509 |
|
| FEPP | Fee payment procedure |
Free format text: PAT HOLDER NO LONGER CLAIMS SMALL ENTITY STATUS, ENTITY STATUS SET TO UNDISCOUNTED (ORIGINAL EVENT CODE: STOL); ENTITY STATUS OF PATENT OWNER: SMALL ENTITY |
|
| REFU | Refund |
Free format text: REFUND - SURCHARGE, PETITION TO ACCEPT PYMT AFTER EXP, UNINTENTIONAL (ORIGINAL EVENT CODE: R2551); ENTITY STATUS OF PATENT OWNER: SMALL ENTITY |
|
| FEPP | Fee payment procedure |
Free format text: PAYOR NUMBER ASSIGNED (ORIGINAL EVENT CODE: ASPN); ENTITY STATUS OF PATENT OWNER: SMALL ENTITY |
|
| FPAY | Fee payment |
Year of fee payment: 4 |
|
| FPAY | Fee payment |
Year of fee payment: 8 |
|
| FPAY | Fee payment |
Year of fee payment: 12 |
|
| AS | Assignment |
Owner name: WEATHERFORD LABORATORIES, INC., TEXAS Free format text: CHANGE OF NAME;ASSIGNOR:OMNI LABORATORIES, INC.;REEL/FRAME:047139/0891 Effective date: 20090706 |
|
| AS | Assignment |
Owner name: WEATHERFORD TECHNOLOGY HOLDINGS, LLC, TEXAS Free format text: ASSIGNMENT OF ASSIGNORS INTEREST;ASSIGNOR:WEATHERFORD LABORATORIES, INC.;REEL/FRAME:046056/0570 Effective date: 20180611 |
|
| AS | Assignment |
Owner name: WEATHERFORD LABORATORIES, INC., TEXAS Free format text: CHANGE OF NAME;ASSIGNOR:OMNI LABORATORIES, INC.;REEL/FRAME:047473/0599 Effective date: 20090825 |
|
| AS | Assignment |
Owner name: WEATHERFORD LABORATORIES, LLC, TEXAS Free format text: CERTIFICATE OF CONVERSION;ASSIGNOR:WEATHERFORD LABORATORIES, INC.;REEL/FRAME:049056/0313 Effective date: 20190429 Owner name: STRATUM RESERVOIR , LLC, TEXAS Free format text: CERTIFICATE OF CHANGE OF NAME;ASSIGNOR:WEATHERFORD LABORATORIES, LLC;REEL/FRAME:049056/0373 Effective date: 20190430 |
|
| AS | Assignment |
Owner name: JPMORGAN CHASE BANK, N.A., AS ADMINISTRATIVE AGENT Free format text: GRANT OF SECURITY INTEREST IN PATENT RIGHTS;ASSIGNOR:STRATUM RESERVOIR, LLC;REEL/FRAME:049234/0423 Effective date: 20190430 |
|
| FEPP | Fee payment procedure |
Free format text: ENTITY STATUS SET TO SMALL (ORIGINAL EVENT CODE: SMAL); ENTITY STATUS OF PATENT OWNER: SMALL ENTITY |
|
| AS | Assignment |
Owner name: STRATUM RESERVOIR, LLC, TEXAS Free format text: NOTICE OF TERMINATION AND RELEASE OF SECURITY INTEREST IN PATENT RIGHTS;ASSIGNOR:JPMORGAN CHASE BANK, N.A.;REEL/FRAME:060116/0332 Effective date: 20220513 |