US7970674B2 - Automatically determining a current value for a real estate property, such as a home, that is tailored to input from a human user, such as its owner - Google Patents
Automatically determining a current value for a real estate property, such as a home, that is tailored to input from a human user, such as its owner Download PDFInfo
- Publication number
- US7970674B2 US7970674B2 US11/347,024 US34702406A US7970674B2 US 7970674 B2 US7970674 B2 US 7970674B2 US 34702406 A US34702406 A US 34702406A US 7970674 B2 US7970674 B2 US 7970674B2
- Authority
- US
- United States
- Prior art keywords
- home
- valuation
- distinguished
- attributes
- owner
- Prior art date
- Legal status (The legal status is an assumption and is not a legal conclusion. Google has not performed a legal analysis and makes no representation as to the accuracy of the status listed.)
- Active, expires
Links
Images


Classifications
-
- G—PHYSICS
- G06—COMPUTING; CALCULATING OR COUNTING
- G06Q—INFORMATION AND COMMUNICATION TECHNOLOGY [ICT] SPECIALLY ADAPTED FOR ADMINISTRATIVE, COMMERCIAL, FINANCIAL, MANAGERIAL OR SUPERVISORY PURPOSES; SYSTEMS OR METHODS SPECIALLY ADAPTED FOR ADMINISTRATIVE, COMMERCIAL, FINANCIAL, MANAGERIAL OR SUPERVISORY PURPOSES, NOT OTHERWISE PROVIDED FOR
- G06Q30/00—Commerce
- G06Q30/02—Marketing; Price estimation or determination; Fundraising
-
- G—PHYSICS
- G06—COMPUTING; CALCULATING OR COUNTING
- G06Q—INFORMATION AND COMMUNICATION TECHNOLOGY [ICT] SPECIALLY ADAPTED FOR ADMINISTRATIVE, COMMERCIAL, FINANCIAL, MANAGERIAL OR SUPERVISORY PURPOSES; SYSTEMS OR METHODS SPECIALLY ADAPTED FOR ADMINISTRATIVE, COMMERCIAL, FINANCIAL, MANAGERIAL OR SUPERVISORY PURPOSES, NOT OTHERWISE PROVIDED FOR
- G06Q10/00—Administration; Management
- G06Q10/10—Office automation; Time management
-
- G—PHYSICS
- G06—COMPUTING; CALCULATING OR COUNTING
- G06Q—INFORMATION AND COMMUNICATION TECHNOLOGY [ICT] SPECIALLY ADAPTED FOR ADMINISTRATIVE, COMMERCIAL, FINANCIAL, MANAGERIAL OR SUPERVISORY PURPOSES; SYSTEMS OR METHODS SPECIALLY ADAPTED FOR ADMINISTRATIVE, COMMERCIAL, FINANCIAL, MANAGERIAL OR SUPERVISORY PURPOSES, NOT OTHERWISE PROVIDED FOR
- G06Q30/00—Commerce
- G06Q30/02—Marketing; Price estimation or determination; Fundraising
- G06Q30/0278—Product appraisal
-
- G—PHYSICS
- G06—COMPUTING; CALCULATING OR COUNTING
- G06Q—INFORMATION AND COMMUNICATION TECHNOLOGY [ICT] SPECIALLY ADAPTED FOR ADMINISTRATIVE, COMMERCIAL, FINANCIAL, MANAGERIAL OR SUPERVISORY PURPOSES; SYSTEMS OR METHODS SPECIALLY ADAPTED FOR ADMINISTRATIVE, COMMERCIAL, FINANCIAL, MANAGERIAL OR SUPERVISORY PURPOSES, NOT OTHERWISE PROVIDED FOR
- G06Q40/00—Finance; Insurance; Tax strategies; Processing of corporate or income taxes
-
- G—PHYSICS
- G06—COMPUTING; CALCULATING OR COUNTING
- G06Q—INFORMATION AND COMMUNICATION TECHNOLOGY [ICT] SPECIALLY ADAPTED FOR ADMINISTRATIVE, COMMERCIAL, FINANCIAL, MANAGERIAL OR SUPERVISORY PURPOSES; SYSTEMS OR METHODS SPECIALLY ADAPTED FOR ADMINISTRATIVE, COMMERCIAL, FINANCIAL, MANAGERIAL OR SUPERVISORY PURPOSES, NOT OTHERWISE PROVIDED FOR
- G06Q50/00—Systems or methods specially adapted for specific business sectors, e.g. utilities or tourism
- G06Q50/10—Services
- G06Q50/16—Real estate
Definitions
- the described technology is directed to the field of electronic commerce techniques, and, more particularly, to the field of electronic commerce techniques relating to real estate.
- taxing bodies can equitably set property tax levels; sellers and their agents can optimally set listing prices; and buyers and their agents can determine appropriate offer amounts.
- FIG. 1 is a block diagram showing some of the components typically incorporated in at least some of the computer systems and other devices on which the facility executes.
- FIG. 2 is a flow diagram showing steps typically performed by the facility to automatically determine current values for homes in a geographic area.
- FIG. 3 is a table diagram showing sample contents of a recent sales table.
- FIG. 4A is a flow diagram showing steps typically performed by the facility in order to construct a tree.
- FIG. 4B is a flow diagram showing steps typically performed by the facility in order to determine whether and how to split a node of a tree.
- FIG. 5 is a table diagram showing sample contents of a basis table containing the basis information selected for the tree.
- FIG. 6 is a tree diagram showing a root node corresponding to the basis table 500 .
- FIG. 7 is a tree diagram showing a completed version of the sample tree.
- FIG. 8 is a flow diagram showing steps typically performed by the facility in order to score a tree.
- FIG. 9 is a table diagram showing sample results for scoring a tree.
- FIG. 10 is a display diagram showing detailed information about an individual home.
- FIG. 11 is a display diagram showing a map identifying a number of homes in the same geographic area.
- FIG. 12 is a display diagram showing a display typically presented by the facility containing the attributes of a particular home.
- FIG. 13 is a display diagram showing a display typically presented by the facility to identify possible comparable sales on a map.
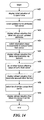
- FIG. 14 is a flow diagram showing steps typically performed by the facility in order to tailor a valuation of a subject home based on information provided by a user such as the home's owner.
- FIG. 15 is a display diagram showing a sample display typically presented by the facility to display an initial valuation of the subject home and solicit updated home attributes from the user.
- FIG. 16 is a display diagram showing a typical display presented by the facility to permit the user to describe improvements made to the subject home.
- FIG. 17 is a display diagram showing a sample display typically presented by the facility to enable the user to describe other aspects of the subject home that affect its value.
- FIG. 18 is a display diagram showing a sample display presented by the facility in order to enable the user to identify comps regarded by the owner as similar to the subject home.
- FIGS. 19A-19F show a sample display typically presented by the facility in order to present an overall revised value for the subject home.
- FIG. 20 is a table diagram showing sample contents of recent sales information used to construct a linear regression valuation model that is based on the attributes whose values are available for the user to update in the first step of the process of generating a tailored valuation.
- a software facility for automatically determining a current value for a home or other property that is tailored to input from its owner or another user (“the facility”) is described. While the following discussion liberally employs the word “home” to refer to the property being valued in other nearby properties, those skilled in the art will appreciate that the facility may be straightforwardly applied to properties of other types. Similarly, while a wide variety of users may use the facility, including the owner, an agent or other person representing the owner, a prospective buyer, an agent or other person representing prospective buyer, or another third party.
- the facility uses a web site to receive information from a user and display to the user a refined valuation for the home that is based upon the information provided by the user.
- the information provided by the user may include additional, corrected, and/or updated attributes of the home relative to the attributes known by the facility, such as attributes retrieved by the facility from a public or private database of home attributes; information about improvements to the home; information about other factors likely to affect the value of the home, such as well-kept grounds, historical significance, ground water issues, etc.; and information identifying, among recent, nearby sales of comparable homes (“comps”), those that the user regards as the most similar to the subject home.
- the facility displays the results of refining its valuation in a manner that makes clear how the valuation was affected by the different information provided by the user.
- the facility in many cases makes the valuation more accurate than would otherwise be possible, and/or helps the user to more fully accept the valuation as appropriate.
- the facility constructs and/or applies housing price models each constituting a forest of classification trees.
- the facility uses a data table that identifies, for each of a number of homes recently sold in the geographic region to which the forest corresponds, attributes of the home and its selling price. For each of the trees comprising the forest, the facility randomly selects a fraction of homes identified in the table, as well as a fraction of the attributes identified in the table. The facility uses the selected attributes of the selected homes, together with the selling prices of the selected homes, to construct a classification tree in which each non-leaf node represents a basis for differentiating selected homes based upon one of the selected attributes.
- a non-leaf node may represent the test “number of bedrooms ⁇ 4.” This node defines 2 subtrees in the tree: one representing the selected homes having 4 or fewer bedrooms, the other representing the selected homes having 5 or more bedrooms.
- Each leaf node of the tree represents all of the selected homes having attributes matching the ranges of attribute values corresponding to the path from the tree's root node to the leaf node.
- the facility assigns each leaf node a value corresponding to the mean of the selling prices of the selected homes represented by the leaf node.
- the facility estimates the selling price of a home in such an area based upon loan values associated with its sale and an estimated loan-to-value ratio.
- the facility In order to weight the trees of the forest, the facility further scores the usefulness of each tree by applying the tree to homes in the table other than the homes that were selected to construct the tree, and, for each such home, comparing the value indicated for the home by the classification tree (i.e., the value of the root leaf node into which the tree classifies the home) to its selling price. The closer the values indicated by the tree to the selling prices, the higher the score for the tree.
- the classification tree i.e., the value of the root leaf node into which the tree classifies the home
- a home's attributes may be inputted by a person familiar with them, such as the owner, a listing agent, or a person that derives the information from the owner or listing agent.
- the facility applies all of the trees of the forest to the home, so that each tree indicates a value for the home.
- the facility then calculates an average of these values, each weighted by the score for its tree, to obtain a value for the home.
- the facility presents this value to the owner of the home, a prospective buyer of the home, a real estate agent, or another person interested in the value of the home or the value of a group of homes including the home.
- the facility applies its model to the attributes of a large percentage of homes in a geographic area to obtain and convey an average home value for the homes in that area. In some embodiments, the facility periodically determines an average home value for the homes in a geographic area, and uses them as a basis for determining and conveying a home value index for the geographic area.
- the approach employed by the facility to determine the value of a home does not rely on the home having recently been sold, it can be used to accurately value virtually any home whose attributes are known or can be determined. Further, because this approach does not require the services of a professional appraiser, it can typically determine a home's value quickly and inexpensively, in a manner generally free from subjective bias.
- FIG. 1 is a block diagram showing some of the components typically incorporated in at least some of the computer systems and other devices on which the facility executes.
- These computer systems and devices 100 may include one or more central processing units (“CPUs”) 101 for executing computer programs; a computer memory 102 for storing programs and data—including data structures, database tables, other data tables, etc.—while they are being used; a persistent storage device 103 , such as a hard drive, for persistently storing programs and data; a computer-readable media drive 104 , such as a CD-ROM drive, for reading programs and data stored on a computer-readable medium; and a network connection 105 for connecting the computer system to other computer systems, such as via the Internet, to exchange programs and/or data—including data structures.
- CPUs central processing units
- a computer memory 102 for storing programs and data—including data structures, database tables, other data tables, etc.—while they are being used
- a persistent storage device 103 such as a hard drive, for persistently storing programs
- the facility can be accessed by any suitable user interface including Web services calls to suitable APIs. While computer systems configured as described above are typically used to support the operation of the facility, one of ordinary skill in the art will appreciate that the facility may be implemented using devices of various types and configurations, and having various components.
- FIG. 2 is a flow diagram showing steps typically performed by the facility to automatically determine current values for homes in a geographic area.
- the facility may perform these steps for one or more geographic areas of one or more different granularities, including neighborhood, city, county, state, country, etc. These steps may be performed periodically for each geographic area, such as daily.
- step 201 the facility selects recent sales occurring in the geographic area.
- the facility may use sales data obtained from a variety of public or private sources.
- FIG. 3 is a table diagram showing sample contents of a recent sales table.
- the recent sales table 300 is made up of rows 301 - 315 , each representing a home sale that occurred in a recent period of time, such as the preceding 60 days. Each row is divided into the following columns: an identifier column 321 containing an identifier for the sale; an address column 322 containing the address of the sold home; a square foot column 323 containing the floor area of the home; a bedrooms column 324 containing the number of bedrooms in the home; a bathrooms column 325 containing the number of bathrooms in the home; a floors column 326 containing the number of floors in the home; a view column 327 indicating whether the home has a view; a year column 328 showing the year in which the house was constructed; a selling price column 329 containing the selling price at which the home was sold; and a date column 330 showing the date on which the home was sold.
- row 301 indicates that sale number 1 of the home at 111 Main St., Hendricks, Ill. 62012 having a floor area of 1850 square feet, 4 bedrooms, 2 bathrooms, 2 floors, no view, built in 1953, was for $132,500, and occurred on Jan. 3, 2005. While the contents of recent sales table 300 were included to pose a comprehensible example, those skilled in the art will appreciate that the facility can use a recent sales table having columns corresponding to different and/or a larger number of attributes, as well as a larger number of rows.
- Attributes that may be used include, for example, construction materials, cooling technology, structure type, fireplace type, parking structure, driveway, heating technology, swimming pool type, roofing material, occupancy type, home design type, view type, view quality, lot size and dimensions, number of rooms, number of stories, school district, longitude and latitude, neighborhood or subdivision, tax assessment, attic and other storage, etc. For a variety of reasons, certain values may be omitted from the recent sales table. In some embodiments, the facility imputes missing values using the median value in the same column for continuous variables, or the mode (i.e., most frequent) value for categorical values.
- FIG. 3 and each of the table diagrams discussed below show a table whose contents and organization are designed to make them more comprehensible by a human reader, those skilled in the art will appreciate that actual data structures used by the facility to store this information may differ from the table shown, in that they, for example, may be organized in a different manner; may contain more or less information than shown; may be compressed and/or encrypted; etc.
- the facility constructs and scores a number of trees, such as 100. This number is configurable, with larger numbers typically yielding better results but requiring the application of greater computing resources.
- the facility constructs a tree. In some embodiments, the facility constructs and applies random forest valuation models using an R mathematical software package available at http://cran.r-project.org/ and described at http://www.maths.lth.se/help/R/.R/library/randomForest/html/randomForest.html. Step 203 is discussed in greater detail below in connection with FIG. 4 .
- the facility scores the tree constructed in step 203 . Step 204 is discussed in greater detail below in connection with FIG. 8 .
- the facility uses the forest of trees constructed and scored in steps 202 - 205 to process requests for home valuations.
- requests may be individually issued by users, or issued by a program, such as a program that automatically requests valuations for all homes in the geographic area at a standard frequency, such as daily, or a program that requests valuations for all of the homes occurring on a particular map in response to a request from a user to retrieve the map.
- the facility receives a request for valuation identifying the home to be valued.
- step 207 the facility applies the trees constructed in step 203 , weighted by the scores generated for them in step 204 , to the attributes in the home identified in the received request in order to obtain a valuation for the home identified in the request.
- step 207 the facility continues in step 206 to receive the next request.
- FIG. 4A is a flow diagram showing steps typically performed by the facility in order to construct a tree.
- the facility randomly selects a fraction of the recent sales in the geographic area to which the tree corresponds, as well as a fraction of the available attributes, as a basis for the tree.
- FIG. 5 is a table diagram showing sample contents of a basis table containing the basis information selected for the tree.
- Basis table 500 contains rows randomly selected from the recent sales table 300 , here rows 302 , 308 , 209 , 311 , 313 , and 315 .
- the basis table further includes the identifier column 321 , address column 322 , and selling price column 329 from the recent sales table, as well as randomly selected columns for two available attributes: a bedrooms column 324 and a view column 327 .
- the facility selects various fractions of the rows and attribute columns of the recent sales table for inclusion in the basis table; here, the fraction one third is used for both.
- the facility filters rows from the basis table having selling prices that reflect particularly rapid appreciation or depreciation of the home relative to its immediately-preceding selling price. For example, in some embodiments, the facility filters from the basis table recent sales whose selling prices represent more than 50% annual appreciation or more than 50% annual depreciation. In other embodiments, however, the facility initially performs the filtering described above, then uses the filtered basis table to construct a preliminary model, applies the preliminary model to the unfiltered basis table, and excludes from the basis table used to construct the primary model those sales where the valuation produced by the preliminary model is either more than 2 times the actual selling price or less than one-half of the actual selling price.
- step 402 the facility creates a root node for the tree that represents all of the basis sales contained in the basis table and the full range of each of the basis attributes.
- FIG. 6 is a tree diagram showing a root node corresponding to the basis table 500 .
- the root node 601 represents the sales having identifiers 2, 8, 9, 11, 13, and 15; values of the bedrooms attribute between 1 ⁇ ; and values of the view attribute of yes and no.
- steps 403 - 407 the facility loops through each node of the tree, including both the root node created in step 402 and any additional nodes added to the tree in step 405 .
- step 404 if it is possible to “split” the node, i.e., create two children of the node each representing a different subrange of an attribute value range represented by the node, then the facility continues in step 405 , else the facility continues in step 406 .
- FIG. 4B is a flow diagram showing steps typically performed by the facility in order to determine whether and how to split a node of a tree.
- step 451 the facility determines whether the node's population—that is, the number of basis sales represented by the node—satisfies a split threshold, such as a split threshold that requires more than three basis sales. If the threshold is not satisfied, then the facility returns to step 404 in step 452 without identifying any split opportunity, such that the facility will not split the node; otherwise, the facility continues in step 453 .
- the facility analyzes the characteristics of the node in order to be able to compare them to characteristics of pairs of possible child nodes that would result from different opportunities for splitting the node.
- the facility determines the mean selling price among the sales represented by the node to obtain a node mean selling price for the node. Applying step 453 to root node 600 shown in FIG. 6 , the facility determines a mean selling price for the node as shown below in Table 1 by determining the mean of all the selling prices shown in basis table 500 .
- step 454 the facility sums the squares of the differences between the node mean selling price determined in step 454 and the selling price of each sale represented by the node to obtain a node overall squared error. This calculation is shown below in table 2 for root node 601 .
- step 455 the facility divides the overall squared error by one fewer than the number of sales represented by the node in order to obtain a node variance. The calculation of step 455 for root node 600 is shown below in table 3.
- the facility analyzes the characteristics of each possible split opportunity that exists in the node; that is, for each attribute range represented by the node, any point at which that range could be divided.
- the facility determines the mean selling price among sales on that side to obtain a split side mean selling price. Table 4 below shows the performance of this calculation for both sides of each of the three possible split opportunities of root node 600 .
- step 458 the facility sums the squares of the differences between the selling price of each sale represented by the node and the split side mean selling price on the same side of the possible split opportunity to obtain a possible split opportunity squared error.
- the result of the calculation of step 458 for root node 600 is shown below in table 5.
- step 459 the facility divides the possible split opportunity squared error by two less than the number of sales represented by the node to obtain a variance for the possible split opportunity.
- the calculation of step 459 is shown below for the three possible split opportunities of root node 600 .
- step 460 if another possible split opportunity remains to be processed, then the facility continues in step 456 to process the next possible split opportunity, else the facility continues in step 461 .
- step 461 the facility selects the possible split opportunity having the lowest variance.
- the facility compares lines 37, 38 and 39 to identify the possible split opportunity 2 as having the lowest variance.
- step 462 if the selected possible split opportunity variance determined in step 461 is less than the node variance determined in step 455 , then the facility continues in step 464 to return, identifying the split opportunity selected in step 461 , else the facility continues in step 463 to return without identifying a split opportunity.
- the facility compares line 38 to line 9, and accordingly determines to split the root node in accordance with split opportunity 2.
- step 405 where the steps shown in FIG. 4B determine that the node should be split, the facility creates a pair of children for the node.
- Each child represents one of the subranges of the split opportunity identified in step 404 and the node's full range of unselected attributes.
- Each child represents all basis sales whose attributes satisfy the attribute ranges represented by the child. Step 405 is discussed in greater detail below in connection with FIG. 7 .
- step 406 because the node will be a leaf node, the facility determines the mean selling price of basis sales represented by the node.
- step 407 the facility processes the next node of the tree. After step 407 , these steps conclude.
- FIG. 7 is a tree diagram showing a completed version of the sample tree. It can be seen that the facility added child nodes 702 and 703 to root node 601 , corresponding to the subranges defined by the split opportunity selected in step 461 .
- Node 702 represents sales whose bedrooms attribute is less than or equal to 4, that is, between 1 and 4, as well as the full range of view attribute values represented by node 601 . Accordingly, node 702 represents sales 8 and 11. Because this number of sales is below the threshold of 4, node 702 qualifies as a leaf node, and its valuation of $152,450 is calculated by determining the mean selling price of sales 8 and 11.
- Node 703 represents sales with bedrooms attribute values greater than 4, that is, 5 ⁇ .
- split opportunity 4 has the smaller variance, shown on line 61. It can further be seen that the variance of possible split opportunity 4 shown on line 61 is smaller than the node variance shown on line 46. Accordingly, the facility uses possible split opportunity 4 to split node 703 , creating child nodes 704 and 705 .
- Node 704 has a valuation of $206,000, obtained by averaging the selling prices of the base of sales 2 and 13.
- Node 705 has valuation $245,750, obtained by averaging the selling price of sales 9 and 15.
- the facility retrieves that home's attributes.
- the facility begins at root node 601 , and among edges 711 and 712 , traverses the one whose condition is satisfied by the attributes of the home.
- the facility traverses edge 712 to node 703 .
- the facility determines, among edges 713 and 714 , which edge's condition is satisfied. Because the home's value of the view attribute is yes, the facility traverses edge 714 to leaf node 705 , and obtains a valuation for the sample home of $245,750.
- the tree shown in FIG. 7 may not be representative in all respects of trees constructed by the facility.
- such trees may have a larger number of nodes, and/or a larger depth.
- a single attribute may be split multiple times, i.e., in multiple levels of the tree.
- FIG. 8 shows steps typically performed by the facility in order to score a tree.
- the facility identifies recent sales in the geographic area that were not used as a basis for constructing the tree in order to score the tree.
- steps 802 - 805 the facility loops through each sale identified in step 801 .
- the facility applies the tree to the attributes of the sale to obtain a value.
- the facility compares the value obtained in step 803 to the selling price for the sale to determine an error magnitude, dividing the difference between valuation and selling price by selling price.
- the facility calculates a score that is inversely related to the median error magnitude determined in step 804 . After step 806 , these steps conclude.
- FIG. 9 is a table diagram showing sample results for scoring a tree.
- Scoring table 900 scores tree 700 based upon the contents of recent sales table 300 .
- the scoring table is made up of the rows of recent sales table 300 other than those used as basis sales for constructing the tree, i.e., rows 301 , 303 , 304 , 305 , 306 , 307 , 310 , 312 , and 314 . It further contains the following columns from recent sales table 300 : identifier column 321 , address column 322 , bedroom column 324 , view column 327 , and selling price column 329 .
- the scoring table further contains a valuation column 911 containing the valuation of each home determined in step 803 .
- row 307 shows that the facility determines the valuation of $245,750 for sale 7 using tree 700 .
- Scoring table 900 further contains an error column 912 indicating the difference between each home's valuation and selling price.
- row 307 contains an error of 0.0685, the difference between valuation $245,750 and selling price $230,000, divided by selling price $230,000.
- a median error field 951 containing the median of error values in the scoring table, or 0.3734.
- Each tree's median error value is used to determine weightings for the trees that are inversely related to their median error values.
- the facility determines the particular tree's weighting by generating an accuracy metric for each tree by subtracting its median error value from 1, and dividing the tree's accuracy measure by the sum of all of the trees' accuracy measures. Also, a variety of different approaches to determine a score that is negatively correlated with the average error may be used by the facility.
- the sample tree When a home is valued using the forest, the sample tree will be applied to the attributes of the home in the same way it was applied to homes in the scoring process described above. (If any attributes of the home are missing, the facility typically imputes a value for the missing attribute based upon the median or mode for that attribute in the recent sales table.)
- the valuation produced will be averaged with the valuations produced by the other trees of the forest. In the average, each valuation will be weighted by the score attributed by the facility to the tree. This resultant average is presented as the valuation for the home.
- FIGS. 10-11 show ways in which valuations generated by the facility may be presented.
- FIG. 10 is a display diagram showing detailed information about an individual home.
- the display 1000 includes detailed information 1001 about the home.
- the facility also displays a valuation 1002 for the home, enabling prospective buyers and listing agents to gauge their interest in the home, or permitting the home's owner to gauge his interest in listing the home for sale.
- FIG. 11 is a display diagram showing a map identifying a number of homes in the same geographic area.
- the display 1100 shows homes 1101 - 1112 .
- the facility also displays its valuations 1151 - 1162 of these homes in connection with their location on the map. Presenting the facility's valuations in this way permits home shoppers to obtain an overview of the geographic area, identify special trends within the geographic area, identify the anomalous values as good values or poor picks, etc.
- the valuations displayed or otherwise reported by the facility are not the “raw” valuations directly produced by the valuation model, but rather “smoothed” valuations that are generated by blending the raw valuation generated by the current iteration of the model with earlier valuations.
- the facility generates a current smoothed valuation for a home by calculating a weighted average of a current raw valuation and a smoothed valuation of the same home from the immediately-preceding time period, where the prior smooth valuation is weighted more heavily than the current raw valuation.
- the prior smoothed valuation is weighted 49 times as heavily as the current raw valuation; where a new iteration of the model is constructed and applied weekly, the prior smoothed valuation is weighted 9 times as heavily as the current raw valuation; where new iterations of the model are constructed and applied monthly, the previous smoothed valuation is weighted twice as heavily as the current raw valuation.
- smoothing techniques may be used in order to dampen erotic movement in a particular home's reported valuation over time.
- the facility constructs and applies compound valuation models to one or more geographic areas.
- a compound valuation model includes two or more separate classification tree forests, some or all of which may be applied to the attributes of a particular home in order to value it.
- the facility constructs a compound model including both a forest constructed as described above (referred to as a “core forest”), as well as a separate, “high-end” forest constructed from basis sales having a selling price above the 97.5 percentile selling price in the geographic area.
- the compound model is applied as follows. First, the core forest is applied to the attributes of a home.
- the facility also applies the high-end forest to the attributes of the home. If the valuation produced by the core forest is above the 99 percentile selling price, then the valuation produced by the high-end forest is used directly as the model's valuation. Otherwise, a weighted average of the valuations produced by the core forest and the high-end forest is used, where the weight of the core forest valuation is based upon nearness of the core model valuation to the 97.5 percentile selling price, while the weight of the high-end forest valuation is based on the nearness of the core forest valuation to the 99 percentile selling price.
- the facility typically initiates the tailoring of a valuation for a subject home to input from the subject home's user in response to expression of interest by the user in performing such tailoring.
- the facility enables the user to express such interest in a variety of ways.
- the user may select link 1011 from the display of detailed information about a particular home shown in FIG. 10 .
- FIGS. 12 and 13 show additional ways that the facility permits the user to express such interest in some embodiments.
- FIG. 12 is a display diagram showing a display typically presented by the facility containing the attributes of a particular home, also called “home facts.”
- the display 1200 includes a list 1201 of attributes and their values, as well as a link 1202 to display a more extensive list.
- the display further includes a way 1210 that the user may traverse in order to express interest in tailoring the valuation of the home.
- FIG. 13 is a display diagram showing a display typically presented by the facility to identify possible comparable sales on a map.
- the display 1300 includes such a map 1301 and well as a link 1310 that the user can follow in order to express interest in tailoring evaluation of this home.
- FIG. 14 is a flow diagram showing steps typically performed by the facility in order to tailor a valuation of a subject home based on information provided by the home's user.
- the interactions described herein are typically performed by serving web pages to a user who is the user of the subject home, and receiving input from that user based upon the user's interaction with the web pages. These web pages may be part of a web site relating to aspects of residential or other real estate.
- FIGS. 15-19 discussed in greater detail below, contain sample displays presented by the facility in some embodiments in performing the steps of FIG. 14 .
- step 1401 the facility displays an initial valuation of the subject home.
- step 1402 the facility solicits updated home attributes from the user.
- FIG. 15 is a display diagram showing a sample display typically presented by the facility to display an initial valuation of the subject home and solicit updated home attributes from the user.
- the display 1500 includes a navigation area 1510 which includes a progress indicator made up of step indicators 1511 - 1515 .
- the display of step indicator 1511 for the first step more prominently than the other step indicators indicates that the first step is presently being performed.
- the display further includes an initial valuation 1520 in the amount of $550,727.
- home valuations are identified as “Zestimates.”
- the display also includes a number of controls 1531 - 1541 , each corresponding to a different attribute or “home fact” of the subject home.
- attribute controls are only displayed for attributes whose value has a non-zero influence on the valuations provided by the valuation model for the geographic area containing the home, or a level of influence that exceeds a threshold larger than zero.
- these attribute controls are populated with attribute values automatically retrieved from a data source and used to determine the subject home's initial valuation in the manner described above.
- the user can interact with any of these controls to change the corresponding attribute value. For example, the user may interact with control 1532 to correct the number of bedrooms from 3 to 4, or may interact with control 1537 to update the indicated territorial view to a water view that was created when a nearby building was demolished.
- the facility updates an indication 1550 of the extent to which the user's updates have altered the valuation of the home. In some embodiments, the facility determines this amount by determining a new valuation for the home by applying the existing geographically-specific valuation model for the home—in other words, the existing forest of decision trees for the home—to the updated attributes, and subtracting the original valuation from the result. For example, where the user uses control 1537 to change the value of the view attribute from territorial to none, the facility retraverses all of the trees of the forest constituting the model for the geographic region containing the home. In particular, when the facility traverses sample tree 700 shown in FIG.
- the facility traverses from node 703 to node 704 based upon the new negative value of the view attribute.
- the weighted average of the valuations for all the trees of the forest include a valuation of $206,000 from tree 700 , obtained from leaf node 704 , rather than valuation of $245,750 obtained from node 705 .
- the facility further includes in the display a warning that, because an updated attribute value provided by the user is not represented among the basis sales used to construct the valuation model, updated valuations based upon this updated attribute value may be inaccurate.
- a next control 1591 to move to the next step of the process, describing home improvements.
- step 1403 the facility displays a refined valuation that takes into account the attributes updated by the user.
- step 1404 the facility solicits information from the user about improvements to the subject home.
- FIG. 16 is a display diagram showing a typical display presented by the facility to permit the user to describe improvements made to the subject home.
- the display 1600 includes a highlighted step indication 1612 that indicates that the user is performing the second step of the process.
- Indication 1680 reflects the addition of $1500 to the initial valuation based upon the attribute updates performed by the user in the first step of the process.
- the display includes an area 1830 that the user can use to describe improvements to the subject home. These include an improvement type control 1631 , an improvement timing control 1632 , and an improvement cost control 1633 .
- the facility typically uses the improvement type and the geographical region containing the subject home to access a table containing average recovery rates for different improvement types and regions.
- the facility applies the looked-up recovery rate to the improvement cost amount to obtain an estimated present value.
- the facility further applies a depreciation schedule to the estimated present value, such as one specifying smooth depreciation from one hundred percent to twenty-five percent over the period between zero and ten years after the improvement, and a flat twenty-five percent thereafter.
- the values of various improvements are incorporated directly in the valuation model—i.e., are represented in the trees of the forest—therefore may be handled in the application of the valuation model to the home, rather than computed separately.
- the facility further monitors for the entry of home improvement in display 1600 that are redundant with attribute updates in FIG.
- the facility then displays an indication 1634 of an estimated present value of the improvement.
- the user may select an edit link 1635 to override this estimate of present value.
- the display further includes a link 1639 that the user may follow to extend the improvement description area for describing another improvement.
- the display further includes an indication 1640 of the total present value of the described improvements.
- the display further includes a description 1650 of different improvement types made available by the facility. The user can click the next control 1691 to proceed to the next step of the process, describing other aspects of the home that affect its value.
- step 1405 the facility displays a refined valuation that takes into account the improvements described by the user.
- step 1406 the facility solicits information from the user about other factors affecting the value of the subject home.
- FIG. 17 is a display diagram showing a sample display typically presented by the facility to enable the user to describe other aspects of the subject home that affect its value. It can be seen that indication 1780 of the refined value reflects the addition of $3300 for improvements listed in the previous step.
- the display includes a feature description area 1730 for inputting information about additional aspects. This area includes a description control 1731 for entering a description of the aspect, the control 1732 for indicating whether the aspect adds to or subtracts from the value of the home, and a control 1733 for indicating the magnitude of the impact of the aspect on the value of the home.
- the display further includes a link 1739 that the user may traverse to expand the aspect description area to describe another aspect.
- the display further includes an indication 1740 of the total amount added to or subtracted from the subject home's value by the described aspects. The user may select next control 1791 to proceed to the next step of the process, identifying comps regarded by the user as similar to the subject home.
- step 1407 the facility displays a refined valuation that takes into account the other factors described by the user.
- step 1408 the facility solicits from the user a list of nearby homes that have recently sold (“comps”) that are the most similar to the subject home.
- FIG. 18 is a display diagram showing a sample display presented by the facility in order to enable the user to identify comps regarded by the user as similar to the subject home. It can be seen that the indication 1880 of refined value has been decreased by $300 to reflect a net reduction in the value corresponding to the sum of the inputted values for the aspects described in the previous step of the process.
- the display includes a map 1830 on which possible comps are displayed as numbers appearing in circles. For example, a possible comp 1831 appears as a circle with the number one in it. When the user hovers over and/or clicks on one of these possible comps, the facility displays a pop-up balloon including information about the possible comp. Additional information about the possible comps is also shown below in table 1840 .
- the user can traverse link 1833 in the pop-up balloon or link 1834 in the table in order to add the first possible comp to a “My Comps” list 1835 .
- the user populates the My Comps list in this manner, until it contains what he or she regards as up to ten comps most similar to the subject home.
- the facility determines an updated valuation for the subject home based upon the population of the My Comps list.
- the facility makes a copy of the recent sales table 300 for the geographic region that contains the subject home and was used to construct the forest for this geographic area.
- the facility alters the copy of the recent sales table to increase a weighting in the copy of the recent sales table of the comps in the My Comps list, causing them to be significantly more likely to be selected from the copy of the recent sales table for inclusion in tree basis tables.
- the facility achieves this weighting by adding copies of the rows for each comp in the My Comps list to the recent sales table. In some embodiments, the facility also increases to a lesser extent the weighting in a copy of the recent sales table of the sales of homes that are near the subject home, such as having the same zip code, having the same neighborhood name, or having a calculated distance from the subject home that is below a particular distance threshold. The facility then uses this altered copy of the recent sales table to generate a new forest for the geographic region. The facility applies this forest, which is tailored to the comps included in the My Comps list, to the attributes of the home as updated in the first step of the process.
- the result of applying the tailored forest is adjusted by averaging it with a separate valuation determined by multiplying the floor area of the subject home by an average selling price per square foot value among the sales on the My Comps list.
- the facility determines the valuation by averaging the average selling price per square foot valuation with the original model valuation rather than the updated model valuation if the initial model valuation is between the adjusted model valuation and the average price per square foot valuation. The facility then subtracts from the resulting valuation the change in value from step one—$1500 in the example—because this amount is represented in the new valuation. To arrive at an overall valuation, the facility adds to the result the additional amounts identified in the second and third steps of the process, in the example $3300 and negative $300.
- the facility permits the user to populate the My Comps list with any similar nearby home, irrespective of whether it has recently been sold.
- the facility then emphasize the valuations of these homes, such as valuations automatically determined by the facility, in determining a refined valuation for the subject home.
- FIGS. 19A-19F show a sample display typically presented by the facility in order to present an overall revised value for the subject home.
- FIG. 19A shows the entire display
- FIGS. 19B-19F show portions of the display at a greater level of magnification.
- the display includes an overall summary section 1930 containing an overview of the calculation of the new revised value, as well as detailed sections 1940 , 1950 , 1960 , and 1970 , each displaying additional detail about the value added or subtracted by each of the four steps of the process.
- FIG. 19B shows that section 1930 contains a breakdown beginning with the initial valuation 1920 , and adding value increments 1931 - 1934 for each of the four steps of the process to arrive at the new revised value 1980 .
- FIG. 19A shows the entire display
- FIGS. 19B-19F show portions of the display at a greater level of magnification.
- the display includes an overall summary section 1930 containing an overview of the calculation of the new revised value, as well as detailed sections 1940 , 1950 , 1960 , and 1970 , each
- FIG. 19C shows that the increment 1931 for the updated attributes is the result of increasing the number of bedrooms from 3-4 ( 1941 ) and changing the view from none to water ( 1942 ).
- FIG. 19D shows that the value increment for home improvements 1931 is the result of adding a value of $300 for a new roof ( 1951 ) and $3000 for a kitchen remodel ( 1952 ).
- FIG. 19E shows that the increment for other aspects affecting the value of the subject home is arrived at by adding $700 for an orchard ( 1961 ) and subtracting $1000 because a new fence is needed ( 1962 ).
- FIG. 19F shows that the user's selection of comps has established an increment of $2650 ( 1935 ).
- Section 1970 further includes a map 1971 showing the comps selected by the user, as well as a table 1972 showing the same in a different form.
- the behavior of the facility described above is adapted in various ways.
- the facility uses a smoothed version of the valuation produced by the valuation model, rather than a raw version.
- a smoothed version of this valuation may be obtained by blending the raw valuation produced using a current iteration of the model with one or more valuations produced using earlier iterations of the model.
- such blending involves calculating a weighted average of the current raw valuation and the immediately-preceding smoothed valuation in which the smoothed valuation is weighted more heavily. For example, where the valuation model is updated daily, in some embodiments, the facility weights the preceding smoothed valuation 49 times more heavily than the current raw valuation.
- the facility displays a warning message indicating that the valuation has changed significantly, and may not be accurate.
- the facility generates a tailored valuation using a valuation model that is constrained to use a proper subset of available home attributes, such as only the attributes whose values are available for the user to update in the first step of the process of generating the tailored valuation.
- this involves using a separate decision tree forest valuation model that is constructed using only the subset of attributes.
- a valuation model of another type that is constructed using only the subset of attributes, such as a linear regression model constructed by plotting each of the base of sales as a point in N+1-space, where N is the number of continuous attributes in the subset plus the sum of the unique values of categorical attributes in the subset minus the number of categorical attributes in the subset, N of the
- FIG. 20 is a table diagram showing sample contents of recent sales information used to construct a linear regression valuation model that is based on the attributes whose values are available for the user to update in the first step of the process of generating a tailored valuation.
- the table 2000 includes the following columns for each sale: a sale id column 2021 containing an identifier for the sale; a square foot column 2022 containing the improved floor area of the home; a lot size column 2023 containing the area of the home's lot, in square feet; a bedrooms column 2024 containing the number of bedrooms in the home; a bathrooms column 2025 containing the number of bathrooms in the home; a floors column 2026 containing the number of stories in the home; a year column 2027 showing the year in which the house was constructed; a selling price column 2028 containing the selling price at which the home was sold; a roof type column 2029 indicating the type of material from which the home's roof is constructed; and a use code column 2030 containing an indication of the primary use of the home.
- Table 8 lists variables derived from these sale attribute values that are used as independent variables to construct a linear regression model.
- the facility For each of a group of recent sales, the facility creates a tuple made up of the values of the variables showing lines 63 - 78 in Table 8 based upon the sale's attribute values, as well as the selling price for the sale.
- the facility submits the generated tuples to a linear regression engine, which fits a curve to the points represented by the tuples, resulting in a set of coefficients representing a linear valuation formula.
- the facility performs the curve-fitting by invoking a lm( ) function described at http://cran.r-project.org/.doc/manuals/R-intro.html#Linear-models, and available as part of the R statistical computing environment, available at http://www.r-project.org/.
- This formula can then be used as a valuation model to determine a valuation for an arbitrary home, given a tuple corresponding to the home's attribute values.
- the facility when the facility considers the recent sales data shown in FIG. 20 , it constructs a valuation formula shown as the sum of the lines of Table 9 below.
- the facility filters out the recent sales data used by the facility to generate a valuation formula sales whose attributes have extreme values, such as an age greater than 300 years.
- the facility tailors the valuation formula created by the process described above to a particular home using one or more of the following techniques: more heavily weighting sales having a high selling price in valuation formulas constructed for valuing a home whose primary valuation is near the average selling price of these high-end homes; more heavily weighting recent sales that are geographically near the home to be valued, such as in the same zip code; and, where the user has selected particular recent sales as My Comps, more heavily weighting these sales in constructing the valuation formula.
- data missing from the recent sales data used to construct the valuation function is imputed in a manner similar to that described above.
- the facility employs a model of a type other than the primary, decision-tree forest model, but does not use it to directly generate valuations of the subject home. Rather, it is used to generate valuations of the subject home before and after the user updates attributes of the subject home, and the percentage change in the valuation produced by the other model is applied to a valuation produced for the subject home using the original attribute values by the primary, decision-tree forest model.
- the facility may construct separate copies of the other model before and after the performance of the fourth, My Comps step of the process use each of the copies to value the subject home, determine the percentage change between these valuations, and apply it to a valuation produced for the subject home by the primary model before the fourth step of the process is performed.
- the above-described facility may be straightforwardly adapted or extended in various ways.
- the facility may use a variety of user interfaces to collect various information usable in determining valuations from users and other people knowledgeable about homes. While the foregoing description makes reference to particular embodiments, the scope of the invention is defined solely by the claims that follow and the elements recited therein.
Abstract
Description
| TABLE 1 | ||
| 1 | Node mean selling price = | $201,400 |
| TABLE 2 | ||
| 2 | | 160000 |
| ($201,000 − line 1)2 = | ||
| 3 | | 16002250000 |
| ($74,900 − line 1)2 = | ||
| 4 | | 2714410000 |
| ($253,500 − line 1)2 = | ||
| 5 | | 817960000 |
| ($230,000 − line 1)2 = | ||
| 6 | | 92160000 |
| ($211,000 − line 1)2 = | ||
| 7 | | 1339560000 |
| ($238,000 − line 1)2 = | ||
| 8 | Node overall squared error = | 20966500000 |
In
| TABLE 3 | ||
| 9 | Node variance = |
4193300000 |
| TABLE 4 | ||
| 10 | Split side mean selling price of view = no side of | $179,225 |
| |
||
| |
||
| 11 | Split side mean selling price of view = yes side of | $245,750 |
| |
||
| |
||
| 12 | Split side mean selling price for bedrooms ≦4 side of | $152,450 |
| |
||
| |
||
| 13 | Split side mean selling price for bedrooms >4 side of | $225,875 |
| |
||
| |
||
| 14 | Split side mean selling price for bedrooms ≦5 side of | $188,475 |
| |
||
| |
||
| 15 | Split side mean selling price for bedrooms >5 side of | $227,250 |
| |
||
| |
||
| TABLE 5 | ||
| 16 | Possible split opportunity 1 squared error for | 474150625 |
| sale 2 = ($201,000 − line 10)2 = | ||
| 17 | Possible split opportunity 1 squared error for | 10883705625 |
| sale 8 = ($74,900 − line 10)2 = | ||
| 18 | Possible split opportunity 1 squared error for | 60062500 |
| sale 9 = ($253,500 − line 11)2 = | ||
| 19 | Possible split opportunity 1 squared error for | 2578100625 |
| sale 11 = ($230,000 − line 10)2 = | ||
| 20 | Possible split opportunity 1 squared error for | 1009650625 |
| sale 13 = ($211,000 − line 10)2 = | ||
| 21 | Possible split opportunity 1 squared error for | 60062500 |
| sale 15 = ($238,000 − line 11)2 = | ||
| 22 | Possible split opportunity 1 squared error = | 15065732500 |
| sum of lines 16-21 = | ||
| 23 | Possible split opportunity 2 squared error for | 618765625 |
| sale 2 = ($201,000 − line 13)2 = | ||
| 24 | Possible split opportunity 2 squared error for | 6014002500 |
| sale 8 = ($74,900 − line 12)2 = | ||
| 25 | Possible split opportunity 2 squared error for | 763140625 |
| sale 9 = ($253,500 − line 13)2 = | ||
| 26 | Possible split opportunity 2 squared error for | 6014002500 |
| sale 11 = ($230,000 − line 12)2 = | ||
| 27 | Possible split opportunity 2 squared error for | 221265625 |
| sale 13 = ($211,000 − line 13)2 = | ||
| 28 | Possible split opportunity 2 squared error for | 147015625 |
| sale 15 = ($238,000 − line 13)2 = | ||
| 29 | Possible split opportunity 2 squared error = | 13778192500 |
| sum of lines 23-28 = | ||
| 30 | Possible split opportunity 3 squared error for | 689062500 |
| sale 2 = ($201,000 − line 15)2 = | ||
| 31 | Possible split opportunity 3 squared error for | 12899280625 |
| sale 8 = ($74,900 − line 14)2 = | ||
| 32 | Possible split opportunity 3 squared error for | 689062500 |
| sale 9 = ($253,500 − line 15)2 = | ||
| 33 | Possible split opportunity 3 squared error for | 1724325625 |
| sale 11 = ($230,000 − line 14)2 = | ||
| 34 | Possible split opportunity 3 squared error for | 507375625 |
| sale 13 = ($211,000 − line 14)2 = | ||
| 35 | Possible split opportunity 3 squared error for | 2452725625 |
| sale 15 = ($238,000 − line 14)2 = | ||
| 36 | Possible split opportunity 3 squared error = | 18961832500 |
| sum of lines 30-35 = | ||
| TABLE 6 | ||
| 37 | Variance for |
3766433125 |
| 22/4 = | ||
| 38 | Variance for |
3444548125 |
| 29/4 = | ||
| 39 | Variance for |
4740458125 |
| 36/4 = | ||
| TABLE 7 | |||
| 40 | node mean selling price = mean of selling | $225,875 | |
| prices for sales 2, 9, 13, and 15 = | |||
| 41 | sale 2 overall squared error = | 618765625 | |
| ($201,000 − line 40)2 = | |||
| 42 | sale 9 overall squared error = | 76314625 | |
| ($253,500 − line 40)2 = | |||
| 43 | sale 13 overall squared error = | 221265625 | |
| ($211,000 − line 40)2= | |||
| 44 | sale 15 overall squared error = | 147015625 | |
| ($238,000 − line 40)2= | |||
| 45 | node overall squared error = | 1750187500 | |
| 46 | node variance = line 45/3 = | 583395833 | |
| 47 | split side mean selling price of view = no side | $206,000 | |
| of possible split opportunity 4 = mean selling | |||
| prices of sales 2 and 13 = | |||
| 48 | split side mean selling price of view = yes side | $245,750 | |
| of possible split opportunity 4 = mean selling | |||
| prices of sales 9 and 15 = | |||
| 49 | split side mean selling price for bedrooms ≦5 | $224,500 | |
| side of possible split opportunity 5 = mean | |||
| selling prices of sales 13 and 15 = | |||
| 50 | split side mean selling price of bedrooms >5 side | $227,250 | |
| of possible split opportunity 5 = mean selling | |||
| prices of sales 2 and 9 = | |||
| 51 | possible split opportunity 4 squared error for | 25000000 | |
| sale 2 = ($201,000 − line 47)2 = | |||
| 52 | possible split opportunity 4 squared error for | 60062500 | |
| sale 9 = ($253,500 − line 48)2 = | |||
| 53 | possible split opportunity 4 squared error for | 25000000 | |
| sale 13 = ($211,000 − line 47)2 = | |||
| 54 | possible split opportunity 4 squared error for | 60062500 | |
| sale 15 = ($238,000 − line 48)2 = | |||
| 55 | possible split opportunity 4 squared error = | 17012500 | |
| sum of lines 51-54 = | |||
| 56 | possible split opportunity 5 squared error for | 689062500 | |
| sale 2 = ($201,000 − line 50)2 = | |||
| 57 | possible split opportunity 5 squared error for | 689062500 | |
| sale 9 = ($253,500 − line 50)2 = | |||
| 58 | possible split opportunity 5 squared error for | 182250000 | |
| sale 13 = ($211,000 − line 49)2 = | |||
| 59 | possible split opportunity 5 squared error for | 182250000 | |
| sale 15 = ($238,000 − line 49)2 = | |||
| 60 | possible split opportunity 5 squared error = | 1742625000 | |
| sum of lines 56-59 = | |||
| 61 | variance for possible split opportunity 4 = | 85062500 | |
| line 55/2 = | |||
| 62 | variance for possible split opportunity 5 = | 871312500 | |
| line 60/2 = | |||
| TABLE 8 | |
| 63 | SQUAREFEETPERBEDROOM = |
| 64 | BUILTDATEDIFFERENCEYEARS = current year − |
| 65 | BATHROOMCNT = |
| 66 | BEDROOMCNT = |
| 67 | FINISHEDSQUAREFEET = |
| 68 | LOTSIZESQUAREFEET = |
| 69 | STORYCNT = |
| 70 | USECODETYPEIDSTANDARD = encoded version of |
| 71 | ROOFTYPEID = encoded version of |
| 72 | BEDSQFT = line 66 * line 67 |
| 73 | BEDLOT = line 66 * line 68 |
| 74 | SQFTLOT = line 67 * line 68 |
| 75 | BED2 = (line 66)2 |
| 76 | LOT2 = (line 68)2 |
| 77 | YEAR2 = (line 64)2 |
| 78 | SQFT2 = (line 67)2 |
| TABLE 9 | |||||
| 79 | $219,000 | ||||
| 80 | −$16 | * | FINISHEDSQUAREFEET | ||
| 81 | −$171 | * | LOTSIZESQUAREFEET | ||
| 82 | $0 | * | SQFT2 | ||
| 83 | $0 | * | LOT2 | ||
| 84 | $0 | * | SQFTLOT | ||
| 85 | $2 | * | YEAR2 | ||
| 86 | $1,933 | * | BUILTDATEDIFFERENCEYEAR | ||
| 87 | $4,940 | * | STORYCNT | ||
| 88 | $26,100 | * | BATHROOMCNT | ||
| 89 | $35,110 | * | BED2 | ||
| 90 | −$337 | * | BEDSQFT | ||
| 91 | $55 | * | BEDLOT | ||
| 92 | $62,980 | * | BEDROOMCNT | ||
| 93 | $15,390 | if | (ROOFTYPE = tile) | ||
| 94 | $87,640 | if | (ROOFTYPE = shake) | ||
Claims (40)
Priority Applications (7)
| Application Number | Priority Date | Filing Date | Title |
|---|---|---|---|
| US11/347,024 US7970674B2 (en) | 2006-02-03 | 2006-02-03 | Automatically determining a current value for a real estate property, such as a home, that is tailored to input from a human user, such as its owner |
| US11/524,048 US8515839B2 (en) | 2006-02-03 | 2006-09-19 | Automatically determining a current value for a real estate property, such as a home, that is tailored to input from a human user, such as its owner |
| GB0701944A GB2436159A (en) | 2006-02-03 | 2007-02-01 | Valuing real estate with owner input |
| US13/943,604 US20130304654A1 (en) | 2006-02-03 | 2013-07-16 | Automatically determining a current value for a real estate property, such as a home, that is tailored to input from a human user, such as its owner |
| US14/191,388 US20140180936A1 (en) | 2006-02-03 | 2014-02-26 | Automatically determining a current value for a real estate property, such as a home, that is tailored to input from a human user, such as its owner |
| US14/318,536 US20140316999A1 (en) | 2006-02-03 | 2014-06-27 | Automatically determining a current value for a real estate property, such as a home, that is tailored to input from a human user, such as its owner. |
| US14/846,632 US10896449B2 (en) | 2006-02-03 | 2015-09-04 | Automatically determining a current value for a real estate property, such as a home, that is tailored to input from a human user, such as its owner |
Applications Claiming Priority (1)
| Application Number | Priority Date | Filing Date | Title |
|---|---|---|---|
| US11/347,024 US7970674B2 (en) | 2006-02-03 | 2006-02-03 | Automatically determining a current value for a real estate property, such as a home, that is tailored to input from a human user, such as its owner |
Related Child Applications (1)
| Application Number | Title | Priority Date | Filing Date |
|---|---|---|---|
| US11/524,048 Continuation-In-Part US8515839B2 (en) | 2006-02-03 | 2006-09-19 | Automatically determining a current value for a real estate property, such as a home, that is tailored to input from a human user, such as its owner |
Publications (2)
| Publication Number | Publication Date |
|---|---|
| US20070198278A1 US20070198278A1 (en) | 2007-08-23 |
| US7970674B2 true US7970674B2 (en) | 2011-06-28 |
Family
ID=38429425
Family Applications (1)
| Application Number | Title | Priority Date | Filing Date |
|---|---|---|---|
| US11/347,024 Active 2029-11-28 US7970674B2 (en) | 2006-02-03 | 2006-02-03 | Automatically determining a current value for a real estate property, such as a home, that is tailored to input from a human user, such as its owner |
Country Status (1)
| Country | Link |
|---|---|
| US (1) | US7970674B2 (en) |
Cited By (36)
| Publication number | Priority date | Publication date | Assignee | Title |
|---|---|---|---|---|
| US20130080340A1 (en) * | 2011-09-23 | 2013-03-28 | Elif Onmus-Baykal | Indexing and adjusting for property condition in an automated valuation model |
| US20130101234A1 (en) * | 2011-10-24 | 2013-04-25 | Fannni Mae | Automated valuation model with customizable neighborhood determination |
| US20130144796A1 (en) * | 2011-12-06 | 2013-06-06 | Fannie Mae | Assigning confidence values to automated property valuations by using the non-typical property characteristics of the properties |
| US20150379588A1 (en) * | 2006-02-03 | 2015-12-31 | Zillow, Inc. | Automatically determining a current value for a real estate property, such as a home, that is tailored to input from a human user, such as its owner |
| WO2016069765A1 (en) * | 2014-10-28 | 2016-05-06 | WWTemplar LLC | Component-based building assessment |
| US9536148B2 (en) | 2013-09-27 | 2017-01-03 | Real Data Guru, Inc. | Property assessment and prospecting tool |
| US9697566B2 (en) | 2013-03-15 | 2017-07-04 | Ten-X, Llc | System and mehtod for providing information about assets during a live auction |
| US20180025452A1 (en) * | 2016-07-21 | 2018-01-25 | Realtex Value LLC | Computerized systems and methods for optimizing building construction |
| US9881335B2 (en) | 2013-03-15 | 2018-01-30 | Ten-X, Llc | System and method for selecting personalities to facilitate the completion of an online auction |
| US9934490B2 (en) | 2015-12-29 | 2018-04-03 | Setschedule Ip Holdings, Llc | System and method for transacting lead and scheduled appointment records |
| US9947041B2 (en) | 2012-12-17 | 2018-04-17 | Ten-X, Llc | Dynamically determining bid increments for online auctions |
| US20180232784A1 (en) * | 2014-08-26 | 2018-08-16 | Municipal Property Assessment Corporation | Method and system for real estate valuation |
| US10074111B2 (en) | 2006-02-03 | 2018-09-11 | Zillow, Inc. | Automatically determining a current value for a home |
| US10192275B2 (en) * | 2015-03-30 | 2019-01-29 | Creed Smith | Automated real estate valuation system |
| US10380679B2 (en) * | 2013-03-15 | 2019-08-13 | Auction.Com, Llc | Valuation tool for an online auction of a real property asset |
| US10380653B1 (en) | 2010-09-16 | 2019-08-13 | Trulia, Llc | Valuation system |
| US10417697B2 (en) | 2012-12-17 | 2019-09-17 | Auction.Com, Llc | System and method for structuring an online auction when reserve price is not met |
| US10460406B1 (en) | 2011-03-09 | 2019-10-29 | Zillow, Inc. | Automatically determining market rental rates for properties |
| US10553085B1 (en) | 2019-01-25 | 2020-02-04 | Lghorizon, Llc | Home emergency guidance and advisement system |
| US10643232B1 (en) | 2015-03-18 | 2020-05-05 | Zillow, Inc. | Allocating electronic advertising opportunities |
| US10713596B2 (en) * | 2007-05-15 | 2020-07-14 | Intellireal, Llc | Transforming property data into sufficiently sized, relatively homogeneous data segments for configuring automated modeling systems |
| US10754884B1 (en) | 2013-11-12 | 2020-08-25 | Zillow, Inc. | Flexible real estate search |
| US10789549B1 (en) | 2016-02-25 | 2020-09-29 | Zillow, Inc. | Enforcing, with respect to changes in one or more distinguished independent variable values, monotonicity in the predictions produced by a statistical model |
| US10984489B1 (en) | 2014-02-13 | 2021-04-20 | Zillow, Inc. | Estimating the value of a property in a manner sensitive to nearby value-affecting geographic features |
| US11043095B1 (en) | 2020-06-16 | 2021-06-22 | Lghorizon, Llc | Predictive building emergency guidance and advisement system |
| US11068911B1 (en) | 2011-03-09 | 2021-07-20 | Zillow, Inc. | Automatically determining market rental rate index for properties |
| US11093982B1 (en) | 2014-10-02 | 2021-08-17 | Zillow, Inc. | Determine regional rate of return on home improvements |
| TWI739371B (en) * | 2020-04-07 | 2021-09-11 | 中國信託商業銀行股份有限公司 | Real estate appraisal method and real estate appraisal device |
| US11200513B2 (en) | 2017-10-13 | 2021-12-14 | Carrier Corporation | Real estate image analysis |
| US11315202B2 (en) | 2006-09-19 | 2022-04-26 | Zillow, Inc. | Collecting and representing home attributes |
| US11449958B1 (en) | 2008-01-09 | 2022-09-20 | Zillow, Inc. | Automatically determining a current value for a home |
| WO2022224204A1 (en) * | 2021-04-23 | 2022-10-27 | BricksNData Pty Ltd | System and method for estimating asset value at a point in time |
| US11583770B2 (en) | 2021-03-01 | 2023-02-21 | Lghorizon, Llc | Systems and methods for machine learning-based emergency egress and advisement |
| US11626002B2 (en) | 2021-07-15 | 2023-04-11 | Lghorizon, Llc | Building security and emergency detection and advisement system |
| US11682052B2 (en) | 2019-10-15 | 2023-06-20 | Orchard Technologies, Inc. | Machine learning systems and methods for determining home value |
| US11861748B1 (en) | 2019-06-28 | 2024-01-02 | MFTB Holdco, Inc. | Valuation of homes using geographic regions of varying granularity |
Families Citing this family (19)
| Publication number | Priority date | Publication date | Assignee | Title |
|---|---|---|---|---|
| US7818265B2 (en) * | 2006-11-21 | 2010-10-19 | Damien Gerard Loveland | System and method for facilitating property comparisons |
| US8342928B1 (en) * | 2007-06-01 | 2013-01-01 | Realius, Inc. | Market-based simulation game and system |
| US20100042442A1 (en) * | 2008-08-14 | 2010-02-18 | American International Group, Inc. | Home Value Estimator |
| US10380652B1 (en) | 2008-10-18 | 2019-08-13 | Clearcapital.Com, Inc. | Method and system for providing a home data index model |
| US20100179911A1 (en) * | 2009-01-14 | 2010-07-15 | Dataquick Information Systems, Inc. | Collateral validation system |
| US8335747B1 (en) * | 2009-06-25 | 2012-12-18 | William Andrew Roberts | Client-server real estate valuation system |
| US20110196762A1 (en) * | 2010-02-04 | 2011-08-11 | Dupont David W | Online user directed valuation model (udvm) |
| US20130097201A1 (en) * | 2011-10-14 | 2013-04-18 | Norrine Brydon | Quality level valuation system and method |
| US10672088B2 (en) * | 2012-06-19 | 2020-06-02 | Fannie Mae | Automated valuation model with comparative value history information |
| US20140012720A1 (en) * | 2012-07-03 | 2014-01-09 | William H. O'Kane | Integrated property mortgage and property improvement loan application system and method |
| US10242400B1 (en) | 2013-10-25 | 2019-03-26 | Appliance Computing III, Inc. | User interface for image-based rendering of virtual tours |
| US20160125480A1 (en) * | 2014-10-29 | 2016-05-05 | Christopher Hugh Morrison | Engaging a potential property seller to capture comprehensive property information |
| WO2016136056A1 (en) * | 2015-02-27 | 2016-09-01 | ソニー株式会社 | Information processing device, information processing method, and program |
| US20180158156A1 (en) * | 2016-12-02 | 2018-06-07 | Bank Of America Corporation | Property Assessments Using Augmented Reality User Devices |
| US20180158157A1 (en) * | 2016-12-02 | 2018-06-07 | Bank Of America Corporation | Geo-targeted Property Analysis Using Augmented Reality User Devices |
| US20180159838A1 (en) * | 2016-12-02 | 2018-06-07 | Bank Of America Corporation | Real Estate Property Project Analysis Using Augmented Reality User Devices |
| US11861635B1 (en) * | 2019-03-20 | 2024-01-02 | MFTB Holdco, Inc. | Automatic analysis of regional housing markets based on the appreciation or depreciation of individual homes |
| US20200402116A1 (en) * | 2019-06-19 | 2020-12-24 | Reali Inc. | System, method, computer program product or platform for efficient real estate value estimation and/or optimization |
| US20220043539A1 (en) * | 2020-08-07 | 2022-02-10 | Kpmg Llp | System and method for intelligent review, processing and reporting of financial data |
Citations (18)
| Publication number | Priority date | Publication date | Assignee | Title |
|---|---|---|---|---|
| US5361201A (en) | 1992-10-19 | 1994-11-01 | Hnc, Inc. | Real estate appraisal using predictive modeling |
| US6178406B1 (en) * | 1995-08-25 | 2001-01-23 | General Electric Company | Method for estimating the value of real property |
| US6240425B1 (en) | 1997-12-31 | 2001-05-29 | John Naughton | Geographic search engine having independent selections of direction and distance from a relocatable hub |
| US6609118B1 (en) * | 1999-06-21 | 2003-08-19 | General Electric Company | Methods and systems for automated property valuation |
| US20030212565A1 (en) | 2002-05-08 | 2003-11-13 | Badali Robert C. | Appraisal and home inspection process |
| US20040073508A1 (en) | 2000-11-20 | 2004-04-15 | Paul Foster | Method and system for property valuation in an on-line computing environment |
| US20050108084A1 (en) * | 2003-08-08 | 2005-05-19 | Sridhar Ramamoorti | Methods and systems for valuing a business decision |
| US6915206B2 (en) | 2002-07-05 | 2005-07-05 | Alpine Electronics, Inc. | Map data distribution system and navigation apparatus |
| US20050154657A1 (en) * | 2004-01-12 | 2005-07-14 | Kim Christopher D.Y. | Condition scoring for a property appraisal system |
| US20070124235A1 (en) | 2005-11-29 | 2007-05-31 | Anindya Chakraborty | Method and system for income estimation |
| US20070185727A1 (en) | 2006-02-03 | 2007-08-09 | Ma Brian C | Automatically determining a current value for a real estate property, such as a home, that is tailored to input from a human user, such as its owner |
| US20070185906A1 (en) | 2006-02-03 | 2007-08-09 | Stan Humphries | Automatically determining a current value for a home |
| US7289965B1 (en) * | 2001-08-10 | 2007-10-30 | Freddie Mac | Systems and methods for home value scoring |
| US20080077458A1 (en) | 2006-09-19 | 2008-03-27 | Andersen Timothy J | Collecting and representing home attributes |
| US7461265B2 (en) | 1999-07-02 | 2008-12-02 | Jpmorgan Chase Bank, N.A. | System and method for single sign on process for websites with multiple applications and services |
| US7487114B2 (en) | 2000-10-23 | 2009-02-03 | Costar Group, Inc. | System and method for associating aerial images, map features, and information |
| US20090043637A1 (en) * | 2004-06-01 | 2009-02-12 | Eder Jeffrey Scott | Extended value and risk management system |
| US7567262B1 (en) * | 2005-02-25 | 2009-07-28 | IDV Solutions LLC | Hybrid graphics for interactive reporting |
-
2006
- 2006-02-03 US US11/347,024 patent/US7970674B2/en active Active
Patent Citations (18)
| Publication number | Priority date | Publication date | Assignee | Title |
|---|---|---|---|---|
| US5361201A (en) | 1992-10-19 | 1994-11-01 | Hnc, Inc. | Real estate appraisal using predictive modeling |
| US6178406B1 (en) * | 1995-08-25 | 2001-01-23 | General Electric Company | Method for estimating the value of real property |
| US6240425B1 (en) | 1997-12-31 | 2001-05-29 | John Naughton | Geographic search engine having independent selections of direction and distance from a relocatable hub |
| US6609118B1 (en) * | 1999-06-21 | 2003-08-19 | General Electric Company | Methods and systems for automated property valuation |
| US7461265B2 (en) | 1999-07-02 | 2008-12-02 | Jpmorgan Chase Bank, N.A. | System and method for single sign on process for websites with multiple applications and services |
| US7487114B2 (en) | 2000-10-23 | 2009-02-03 | Costar Group, Inc. | System and method for associating aerial images, map features, and information |
| US20040073508A1 (en) | 2000-11-20 | 2004-04-15 | Paul Foster | Method and system for property valuation in an on-line computing environment |
| US7289965B1 (en) * | 2001-08-10 | 2007-10-30 | Freddie Mac | Systems and methods for home value scoring |
| US20030212565A1 (en) | 2002-05-08 | 2003-11-13 | Badali Robert C. | Appraisal and home inspection process |
| US6915206B2 (en) | 2002-07-05 | 2005-07-05 | Alpine Electronics, Inc. | Map data distribution system and navigation apparatus |
| US20050108084A1 (en) * | 2003-08-08 | 2005-05-19 | Sridhar Ramamoorti | Methods and systems for valuing a business decision |
| US20050154657A1 (en) * | 2004-01-12 | 2005-07-14 | Kim Christopher D.Y. | Condition scoring for a property appraisal system |
| US20090043637A1 (en) * | 2004-06-01 | 2009-02-12 | Eder Jeffrey Scott | Extended value and risk management system |
| US7567262B1 (en) * | 2005-02-25 | 2009-07-28 | IDV Solutions LLC | Hybrid graphics for interactive reporting |
| US20070124235A1 (en) | 2005-11-29 | 2007-05-31 | Anindya Chakraborty | Method and system for income estimation |
| US20070185727A1 (en) | 2006-02-03 | 2007-08-09 | Ma Brian C | Automatically determining a current value for a real estate property, such as a home, that is tailored to input from a human user, such as its owner |
| US20070185906A1 (en) | 2006-02-03 | 2007-08-09 | Stan Humphries | Automatically determining a current value for a home |
| US20080077458A1 (en) | 2006-09-19 | 2008-03-27 | Andersen Timothy J | Collecting and representing home attributes |
Non-Patent Citations (28)
| Title |
|---|
| "An Introduction to R," http://web.archive.org/web/20060118050840/http://cran.r-project.org/doc/manuals/R-intro.html, pp. 1-105 [intemet archive date: Jan. 18, 2006]. |
| "Centre for Mathematical Sciences," Lund University, http://web.archive.org/web/20060101005103/http://www.maths.Ith.se/, 1 page [internet archive date: Jan. 1, 2006]. |
| Bennett, Kristin P., "Support Vector Machines: Hype or Hallelujah?" SIGKDD Explorations, Dec. 2000, pp. 1-12, vol. 2, issue 2, ACM SIGKDD. |
| Breiman et al., "Random Forest," Classification Description, http://www.stat.berkeley.edu/users/breiman/RandomForests/cc-home.htm, pp. 1-28 [accessed Dec. 13, 2005]. |
| Breiman, L., "Random Forests," Machine Learning, 45, pp. 5-32, 2001, Kluwer Academic Publishers, The Netherlands. |
| Final Office Action for U.S. Appl. No. 11/524,048, Mail Date Dec. 8, 2009, 12 pages. |
| Hill, T. and Lewicki, P., "K-Nearest Neighbors," Statistics Methods and Applications, 2007, http://www.statsoft.com/textbook/stknn.html, [internet accessed on [Dec. 6, 2007]. |
| http://www.ics.uci.edu/~mlearn/databases/housing/housing.names, 1 page [accessed Dec. 13, 2005]. |
| http://www.ics.uci.edu/˜mlearn/databases/housing/housing.names, 1 page [accessed Dec. 13, 2005]. |
| Meyer, Robert T., "The Learning of Multiattribute Judgment Policies," The Journal of Consumer Research, vol. 14, No. 2, Sep. 1987, pp. 155-173. |
| Mobasher, B. "Classification Via Decision Trees in WEKA," DePaul University, Computer Science, Telecommunications, and Information Systems, ECT 584-Web Data Mining, 2005, http://maya.cs.depaul.edu/~classes/Ect584/WEKA/classify.html, 5 pages [internet accessed on Dec. 6, 2007]. |
| Mobasher, B. "Classification Via Decision Trees in WEKA," DePaul University, Computer Science, Telecommunications, and Information Systems, ECT 584-Web Data Mining, 2005, http://maya.cs.depaul.edu/˜classes/Ect584/WEKA/classify.html, 5 pages [internet accessed on Dec. 6, 2007]. |
| Non-Final Office Action for U.S. Appl. No. 11/347,000, Mail Date Apr. 9, 2010, 29 pages. |
| Non-Final Office Action for U.S. Appl. No. 11/347,000, Mail Date Oct. 27, 2010, 25 pages. |
| Non-Final Office Action for U.S. Appl. No. 11/524,047, Mail Date Oct. 28, 2009, 12 pages. |
| Non-Final Office Action for U.S. Appl. No. 11/524,048, Mail Date Apr. 29, 2009, 10 pages. |
| Non-Final Office Action for U.S. Appl. No. 11/927,623, Mail Date Dec. 28, 2010, 22 pages. |
| Quinlan, Ross J., "C4.5: Programs for Machine Learning," Machine Learning, 1993, 302 pages, Morgan Kaufmann Publishers, San Francisco, CA, USA. |
| RealEstateABC.com, see paragraph headed "How do I make the estimate more accurate?" www.realestateabc.com/home-values/, Internet Archive Dated: Apr. 5, 2006, 4 pages [accessed Mar. 20, 2007]. |
| Real-info.com, "What is an AVM," www.real-info.com/products-avm.asp? Internet Archive Date: Oct. 30, 2005, 5 pages [accessed Mar. 21, 2007]. |
| Standard & Poors, "Guidelines for the use of Automated Valuation Models for U.K. RMBS Transactions," http://www.rics.org/NR/rdonlyres/8Fcdd20c-7FAC-4549-86FB-3930CD0CBC05/0/StandardandPoorsReportonAVMs.pdf, Published Feb. 20, 2004, 4 pages. |
| StatSoft, Inc., "Classification Trees," http://www.statsoft.com/textbook/stclatre.html, pp. 1-20, © 1984-2003 [accessed Dec. 13, 2005]. |
| Tay et al., "Artificial Intelligence and the Mass Appraisal of Residential Apartments," Journal of Property Valuation and Investment, Feb. 1, 1992, 17 pages. |
| U.S. Appl. No. 11/927,623, filed Oct. 29, 2007, Humphries et al. |
| U.S. Appl. No. 11/971,758, filed Jan. 9, 2008, Humphries et al. |
| Vladimir Svetnik et al, Random Forest: A Classification and Regression Tool for compound Classification and QSAR Modleing. J. Chem Info. Computer Science, 2003, vol. 43, pp. 1947-1958. * |
| www.cran.r-project.org, "The Comprehensive R Archive Network," http://web.archive.org/web/20050830073913/cran.r-project.org/banner.shtml, pp. 1-2 [internet archive date: Aug. 30, 2005]. |
| www.r-project.org, "The R Project for Statistical Computing," http://web.archive.org/web/20060102073515/www.r-project.org/main.shtml, 1 page [internet archive date: Jan. 2, 2006]. |
Cited By (65)
| Publication number | Priority date | Publication date | Assignee | Title |
|---|---|---|---|---|
| US10896449B2 (en) * | 2006-02-03 | 2021-01-19 | Zillow, Inc. | Automatically determining a current value for a real estate property, such as a home, that is tailored to input from a human user, such as its owner |
| US10074111B2 (en) | 2006-02-03 | 2018-09-11 | Zillow, Inc. | Automatically determining a current value for a home |
| US11244361B2 (en) | 2006-02-03 | 2022-02-08 | Zillow, Inc. | Automatically determining a current value for a home |
| US20150379588A1 (en) * | 2006-02-03 | 2015-12-31 | Zillow, Inc. | Automatically determining a current value for a real estate property, such as a home, that is tailored to input from a human user, such as its owner |
| US11769181B2 (en) | 2006-02-03 | 2023-09-26 | Mftb Holdco. Inc. | Automatically determining a current value for a home |
| US11315202B2 (en) | 2006-09-19 | 2022-04-26 | Zillow, Inc. | Collecting and representing home attributes |
| US10713596B2 (en) * | 2007-05-15 | 2020-07-14 | Intellireal, Llc | Transforming property data into sufficiently sized, relatively homogeneous data segments for configuring automated modeling systems |
| US11449958B1 (en) | 2008-01-09 | 2022-09-20 | Zillow, Inc. | Automatically determining a current value for a home |
| US11727449B2 (en) | 2010-09-16 | 2023-08-15 | MFTB Holdco, Inc. | Valuation system |
| US10380653B1 (en) | 2010-09-16 | 2019-08-13 | Trulia, Llc | Valuation system |
| US11068911B1 (en) | 2011-03-09 | 2021-07-20 | Zillow, Inc. | Automatically determining market rental rate index for properties |
| US11288756B1 (en) | 2011-03-09 | 2022-03-29 | Zillow, Inc. | Automatically determining market rental rates for properties |
| US10460406B1 (en) | 2011-03-09 | 2019-10-29 | Zillow, Inc. | Automatically determining market rental rates for properties |
| US20130080340A1 (en) * | 2011-09-23 | 2013-03-28 | Elif Onmus-Baykal | Indexing and adjusting for property condition in an automated valuation model |
| US20130101234A1 (en) * | 2011-10-24 | 2013-04-25 | Fannni Mae | Automated valuation model with customizable neighborhood determination |
| US9195998B2 (en) * | 2011-10-24 | 2015-11-24 | Fannie Mae | Automated valuation model with customizable neighborhood determination |
| US20140149297A1 (en) * | 2011-10-24 | 2014-05-29 | Fannie Mae | Automated valuation model with customizable neighborhood determination |
| US8655106B2 (en) * | 2011-10-24 | 2014-02-18 | Fannie Mae | Automated valuation model with customizable neighborhood determination |
| US20130144796A1 (en) * | 2011-12-06 | 2013-06-06 | Fannie Mae | Assigning confidence values to automated property valuations by using the non-typical property characteristics of the properties |
| US10417697B2 (en) | 2012-12-17 | 2019-09-17 | Auction.Com, Llc | System and method for structuring an online auction when reserve price is not met |
| US9947041B2 (en) | 2012-12-17 | 2018-04-17 | Ten-X, Llc | Dynamically determining bid increments for online auctions |
| US10380679B2 (en) * | 2013-03-15 | 2019-08-13 | Auction.Com, Llc | Valuation tool for an online auction of a real property asset |
| US9697566B2 (en) | 2013-03-15 | 2017-07-04 | Ten-X, Llc | System and mehtod for providing information about assets during a live auction |
| US10628878B2 (en) | 2013-03-15 | 2020-04-21 | Auction.Com, Llc | System and method for generating content for a listing on an online marketplace |
| US9881335B2 (en) | 2013-03-15 | 2018-01-30 | Ten-X, Llc | System and method for selecting personalities to facilitate the completion of an online auction |
| US9536148B2 (en) | 2013-09-27 | 2017-01-03 | Real Data Guru, Inc. | Property assessment and prospecting tool |
| US10754884B1 (en) | 2013-11-12 | 2020-08-25 | Zillow, Inc. | Flexible real estate search |
| US11232142B2 (en) | 2013-11-12 | 2022-01-25 | Zillow, Inc. | Flexible real estate search |
| US10984489B1 (en) | 2014-02-13 | 2021-04-20 | Zillow, Inc. | Estimating the value of a property in a manner sensitive to nearby value-affecting geographic features |
| US20180232784A1 (en) * | 2014-08-26 | 2018-08-16 | Municipal Property Assessment Corporation | Method and system for real estate valuation |
| US11093982B1 (en) | 2014-10-02 | 2021-08-17 | Zillow, Inc. | Determine regional rate of return on home improvements |
| WO2016069765A1 (en) * | 2014-10-28 | 2016-05-06 | WWTemplar LLC | Component-based building assessment |
| US10643232B1 (en) | 2015-03-18 | 2020-05-05 | Zillow, Inc. | Allocating electronic advertising opportunities |
| US11354701B1 (en) | 2015-03-18 | 2022-06-07 | Zillow, Inc. | Allocating electronic advertising opportunities |
| US10192275B2 (en) * | 2015-03-30 | 2019-01-29 | Creed Smith | Automated real estate valuation system |
| US10319054B2 (en) * | 2015-03-30 | 2019-06-11 | Creed Smith | Automated entity valuation system |
| US10650354B2 (en) | 2015-12-29 | 2020-05-12 | Setschedule Ip Holdings, Llc | System and method for transacting lead and scheduled appointment records |
| US9934490B2 (en) | 2015-12-29 | 2018-04-03 | Setschedule Ip Holdings, Llc | System and method for transacting lead and scheduled appointment records |
| US11886962B1 (en) | 2016-02-25 | 2024-01-30 | MFTB Holdco, Inc. | Enforcing, with respect to changes in one or more distinguished independent variable values, monotonicity in the predictions produced by a statistical model |
| US10789549B1 (en) | 2016-02-25 | 2020-09-29 | Zillow, Inc. | Enforcing, with respect to changes in one or more distinguished independent variable values, monotonicity in the predictions produced by a statistical model |
| US20180025452A1 (en) * | 2016-07-21 | 2018-01-25 | Realtex Value LLC | Computerized systems and methods for optimizing building construction |
| US11200513B2 (en) | 2017-10-13 | 2021-12-14 | Carrier Corporation | Real estate image analysis |
| US11620884B2 (en) | 2019-01-25 | 2023-04-04 | Lghorizon, Llc | Egress advisement devices to output emergency egress guidance to users |
| US11625996B2 (en) | 2019-01-25 | 2023-04-11 | Lghorizon, Llc | Computer-based training for emergency egress of building with distributed egress advisement devices |
| US10872510B2 (en) | 2019-01-25 | 2020-12-22 | Lghorizon, Llc | Home emergency guidance and advisement system |
| US11335171B2 (en) | 2019-01-25 | 2022-05-17 | Lghorizon, Llc | Home emergency guidance and advisement system |
| US11631305B2 (en) | 2019-01-25 | 2023-04-18 | Lghorizon, Llc | Centrally managed emergency egress guidance for building with distributed egress advisement devices |
| US11600156B2 (en) | 2019-01-25 | 2023-03-07 | Lghorizon, Llc | System and method for automating emergency egress advisement generation |
| US11620883B2 (en) | 2019-01-25 | 2023-04-04 | Lghorizon, Llc | System and method for dynamic modification and selection of emergency egress advisement |
| US11625997B2 (en) | 2019-01-25 | 2023-04-11 | Lghorizon, Llc | Emergency egress guidance using advisements stored locally on egress advisement devices |
| US11625998B2 (en) | 2019-01-25 | 2023-04-11 | Lghorizion, Llc | Providing emergency egress guidance via peer-to-peer communication among distributed egress advisement devices |
| US11625995B2 (en) | 2019-01-25 | 2023-04-11 | Lghorizon, Llc | System and method for generating emergency egress advisement |
| US10553085B1 (en) | 2019-01-25 | 2020-02-04 | Lghorizon, Llc | Home emergency guidance and advisement system |
| US11861748B1 (en) | 2019-06-28 | 2024-01-02 | MFTB Holdco, Inc. | Valuation of homes using geographic regions of varying granularity |
| US11682052B2 (en) | 2019-10-15 | 2023-06-20 | Orchard Technologies, Inc. | Machine learning systems and methods for determining home value |
| US11769180B2 (en) | 2019-10-15 | 2023-09-26 | Orchard Technologies, Inc. | Machine learning systems and methods for determining home value |
| TWI739371B (en) * | 2020-04-07 | 2021-09-11 | 中國信託商業銀行股份有限公司 | Real estate appraisal method and real estate appraisal device |
| US11501621B2 (en) | 2020-06-16 | 2022-11-15 | Lghorizon, Llc | Predictive building emergency guidance and advisement system |
| US11756399B2 (en) | 2020-06-16 | 2023-09-12 | Tabor Mountain Llc | Predictive building emergency guidance and advisement system |
| US11043095B1 (en) | 2020-06-16 | 2021-06-22 | Lghorizon, Llc | Predictive building emergency guidance and advisement system |
| US11583770B2 (en) | 2021-03-01 | 2023-02-21 | Lghorizon, Llc | Systems and methods for machine learning-based emergency egress and advisement |
| US11850515B2 (en) | 2021-03-01 | 2023-12-26 | Tabor Mountain Llc | Systems and methods for machine learning-based emergency egress and advisement |
| WO2022224204A1 (en) * | 2021-04-23 | 2022-10-27 | BricksNData Pty Ltd | System and method for estimating asset value at a point in time |
| US11626002B2 (en) | 2021-07-15 | 2023-04-11 | Lghorizon, Llc | Building security and emergency detection and advisement system |
| US11875661B2 (en) | 2021-07-15 | 2024-01-16 | Tabor Mountain Llc | Building security and emergency detection and advisement system |
Also Published As
| Publication number | Publication date |
|---|---|
| US20070198278A1 (en) | 2007-08-23 |
Similar Documents
| Publication | Publication Date | Title |
|---|---|---|
| US7970674B2 (en) | Automatically determining a current value for a real estate property, such as a home, that is tailored to input from a human user, such as its owner | |
| US10896449B2 (en) | Automatically determining a current value for a real estate property, such as a home, that is tailored to input from a human user, such as its owner | |
| US11769181B2 (en) | Automatically determining a current value for a home | |
| US11449958B1 (en) | Automatically determining a current value for a home | |
| US11068911B1 (en) | Automatically determining market rental rate index for properties | |
| US20010039506A1 (en) | Process for automated real estate valuation | |
| US10984489B1 (en) | Estimating the value of a property in a manner sensitive to nearby value-affecting geographic features | |
| US20170053297A1 (en) | Enhanced systems, processes, and user interfaces for scoring assets associated with a population of data | |
| US20150012335A1 (en) | Automated rental amount modeling and prediction | |
| US11288756B1 (en) | Automatically determining market rental rates for properties | |
| WO2002019216A2 (en) | Value your home | |
| JP2021523486A (en) | Product sort | |
| US20180330390A1 (en) | Enhanced systems, processes, and user interfaces for targeted marketing associated with a population of assets | |
| Song et al. | Improved price index for condominiums | |
| Gabrielli et al. | Pricing to market: property valuation methods–a practical review | |
| US20130219315A1 (en) | Graphical User Interface for Real Estate Search | |
| Le Goix et al. | Unequal housing affordability across European cities. The ESPON housing database, insights on affordability in selected cities in Europe | |
| Grover et al. | Residential property price indices: fit for purpose? | |
| PROPERTY et al. | Cheng et al. | |
| Hartman | COVID-19 and Counter Urbanization? An Investigation of Residential Price Trends in Flevoland and Surrounding Areas Between 2018 and 2021. | |
| Xu | Is there a bubble in Chinese housing market? Empirical study on Chinese major housing markets | |
| Ayzenberg | Analyzing Housing Demand and its Role in the US Economy | |
| Dodds | An investigation into the hedonic price analysis of the structural characteristics of residential property in the West Rand | |
| Bester | Developing a repeat sales property price index for residential properties in South Africa | |
| Wright | Characteristics of the Duplex Buyer: The Texas Case |
Legal Events
| Date | Code | Title | Description |
|---|---|---|---|
| AS | Assignment |
Owner name: ZILLOW, INC., WASHINGTON Free format text: ASSIGNMENT OF ASSIGNORS INTEREST;ASSIGNORS:CHENG, DAVID;HUMPHRIES, STAN;CHUNG, KYUSIK;AND OTHERS;REEL/FRAME:017883/0799 Effective date: 20060428 |
|
| STCF | Information on status: patent grant |
Free format text: PATENTED CASE |
|
| CC | Certificate of correction | ||
| AS | Assignment |
Owner name: SILICON VALLEY BANK, CALIFORNIA Free format text: SECURITY AGREEMENT;ASSIGNOR:ZILLOW, INC.;REEL/FRAME:028169/0881 Effective date: 20120430 |
|
| FEPP | Fee payment procedure |
Free format text: PAT HOLDER NO LONGER CLAIMS SMALL ENTITY STATUS, ENTITY STATUS SET TO UNDISCOUNTED (ORIGINAL EVENT CODE: STOL); ENTITY STATUS OF PATENT OWNER: LARGE ENTITY |
|
| IPR | Aia trial proceeding filed before the patent and appeal board: inter partes review |
Free format text: TRIAL NO: IPR2013-00034 Opponent name: MICROSTRATEGY, INC. Effective date: 20121026 |
|
| CBM | Aia trial proceeding filed before patent trial and appeal board: covered business methods |
Free format text: TRIAL NO: CBM2013-00056 Opponent name: TRULIA, INC. Effective date: 20130911 |
|
| CBM | Aia trial proceeding filed before patent trial and appeal board: covered business methods |
Free format text: TRIAL NO: CBM2014-00115 Opponent name: TRULIA, INC. Effective date: 20140410 |
|
| FPAY | Fee payment |
Year of fee payment: 4 |
|
| IPRC | Trial and appeal board: inter partes review certificate |
Kind code of ref document: K1 Free format text: INTER PARTES REVIEW CERTIFICATE; TRIAL NO. IPR2013-00034, OCT. 26, 2012INTER PARTES REVIEW CERTIFICATE FOR PATENT 7,970,674, ISSUED JUN. 28, 2011, APPL. NO. 11/347,024, FEB. 3, 2006INTER PARTES REVIEW CERTIFICATE ISSUED FEB. 16, 2018 Effective date: 20180216 |
|
| MAFP | Maintenance fee payment |
Free format text: PAYMENT OF MAINTENANCE FEE, 8TH YEAR, LARGE ENTITY (ORIGINAL EVENT CODE: M1552); ENTITY STATUS OF PATENT OWNER: LARGE ENTITY Year of fee payment: 8 |
|
| MAFP | Maintenance fee payment |
Free format text: PAYMENT OF MAINTENANCE FEE, 12TH YEAR, LARGE ENTITY (ORIGINAL EVENT CODE: M1553); ENTITY STATUS OF PATENT OWNER: LARGE ENTITY Year of fee payment: 12 |
|
| AS | Assignment |
Owner name: ZILLOW, LLC, WASHINGTON Free format text: ARTICLES OF ENTITY CONVERSION AND CERTIFICATE OF FORMATION;ASSIGNOR:ZILLOW, INC.;REEL/FRAME:062136/0427 Effective date: 20221028 |
|
| AS | Assignment |
Owner name: PUSH SUB I, INC., WASHINGTON Free format text: ASSIGNMENT OF ASSIGNORS INTEREST;ASSIGNOR:ZILLOW, LLC;REEL/FRAME:062353/0901 Effective date: 20221030 |
|
| AS | Assignment |
Owner name: MFTB HOLDCO, INC., WASHINGTON Free format text: MERGER;ASSIGNOR:PUSH SUB I, INC.;REEL/FRAME:062389/0035 Effective date: 20221031 |