US8095434B1 - Automatically performing varying levels of summarization of geographic data points in response to a user's selection of zoom level - Google Patents
Automatically performing varying levels of summarization of geographic data points in response to a user's selection of zoom level Download PDFInfo
- Publication number
- US8095434B1 US8095434B1 US12/031,436 US3143608A US8095434B1 US 8095434 B1 US8095434 B1 US 8095434B1 US 3143608 A US3143608 A US 3143608A US 8095434 B1 US8095434 B1 US 8095434B1
- Authority
- US
- United States
- Prior art keywords
- identified
- user
- geographic area
- map
- region
- Prior art date
- Legal status (The legal status is an assumption and is not a legal conclusion. Google has not performed a legal analysis and makes no representation as to the accuracy of the status listed.)
- Active, expires
Links
Images


Classifications
-
- G—PHYSICS
- G06—COMPUTING; CALCULATING OR COUNTING
- G06Q—INFORMATION AND COMMUNICATION TECHNOLOGY [ICT] SPECIALLY ADAPTED FOR ADMINISTRATIVE, COMMERCIAL, FINANCIAL, MANAGERIAL OR SUPERVISORY PURPOSES; SYSTEMS OR METHODS SPECIALLY ADAPTED FOR ADMINISTRATIVE, COMMERCIAL, FINANCIAL, MANAGERIAL OR SUPERVISORY PURPOSES, NOT OTHERWISE PROVIDED FOR
- G06Q30/00—Commerce
- G06Q30/06—Buying, selling or leasing transactions
- G06Q30/0601—Electronic shopping [e-shopping]
- G06Q30/0639—Item locations
-
- G—PHYSICS
- G06—COMPUTING; CALCULATING OR COUNTING
- G06F—ELECTRIC DIGITAL DATA PROCESSING
- G06F16/00—Information retrieval; Database structures therefor; File system structures therefor
- G06F16/20—Information retrieval; Database structures therefor; File system structures therefor of structured data, e.g. relational data
- G06F16/29—Geographical information databases
-
- G—PHYSICS
- G06—COMPUTING; CALCULATING OR COUNTING
- G06Q—INFORMATION AND COMMUNICATION TECHNOLOGY [ICT] SPECIALLY ADAPTED FOR ADMINISTRATIVE, COMMERCIAL, FINANCIAL, MANAGERIAL OR SUPERVISORY PURPOSES; SYSTEMS OR METHODS SPECIALLY ADAPTED FOR ADMINISTRATIVE, COMMERCIAL, FINANCIAL, MANAGERIAL OR SUPERVISORY PURPOSES, NOT OTHERWISE PROVIDED FOR
- G06Q30/00—Commerce
- G06Q30/06—Buying, selling or leasing transactions
- G06Q30/0601—Electronic shopping [e-shopping]
- G06Q30/0641—Shopping interfaces
Definitions
- the described technology is directed to the field of dynamic mapping techniques.
- web sites It has recently become common for web sites to display individual data points in connection with a geographic map. For example, many real estate web sites permit their users to display a map of a particular geographic region that shows the location of every home that is currently for sale. A user may click on one of these homes to obtain detailed information about the home. Similarly, some property tax jurisdictions make available web sites that show each property tax parcel on a map; a user may click on one of the parcels to see detailed information about it.
- a user may typically zoom a map displayed by a web site in or out to show, respectively, a smaller or larger geographic region in the same display region on the screen.
- a map may also typically be panned in any direction, such that a neighboring geographic region in that direction is displayed, thus “traversing” geographic space.
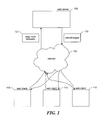
- FIG. 1 is a high-level data flow diagram showing data flow within a typical arrangement of components used to provide the facility.
- FIG. 2 is a block diagram showing some of the components typically incorporated in at least some of the computer systems and other devices on which the facility executes.
- FIG. 3 is a flow diagram showing steps typically performed by the facility in order to serve a map including selective summarization.
- FIG. 4 is a display diagram showing a map annotated by the facility at the city summarization level.
- FIG. 5 is a display diagram showing a typical display generated by the facility containing additional information about the Seattle, Wash. city region.
- FIG. 6 is a display diagram showing a sample display of a map of the Seattle city region as annotated at the neighborhood summarization level.
- FIG. 7 is a display diagram showing a typical display generated by the facility containing additional information about the Belltown neighborhood.
- FIG. 8 is a display diagram showing a display typically presented by the facility that shows individual homes and/or buildings within the Belltown neighborhood region.
- FIG. 9 is a display diagram showing a display typically presented by the facility containing additional information about one of the units that is for sale in the multi-unit building.
- FIG. 10 is a display diagram showing a display typically presented by the facility containing additional information about a second one of the units that is for sale in the building.
- FIG. 11 is a data flow diagram showing a typical process for processing a hybrid query performed by the facility.
- FIGS. 12A-12C are table diagrams showing a text index, a geographic index, and a relational index.
- FIG. 13 is a flow diagram showing steps typically performed by the facility in order to process a hybrid query.
- FIGS. 14A-14C show text, geographic, and relational constituent results.
- FIG. 15 a table diagram showing a final result generated by the facility for the sample query shown in Table 4 by joining the constituent results shown in FIGS. 14A-14C .
- FIGS. 16-20 show sample displays presented as part of the user interface.
- FIGS. 21-23 are flow diagrams showing steps typically performed by the facility in order to present the query specification user interface described above.
- the inventors have recognized that conventional techniques for plotting data points on a geographic map as described above tend to be useful only at certain zoom levels, in which a tenable number of geographically-associated data points are displayed. For example, in a county containing thousands of homes, hundreds of homes may be for sale at a given time. A map zoomed to show the entire county will include a data point for each of these homes, which in most cases produces a cluttered and difficult-to-use display.
- a software facility for showing information corresponding to geographically-associated data points on a map that automatically performs varying levels of summarization of this information in response to a user's selection of zoom level for the map (“the facility”) is described.
- the facility establishes a set of summarization levels, at each of which the facility can summarize information corresponding to geographically-associated data points.
- the facility uses summarization levels including country, state, county, city, neighborhood, and individual home.
- the facility uses summarization levels corresponding to a wide variety of other types of geographic regions, including, for example, boroughs, zip codes, zip+4 codes, census tracts, subdivisions, election districts, school districts, multi-unit buildings, and/or multi-building developments.
- the facility determines which of the summarization levels to apply. For example, for a map that is positioned to show twenty cities, each of which has data points, the facility may determine to apply the city summarization level, such that the facility summarizes, for each of the twenty cities, the data points in that city. In some embodiments, the facility makes this determination by applying a deterministic mapping from zoom level to summarization level. For example, where the mapping mechanism being used is limited to a reasonably small number of discrete zoom levels, the facility may map from each of these discrete zoom levels to one of the summarization levels.
- the facility may map from each of a number of adjacent ranges of continuous zoom levels to one of the summarization levels.
- the facility determines which summarization level to apply using a population analysis technique, in which the facility establishes for each summarization level an optimal number of regions to show, and selects the summarization level where the actual number of regions shown in the displayed map is closest to the optimal level for that summarization level.
- the facility may determine to apply the city summarization level in view of the proximity of 3 to 4.
- the facility employs one or more of various forms of summarization to dynamically combine values associated with individual data points in a region into values included in a summary for that region, such as value aggregation, selection of a representative data point, multidimensional graphing, semantic summarization, or other analytical and/or visualization tools.
- the facility enables the user displaying the map to filter the data points that are displayed or summarized in a variety of ways, such as by specifying acceptable values or ranges of values for various attributes of the data points.
- the user can specify acceptable values or ranges for attributes such as home type, listing price, selling price, current valuation, number of bedrooms, number of bathrooms, sale status, lot or home size, year of construction, view type, roof type, etc.
- the facility is able to provide information that is better-tailored to a wider variety of zoom levels than provided by conventional techniques.
- FIG. 1 is a high-level data flow diagram showing data flow within a typical arrangement of components used to provide the facility.
- a number of web client computer systems 110 that are under user control generate and send page view requests 231 to a logical web server 100 via a network such as the Internet 120 . Within the web server, these requests may either all be routed to a single web server computer system, or may be loaded-balanced among a number of web server computer systems.
- the web server typically replies to each with a served page 132 .
- FIG. 2 is a block diagram showing some of the components typically incorporated in at least some of the computer systems and other devices on which the facility executes.
- These computer systems and devices 200 may include one or more central processing units (“CPUs”) 201 for executing computer programs; a computer memory 202 for storing programs and data while they are being used; a persistent storage device 203 , such as a hard drive for persistently storing programs and data; a computer-readable media drive 204 , such as a CD-ROM drive, for reading programs and data stored on a computer-readable medium; and a network connection 205 for connecting the computer system to other computer systems, such as via the Internet.
- CPUs central processing units
- a computer memory 202 for storing programs and data while they are being used
- a persistent storage device 203 such as a hard drive for persistently storing programs and data
- a computer-readable media drive 204 such as a CD-ROM drive, for reading programs and data stored on a computer-readable medium
- a network connection 205 for connecting
- FIG. 3 is a flow diagram showing steps typically performed by the facility in order to serve a map including selective summarization.
- the facility receives a page request specifying both a map location and a zoom level. In some embodiments, some page requests specify search criteria to limit the set of data points that are displayed and/or summarized in the requested map.
- the facility generates a map at the location and zoom level specified by the page request received in step 301 .
- the facility determines which summarization level to apply. In some embodiments, the facility makes this determination by applying a deterministic mapping from zoom level to summarization level. Table 1 below shows such a mapping, where higher zoom levels correspond to smaller geographic areas.
- the facility determines to apply the city summarization level.
- the facility maps ranges of zoom levels each to a summarization level.
- step 303 involves (1) scoring each summarization level based upon factors including the difference between (a) the actual number of geographic regions corresponding to the summarization level that appear on the map and (b) an optimal number of such geographic regions determined for the summarization level, then (2) selecting the highest score. Equation 1 below shows a formula used by the facility in some embodiments to determine a score for each summarization level.
- Score summarization ⁇ ⁇ leve ⁇ l preference ⁇ ⁇ score + most ⁇ ⁇ recent ⁇ ⁇ summarization ⁇ ⁇ level ⁇ ⁇ bonus - ⁇ log ⁇ ( number ⁇ ⁇ of ⁇ ⁇ regions optimal ⁇ ⁇ number ⁇ ⁇ of ⁇ ⁇ regions ) ⁇ ⁇ distance ⁇ ⁇ weight Equation ⁇ ⁇ 1
- the preference score reflects the facility's overall level of preference for using the summarization level.
- the most recent summarization level bonus is a positive constant value if the present summarization level is the same as the last summarization level used for the requesting user, and zero otherwise. (In some embodiments, the most recent summarization level bonus is only non-zero where the current page request represents a panning request from the user relative to the map indicated in the last page served to the user.)
- the number of regions is the actual number of geographic regions of the type corresponding to the summarization level that intersect the map.
- the optimal number of regions is a predetermined optimal number of such regions to show in a map.
- the distance weight reflects the significance attributed to deviations of the actual number of regions from the optimal number of regions. Table 2 below uses sample configuration data used by the facility in some embodiments as a basis for determining scores using the formula in Equation 1.
- the state summarization level is the summarization level most recently used for the requesting user, and the most recent summarization level bonus is established to have a value of 5, and the number of states intersecting the map is 2, the score for the state summarization level is 4+5+
- ⁇ 5 7.5.
- the facility tests the determined summarization level to ensure that at least one region of the region type corresponding to the determined summarization level can be displayed on the map. In particular, in some embodiments, the facility determines whether any region of the region type corresponding to the determined summarization level intersects the area represented by the map. In some embodiments, the facility determines whether any region of the region type corresponding to the determined summarization level intersects a region near the center of the area of the map, such as the central two-thirds area of the map. If no such region intersects, in some embodiments, the facility determines to employ an alternative summarization level, such as a summarization level corresponding to zip code regions, that is relatively ubiquitous, ensuring in most cases that at least one region can be displayed on the map.
- an alternative summarization level such as a summarization level corresponding to zip code regions
- step 304 the facility generates map annotations in accordance with the summarization level determined in step 303 .
- step 304 involves: drawing all borders between regions of the determined summarization level that occur within the map; for each region of the summarization level that has a non-zero number of data points that satisfy the user's search criteria, showing some information summarized across the data points that satisfy the user's search criteria, such as number of data points in the region that satisfy the user's search criteria, average value of data points in the region that satisfy the user's search criteria, minimum or maximum value of data points within the region that satisfy the user's search criteria, etc.; and, for the regions of the summarization level having the highest number of data points that satisfy the user's search criteria, such as the top 20 regions, showing their names.
- the facility may show the names of regions of the summarization level that do not have the highest number of data points that satisfy the user's search criteria, but are near the center of the map, and are therefore likely to be significant to the user.
- step 304 includes adding functionality to the map that causes the borders of a region of the determined summarization level to be highlighted when the mouse cursor hovers within the region. Annotations generated by the facility in step 304 are discussed in greater detail below in connections with FIGS. 4-10 .
- step 305 the facility generates a textual list of geographic regions at the determined summarization level. Again, this list shows information summarized across each of the geographic regions at the determined summarization level that, intersects the map.
- step 306 the facility serves a page in response to the page request received in step 301 that contains the map generated in step 303 , annotated with the annotations generated in step 304 , together with the textual list generated in step 305 .
- the facility continues in step 301 to receive the next page request.
- Such a next page request may be sent, for example, when the same user zooms or pans the map returned in response to the current page request, or when the user alters the set of data points by adjusting the filtering criteria.
- FIGS. 4-10 are display diagrams showing sample displays that are typical of those presented by the facility.
- FIG. 4 is a display diagram showing a map annotated by the facility at the city summarization level.
- a browser window 400 includes a served web page in client area 401 .
- the web page includes controls 411 - 426 that may be used by the user to filter the set of data items (here, homes) that occur in the geographic area represented by the map. It can be seen that the user has selected control 412 in order to limit the home data items in the area of the map to those that have a for sale status—in other words, those that are on the market. Control 412 contains an indication that there are 2,594 for sale homes within the area of the map.
- the user could remove this restriction by selecting control 411 , or may modify it by selecting any of controls 424 - 426 to limit the results to the other categories of home data items represented by these controls.
- the user may also use controls 413 - 422 to further restrict the set of for sale homes that are included in the result set based upon various attributes of those homes.
- the geographic area depicted in map 450 is subject to adjustment by the user using a panning control 451 and/or a zooming control 452 .
- Various other approaches to navigating the map including keyboard commands, mouse wheel rotations, click-and-drag gestures, etc., may also be used to adjust the geographic area depicted in the map.
- the scale of the map is represented by scale legend 499 .
- the map shows a number of city regions, including city regions 461 - 466 .
- the borders that divide the city regions are shown as white lines, and many of the city regions, such as those numbered above, contain the name of the region, as well as an indication of the number of home data points within the region.
- the Seattle, Wash. city region 461 shows both this name, and an indication that there are 1,152 home data points in this region that satisfy the user's search criteria—in this case, the status “for sale.”
- the page contains a list (only partially shown) 490 of each of the city regions that intersect the area of the map.
- the page includes controls 491 for reordering this textual list in useful ways.
- FIG. 5 is a display diagram showing a typical display generated by the facility containing additional information about the Seattle, Wash. city region. Map 550 contains an information bubble 580 positioned adjacent to the map legend for the Seattle, Wash.
- city region that includes the following: a control 581 that the user can select to zoom the map to the Seattle city region; an indication 582 of the median listing home price among the home data items in the Seattle city region that satisfy the user's search criteria; an indication 583 of the average current valuation of these homes; an indication 584 of the total population of the Seattle city region; an indication 585 of the number of for sale homes in this region; a control 586 that the user may select in order to see a variety of information collected about this geographic region; and a control 587 that the user may select in order to close or dismiss the bubble.
- FIG. 6 is a display diagram showing a sample display of a map of the Seattle city region as annotated at the neighborhood summarization level.
- Map 650 corresponds to the geographic area of the Seattle city region. It can be seen by comparing scale legend 699 to scale legend 499 shown in FIG. 4 that the geographic region depicted in map 650 is smaller than the geographic region depicted in map 450 shown in FIG. 4 . It can be seen that the page further includes indications 612 and 670 that there are 923 homes for sale in the Seattle city region.
- the map contains visual indications, such as visual indication 661 - 664 , of neighborhood regions within the Seattle city region. Similar to FIG.
- the borders between neighborhood regions are shown as white lines. Further, for many of the neighborhoods, the name of the neighborhood is shown, as well as the number of data home points within the neighborhood. For example, legend 661 indicates that the Belltown neighborhood region contains 19 home data points. Also, textual list 690 contains a summarized entry for each neighborhood region within the Seattle city region.
- FIG. 7 is a display diagram showing a typical display generated by the facility containing additional information about the Belltown neighborhood.
- the user may cause the facility to generate the display by, for example, clicking on legend 661 shown in FIG. 6 .
- the map 750 includes an information bubble 780 containing information about the Belltown neighborhood region that is similar to information shown in bubble 580 in FIG. 5 for the Seattle city region.
- FIG. 8 is a display diagram showing a display typically presented by the facility that shows individual homes and/or buildings within the Belltown neighborhood region. The user may cause the facility to present this display by selecting control 781 shown in FIG. 7 . It can be seen by comparing scale legend 899 to scale legend 699 shown in FIG. 6 that the geographic area depicted in map 850 is smaller than that depicted in map 650 shown in FIG. 6 . Map 850 contains legends for individual homes and/or buildings. Indications 812 and 870 show that there are 28 home data points in this region, including those represented by legends 861 - 864 .
- the listing price of the home is shown on the map.
- the map shows a listing price of $600,000 for individual home legend 862 .
- “Apartment building outline” legends such as legend 861 represents a multi-unit building. It can be seen from the text accompanying this legend that there are 3 homes for sale in this building.
- the facility displays additional summary statistics in connection with multi-unit building legends, such as the median listing price of the units of the building that match the user's search criteria, the range of valuations for such units, etc.
- textual list 890 contains each of the individual homes or buildings on the map. The user can select an individual home or multi-unit building legend in order to display more information about the home or the units in the multi-unit building.
- FIG. 9 is a display diagram showing a display typically presented by the facility containing additional information about one of the units that is for sale in the multi-unit building represented by legend 861 shown in FIG. 8 .
- Map 950 contains an information bubble 980 positioned adjacent to the building map legend 861 that includes the following information: a control 981 that the user can select to display more information about this unit; an indication 982 that the unit is for sale; an indication 983 of attributes of the unit; an indication 984 of the number of days that have elapsed since the unit was listed for sale; a control 985 that the user may select to display a list of recent comparable sales; a control 986 that the user may select in order to save the unit to the user's list of favorite homes; an image 987 of the unit; controls 988 and 989 that the user may select in order to scroll through the list of units in the building and are for sale; an indication 990 of the for sale unit in the building whose information is shown in the bubble; a control 991 that the user may select in order to see
- FIG. 10 is a display diagram showing a display typically presented by the facility containing additional information about a second one of the units that is for sale in the building represented by building legend 861 .
- the user may cause the facility to present this display by selecting control 989 shown in FIG. 9 .
- the map 1050 includes an information bubble 1080 containing information about the second for sale unit in the building that is similar to the information shown in bubble 980 shown in FIG. 5 for the first unit.
- the user may filter the set of data items that are displayed and/or summarized by the facility in a variety of ways.
- the discussion that follows describes a variety of ways that such filtering is supported by the facility in various embodiments.
- the facility uses an index, sometimes referred to as a “compound index,” that is specially adapted to resolving hybrid queries that specify two or more different kinds of search criteria to identify data items in a database satisfying the criteria included in the query.
- an index sometimes referred to as a “compound index” that is specially adapted to resolving hybrid queries that specify two or more different kinds of search criteria to identify data items in a database satisfying the criteria included in the query.
- the facility uses a compound index to resolve queries including criteria of any of the following three types: (1) textual criteria that specify textual attributes of a data item; (2) relational criteria that specify relational attributes of a data item; and (3) geographic criteria specifying geographic location attributes of a data item.
- the compound index is made up of (1) an inverted index representing the textual attributes of each data item; (2) an indexed relational database made up of one or more tables representing the relational attributes of each data item; and (3) a geopoint table representing the geographic attributes of each data item, where item IDs that identify items in the inverted index correspond to the order of rows representing items in the tables of the relational database as well as the order of rows representing items in the geopoint table.
- the resulting three constituent result sets can be joined together to form a final result set without having to first sort any of the constituent result sets, as each constituent result set is ordered in accordance with the item IDs.
- the facility provides a user interface that permits a user to create a query by specifying values or ranges of values (hereafter “values”) for each of a number of item attributes. Some of these values are always displayed within the user interface, while others are displayed only when a drop-down menu containing them is selected by the user.
- the facility (1) processes a query selecting items having the specified values and/or ranges of values to obtain a result set; (2) identifies any attribute whose values are displayed but for which no value has yet been specified; (3) in a single pass through the result set, counts the number of items having each of the displayed attribute values; and (4) displays the count for each of the displayed attribute values next to the attribute value.
- the facility (5) establishes a large number of “bins” (such as 50 bins) each corresponding to a small range of values of the attribute; (6) as part of (3), for each bin, counts the number of items having a value of the attribute within the range for the bin; and (7) collapses the large number of bins to a smaller number of bins, such a four bins, each containing a roughly similar number of items and generally corresponding to larger ranges than the original bins; and (8) in (4), displays the attribute value ranges and counts for the collapsed bins.
- This approach provides a powerful query specification user interface while consuming reasonable quantities of computing resources.
- FIG. 11 is a data flow diagram showing a typical process for processing a hybrid query performed by the facility.
- the facility builds and maintains each of the indices—here indices 1111 - 1113 in a normalized form, such as by representing the data items in the same order in each of the indices.
- the facility applies a query 1120 received from the user against all the indices to obtain a constituent query result for each of the indices, here constituent query results 1131 - 1133 . Because of the manner in which the indices were built and maintained, these constituent query results are already in normalized form, and it is not necessary to incur the extra cost in computing resources of sorting them.
- the facility intersects the constituent query results to obtain a final query result 1150 .
- Table 3 shows a sample data item among a set of data items searched by the facility.
- the sample data item contains various kinds of information about a home.
- the home has an identifier of 20, and a street address as shown.
- the home further has a location identified by the shown latitude and longitude values.
- the home's make me move, for sale, and recently sold statuses are all no.
- the home's price is shown, as are its number of bedrooms and bathrooms, its floor area and lot size, its type and its sale date. Further, a narrative description is shown for the home.
- FIGS. 12A-12C show different indices maintained on a group of home data items including the one described in Table 3.
- FIG. 12A is a table diagram showing a text index 1210 used to identify home data items among the set of home data items having particular words in their textual descriptions.
- the text index is made up of rows including shown rows 1221 - 1230 each representing the occurrence of a single word in the textual description of a single home, and each divided into the following columns: a term column 1211 containing the word, and a home id column 1212 containing the home id of a home data item containing the word in its textual description.
- row 1225 indicates that the word “cozy” is contained in the textual description of the home data item having home id 20 .
- rows 1221 - 1222 for the word “cottage,” rows 1223 - 1228 for the word “cozy,” and rows 1229 - 1230 for the word “cubbies”) occur in increasing order of home id.
- FIG. 12A and each of the table diagrams discussed below show a table whose contents and organization are designed to make them more comprehensible by a human reader, those skilled in the art will appreciate that actual data structures used by the facility to store this information may differ from the table shown, in that they, for example, may be organized in a different manner; may contain more or less information than shown; may be compressed and/or encrypted; etc.
- FIG. 12B shows a geographic index 1240 maintained by the facility on the set of home data items.
- the geographic index is made up of rows including shown rows 1251 - 1255 , each corresponding to a different home data item, and each divided into the following columns: a home id column containing the home id for the home data item; a latitude column 1242 containing the latitude value for the home; and a longitude column 1243 containing a longitude value for the home.
- row 1253 indicates that the home data item having home id 20 has a latitude value of 47.670820 and a longitude value of ⁇ 122.376557.
- the rows are ordered in increasing order of the home id column.
- the facility maintains this order by adding each new data item to the end of the geographic index with a home id that is larger than the largest existing home id.
- FIG. 12C shows a relational index 1260 used to identify home data items having particular relational values.
- the relational index is made up of rows such as shown rows 1281 - 1285 , each of which corresponds to a different home data item and is divided into the following columns: a home id column 1261 containing a home id for the home; a for sale column 1262 indicating whether the home presently has a for sale status; a make me move column 1263 indicating whether the home presently has a make me move status; a recently sold column 1264 that indicates whether the home presently has a recently sold status; a price column 1265 indicating a price for the home; a beds column 1266 indicating the number of bedrooms in the home; a baths column 1267 showing the number of bathrooms in the home; a size column 1268 showing a measurement of the floor area of the home; a lot column 1269 showing a measurement of the area of the home's lot; a type column 1270 indicating the type of the home; and
- the home having home id 20 does not presently have the for sale, make me move, or recently sold properties; has a price of $348,310; has 3 bedrooms and 1 bathroom; has a floor area of 1,370 square feet and a lot size of 6,453 square feet; is a single family home; and was last sold on Oct. 10, 1999.
- the rows are ordered in increasing order of the home id.
- the facility achieves this result by synchronizing the rows of the relational index with the rows of the geographic index shown in FIG. 12B .
- FIG. 13 is a flow diagram showing steps typically performed by the facility in order to process a hybrid query.
- the facility receives the query, which specifies two or more types of criteria.
- An example query discussed further below is shown in Table 4.
- a user may specify the example query, for example, by typing the word “cozy” in a text field; selecting the price range $300K-$400K from a list of price ranges; and navigating a displayed map to show the region encompassing the specified latitude and longitude ranges.
- steps 1302 - 1304 the facility loops through each type of criterion specified in the query—in the sample query, the text, geographic, and relational criteria.
- step 1303 the facility selects from the index for the current criteria type in accordance with the criteria of that type specified in the query to generate a constituent result.
- step 1304 if additional criterion types remain to be processed, then the facility continue in steps 1302 to process the next criterion type, also the facility continues in steps 1305 .
- FIG. 14A shows a text constituent result 1410 .
- the facility generates this constituent result by reading the text index until it first encounters the term “cozy,” and copying this row of the index through the last row containing the term “cozy.”
- the facility instead jumps to the first row containing the term “cozy,” using an additional index on the index, not shown.
- the text constituent result contains rows 1421 - 1426 , corresponding to all of the rows 1223 - 1228 contain the word “cozy” in the text index shown in FIG. 12A .
- the rows of the text constituent result are ordered in increasing order of home id as a result of having been selected from the text index ordered in the same way.
- FIG. 14B shows the geographic constituent result 1430 .
- the facility generates this constituent result by reading each row of the geographic index to determine whether its latitude and longitude both fall within the range specified by the query. It can be seen that rows 1441 - 1446 all contain home locations within the latitude and longitude ranges specified by the query. It can further be seen that the rows of the geographic constituent result are ordered in increasing order of home id, as a result of the geographic index shown in FIG. 12B being ordered in the same manner.
- FIG. 14C shows the relational constituent result 1430 .
- the facility generates this constituent result by reading each row of the relational index to determine whether its attribute values all satisfy the relational constraints of the query. It can be seen that rows 1481 - 1485 each correspond to a home having a price in the specified range. Here too, the rows are ordered in increasing order of home id, as a result of the relational index shown in FIG. 12C having the same order.
- step 1305 the facility joins the constituent results generated in step 1303 .
- step 1306 the facility returns the results of the join operation performed in step 1305 as the final result for the query received in step 1301 .
- step 1306 the facility continues in step 1301 to receive and process the next query.
- FIG. 15 a table diagram showing a final result generated by the facility for the sample query shown in Table 4 by joining the constituent results shown in FIGS. 14A-14C . It contains rows 1501 - 1503 , containing the following home ids that are common to each of the three constituent results: 19, 20, and 49.
- the facility provides a user interface that permits a user to create a query by specifying values or ranges of values for each of a number of item attributes.
- FIGS. 16-20 show sample displays presented as part of the user interface.
- FIG. 16 is a display diagram showing an initial display of the user interface presented by the facility.
- the display 1600 corresponds to a search query and its result.
- a map 1620 has been generated for inclusion in the display based upon the user having entered the address for a home shown near the center of the map in fields 1601 and 1602 , then activating button 1603 .
- the facility displayed the map 1620 that is shown, centered on the home in question at an intermediate zoom level.
- the borders of the map have established a geographic criterion for the search.
- the current search result is a list 1650 (only partially shown here) of all the homes that are located within the present borders of the map.
- the user can navigate to different pages of the query result using controls 1604 and 1605 .
- the user may alter the geographic query criterion by navigating the map, such as by scrolling the map in a direction using control 1621 , or by changing its zoom level using zoom control 1622 .
- the facility updates the geographic query criterion to include the present boundaries of the map, and executes the updated query to generate a new search result that includes the homes within the new boundaries.
- the user may also specify relational criteria for the search query using panel 1610 , which is discussed in greater detail below in connection with FIGS. 17-20 .
- the facility includes in the query specification user interface it presents a mechanism usable by the user to specify a textual criteria for the query, such as a text field.
- FIG. 17 is a display diagram that shows panel 1610 , which is usable by the user to specify relational criteria for the query, in greater detail as panel 1710 .
- Panel 1710 includes indications 1711 - 1714 of a number of different home statuses.
- the for sale status 1711 is active for any home that is known to be presently for sale.
- the checkbox at the left end of the indication indicates that homes having this status are included in the search result.
- the parenthetical number at the right end of indication 1711 indicates that eight of the homes presently in the search result have this status.
- Panel 1710 further has a number of subpanels 1720 , 1730 , 1740 , 1750 , 1760 , 1770 , and 1780 each corresponding to a different relational attribute, which are each shown here in collapsed form.
- the user can expand it in order to specify additional relational criteria.
- the user may select control 1721 in order to specify a relational criterion for the query that is based upon the price attribute.
- FIG. 18 is a display diagram showing an expanded version of the price attribute subpanel in the facility when the user selects control 1721 .
- the expanded price attribute subpanel 1880 lists a number of subranges of the price attribute that may be selected by the user in order to specify a query criterion for the price attribute.
- a first indication 1881 may be selected by the user to collapse subpanel 1880 without specifying a subrange of the price attribute for inclusion in the query.
- the user may select any of indications 1882 - 1884 in order to specify a query criterion for the displayed range. For example, the user may select indication 1884 in order to add to the query a criterion requiring a price attribute to be between $300 k and $400 k.
- the parenthetical at the right end of this indication indicates that, among the homes contained in the current query result, six of them fall into this range and would satisfy such a criterion.
- the user may also enter a custom range into fields 1885 and 1886 , and select control 1887 in order to create a query criterion for the custom range.
- FIG. 19 is a display diagram that shows panel 1910 after the user has selected indication 1884 in FIG. 18 .
- the facility has updated the counts displayed for each of statuses 1911 - 1913 shown in the panel to reflect the number of homes having these statuses in the query result for the updated query containing the price criterion specified by the user in selecting indication 1884 .
- collapsed price subpanel 1920 now contains an indication that this attribute has been constrained to the specified range. The user may go on to specify additional criteria, or select the clear all filters control 1991 to delete the existing relational criterion from the query.
- FIG. 20 shows a sample display presented by the facility when the user goes on to select control 1951 to expand the collapsed size subpanel 1950 .
- the expanded subpanel 2050 contains ranges for the size attribute and an indication for each range of the number of homes in the current query result that fall into each subrange. For example, indication 2053 shows that two homes in the current search result have a size attribute value between two thousand and three thousand square feet.
- the user may make a selection in expanded size panel 2050 to add to the query another relational criterion specifying a particular subrange for the size attribute.
- FIG. 21 is a flow diagram that shows steps typically performed by the facility in order to present the query specification user interface described above.
- the facility receives the specification of an attribute value or range from the user, such as is described above in connection with FIGS. 16 , 18 , and 20 .
- the facility performs a query that includes any attribute values and ranges specified by the user.
- the facility identifies attributes that are or can be displayed for which the user has specified no value or range.
- the facility establishes counters for values or ranges of identified attributes.
- FIG. 22 is a flow diagram showing additional details of step 2104 .
- steps 2201 - 2206 the facility loops through each attribute identified in step 2103 .
- step 2202 if the values for this attribute are enumerated (e.g., yes/no, or condominium/single family), then the facility continues in step 2203 , else (e.g., for price, size, etc., attributes), the facility continues in step 2204 .
- step 2203 the facility establishes a counter for each enumerated value of the attribute. After step 2203 , the facility continues in step 2206 .
- step 2204 the facility divides the range of possible values for the attribute into a large number of subranges, also called “bins.” As one example, the facility may establish 101 subranges for the price attribute: 100 $20,000-wide subranges between zero and $2,000,000, and a subrange over $2,000,000.
- step 2205 the facility establishes a counter for each bin established in step 2204 .
- step 2206 if additional identified attributes remain to be processed, then the facility continues in step 2201 to process the next identified attribute, else the facility returns.
- step 2105 in a single pass through the query result generated in step 2102 , the facility updates all of the counters established in step 2104 .
- step 2106 the facility consolidates attribute value bins and their counters in order to be able to display a reasonable number of subranges.
- FIG. 23 is a flow diagram showing details of step 2106 .
- the facility loops through each attribute identified in step 2103 .
- step 2302 if the values for this attribute are enumerated, then the facility continues in 2304 , else the facility continues in step 2303 .
- step 2303 the facility consolidates the bins established for the attribute for a smaller number of bins, each containing a similar number of items. For example, from the 101 bins established for the price attribute, the facility may form four consolidated bins, each containing approximately one quartile of the homes counted among all 101 original bins.
- step 2304 if additional identified attributes remain to be processed then the facility continues in step 2301 to process the next identified attribute, else the facility returns.
- step 2107 the facility displays the values and ranges for the identified attributes and their counters as shown in FIGS. 19 and 20 .
- the above-described facility may be straightforwardly adapted or extended in various ways.
- the facility may use a variety of approaches to determine which summarization level to use for a particular request.
- the facility may use any of a large number of techniques to summarize multiple data points that are present within a region.
- data points may be of virtually any type, so long as each is associated with a particular geographic location.
Abstract
Description
| TABLE 1 | |||
| Zoom | Summarization Level | ||
| 1 | | ||
| 2 | | ||
| 3 | state/ | ||
| 4 | | ||
| 5 | | ||
| 6 | county | ||
| 7 | | ||
| 8 | county | ||
| 9 | | ||
| 10 | | ||
| 11 | | ||
| 12 | neighborhood | ||
| 13 | | ||
| 14 | | ||
| 15 | home/building | ||
| 16 | home/building | ||
| 17 | home/ | ||
| 18 | home/building | ||
For example, at
| TABLE 2 | |||||
| Summarization | Preference | Optimal | Distance | ||
| Level | Score | | Weight | ||
| continent |
| 1 | 5 | 20 | ||
| |
2 | 4 | 8 | |
| |
4 | 5 | 5 | |
| |
6 | 6 | 2 | |
| |
10 | 4 | 2 | |
| neighborhood | 16 | 9 | 2 | |
| TABLE 3 | |||
| home id: | 20 | ||
| address: | 1539 NW 58th St, Seattle, |
||
| location: | 47.670820, −122.376557 | ||
| make me move: | No | ||
| for sale: | No | ||
| recently sold: | No | ||
| price: | $448,310 | ||
| bedrooms: | 3 | ||
| |
1 | ||
| size: | 1,370 sq. ft. | ||
| lot: | 6,453 sq. ft. | ||
| type: | single family | ||
| sale date: | Oct. 10, 1999 | ||
| description: | Cozy bungalow on quiet street. | ||
| You'll love how the afternoon | |||
| sun filters into the back yard. | |||
| TABLE 4 | |
| Text criterion: | “cozy” |
| Geographic criteria: | latitude between 47.670750 and 47.671150; |
| longitude between −122.376575 and −122.376490 | |
| Relational criterion: | Price between $300K and $400K |
Claims (17)
Priority Applications (1)
| Application Number | Priority Date | Filing Date | Title |
|---|---|---|---|
| US12/031,436 US8095434B1 (en) | 2007-12-17 | 2008-02-14 | Automatically performing varying levels of summarization of geographic data points in response to a user's selection of zoom level |
Applications Claiming Priority (2)
| Application Number | Priority Date | Filing Date | Title |
|---|---|---|---|
| US1434607P | 2007-12-17 | 2007-12-17 | |
| US12/031,436 US8095434B1 (en) | 2007-12-17 | 2008-02-14 | Automatically performing varying levels of summarization of geographic data points in response to a user's selection of zoom level |
Publications (1)
| Publication Number | Publication Date |
|---|---|
| US8095434B1 true US8095434B1 (en) | 2012-01-10 |
Family
ID=45419204
Family Applications (1)
| Application Number | Title | Priority Date | Filing Date |
|---|---|---|---|
| US12/031,436 Active 2029-03-28 US8095434B1 (en) | 2007-12-17 | 2008-02-14 | Automatically performing varying levels of summarization of geographic data points in response to a user's selection of zoom level |
Country Status (1)
| Country | Link |
|---|---|
| US (1) | US8095434B1 (en) |
Cited By (65)
| Publication number | Priority date | Publication date | Assignee | Title |
|---|---|---|---|---|
| US20070013708A1 (en) * | 2005-07-14 | 2007-01-18 | Bob Barcklay | Tiled map display on a wireless device |
| US20090098889A1 (en) * | 2007-09-11 | 2009-04-16 | Bob Barcklay | Wireless device location alerts on battery notification events |
| US20090144247A1 (en) * | 2007-11-09 | 2009-06-04 | Eric Wistrand | Point-of-interest panning on a displayed map with a persistent search on a wireless phone using persistent point-of-interest criterion |
| US20090265340A1 (en) * | 2008-04-07 | 2009-10-22 | Bob Barcklay | Proximity search for point-of-interest names combining inexact string match with an expanding radius search |
| US20100031196A1 (en) * | 2008-07-30 | 2010-02-04 | Autodesk, Inc. | Method and apparatus for selecting and highlighting objects in a client browser |
| US20100087167A1 (en) * | 2008-10-06 | 2010-04-08 | Kevin Tsurutome | Remotely provisioned wirelessly proxy |
| US20100088018A1 (en) * | 2008-10-08 | 2010-04-08 | Kevin Tsurutome | Glance ahead navigation |
| US20100088020A1 (en) * | 2008-10-07 | 2010-04-08 | Darrell Sano | User interface for predictive traffic |
| US20100087207A1 (en) * | 2008-10-07 | 2010-04-08 | Kevin Tsurutome | User interface for content channel hud (heads-up display) and channel sets for location-based maps |
| US20100094550A1 (en) * | 2008-10-07 | 2010-04-15 | Kevin Tsurutome | User interface for dynamic user-defined stopovers during guided naviation ('side trips") |
| US20120011471A1 (en) * | 1998-09-18 | 2012-01-12 | Vepse Technology Co., L.L.C. | Real estate value map computer system |
| US20120110513A1 (en) * | 2010-10-28 | 2012-05-03 | Sap Ag | Aggregating based on hierarchy and scaling input |
| US20120144325A1 (en) * | 2010-12-01 | 2012-06-07 | Microsoft Corporation | Proposing visual display components for processing data |
| CN102760160A (en) * | 2012-06-08 | 2012-10-31 | 湘潭市勘测设计院 | System for downsizing multi-scale geographic map in spatial information database |
| US20130051672A1 (en) * | 2011-08-26 | 2013-02-28 | Skybox Imaging, Inc. | Adaptive Image Acquisition and Processing with Image Analysis Feedback |
| US8521422B2 (en) | 2007-11-14 | 2013-08-27 | Telecommunication Systems, Inc. | Stateful, double-buffered dynamic navigation voice prompting |
| CN103377273A (en) * | 2012-04-13 | 2013-10-30 | 陈桂荣 | Code based indexing and information retrieval system |
| US8584013B1 (en) * | 2007-03-20 | 2013-11-12 | Google Inc. | Temporal layers for presenting personalization markers on imagery |
| US20140047381A1 (en) * | 2012-08-10 | 2014-02-13 | Microsoft Corporation | 3d data environment navigation tool |
| US20140229336A1 (en) * | 2013-02-13 | 2014-08-14 | Discover Home Network, Inc. | Method and Apparatus for Apartment Listings |
| US8838379B2 (en) | 2008-10-06 | 2014-09-16 | Telecommunication Systems, Inc. | Probalistic reverse geocoding |
| US20140267433A1 (en) * | 2013-03-15 | 2014-09-18 | Yahoo! Inc. | Visualizing regions charcaterized by labeled measurements cross-reference to related applications |
| US8862710B2 (en) | 2007-09-11 | 2014-10-14 | Telecommunication Systems, Inc. | Dynamic configuration of mobile station location services |
| US20140340416A1 (en) * | 2013-05-15 | 2014-11-20 | Google Inc. | Water color gradients on a digital map |
| WO2015013814A1 (en) * | 2013-08-02 | 2015-02-05 | Zag Holdings Inc. | Systems and methods for presenting summary information associated with map elements |
| US20150128089A1 (en) * | 2013-11-01 | 2015-05-07 | Google Inc. | Scale Sensitive Treatment of Features in a Geographic Information System |
| US20150170301A1 (en) * | 2013-12-13 | 2015-06-18 | Buyer Hero, Llc | Computerized system and method for real estate searches and procurement |
| US20150310292A1 (en) * | 2014-04-29 | 2015-10-29 | Targeteam Services and IT GmbH | Method for displaying and updating of documents displayed on a user interface |
| US20150339320A1 (en) * | 2014-05-20 | 2015-11-26 | Vesmir Inc. | Pattern-retaining Method for Displaying Large Volumes of Geographic Based Data Using Statistical Depopulation |
| US9275073B2 (en) | 2006-08-21 | 2016-03-01 | Telecommunication Systems, Inc. | Associating metro street address guide (MSAG) validated addresses with geographic map data |
| US9424305B1 (en) | 2006-12-06 | 2016-08-23 | Zillow, Inc. | Multi-faceted search |
| US20160274781A1 (en) * | 2015-03-16 | 2016-09-22 | Palantir Technologies Inc. | Interactive user interfaces for location-based data analysis |
| US9605704B1 (en) | 2008-01-09 | 2017-03-28 | Zillow, Inc. | Automatically determining a current value for a home |
| US20170277364A1 (en) * | 2016-03-22 | 2017-09-28 | Amazon Technologies, Inc. | User interface with dynamic refinement of filtered results |
| WO2018005542A1 (en) | 2016-06-27 | 2018-01-04 | Omniearth, Inc. | Systems and methods for utilizing property features from images |
| US20180025448A1 (en) * | 2012-06-08 | 2018-01-25 | Benutech, Inc. | Real estate systems and methods for providing tract data |
| US9934490B2 (en) | 2015-12-29 | 2018-04-03 | Setschedule Ip Holdings, Llc | System and method for transacting lead and scheduled appointment records |
| US9953445B2 (en) | 2013-05-07 | 2018-04-24 | Palantir Technologies Inc. | Interactive data object map |
| US20180130152A1 (en) * | 2016-11-10 | 2018-05-10 | Fannie Mae | Property characteristics filtering to automatically update sub-markets for a subject property |
| WO2018152348A1 (en) * | 2017-02-15 | 2018-08-23 | Mastery Transcript Consortium | Transforming disparate data types into a holistic format for rendering at varying granularity levels |
| US10074111B2 (en) | 2006-02-03 | 2018-09-11 | Zillow, Inc. | Automatically determining a current value for a home |
| US20180276242A1 (en) * | 2014-12-04 | 2018-09-27 | Google Llc | System and Method For Efficient Geospatial Indexing |
| US10198735B1 (en) | 2011-03-09 | 2019-02-05 | Zillow, Inc. | Automatically determining market rental rate index for properties |
| US10229655B2 (en) | 2015-02-28 | 2019-03-12 | Microsoft Technology Licensing, Llc | Contextual zoom |
| US10255296B2 (en) | 2016-02-25 | 2019-04-09 | Omniearth, Inc. | System and method for managing geodemographic data |
| US10380653B1 (en) | 2010-09-16 | 2019-08-13 | Trulia, Llc | Valuation system |
| US10378918B2 (en) | 2017-01-03 | 2019-08-13 | Microsoft Technology Licensing, Llc | Generating routes from lines based on zoom levels |
| US10444940B2 (en) | 2015-08-17 | 2019-10-15 | Palantir Technologies Inc. | Interactive geospatial map |
| US10460406B1 (en) | 2011-03-09 | 2019-10-29 | Zillow, Inc. | Automatically determining market rental rates for properties |
| US10572496B1 (en) * | 2014-07-03 | 2020-02-25 | Palantir Technologies Inc. | Distributed workflow system and database with access controls for city resiliency |
| US10643232B1 (en) | 2015-03-18 | 2020-05-05 | Zillow, Inc. | Allocating electronic advertising opportunities |
| US10706434B1 (en) | 2015-09-01 | 2020-07-07 | Palantir Technologies Inc. | Methods and systems for determining location information |
| US10754884B1 (en) * | 2013-11-12 | 2020-08-25 | Zillow, Inc. | Flexible real estate search |
| US10789549B1 (en) | 2016-02-25 | 2020-09-29 | Zillow, Inc. | Enforcing, with respect to changes in one or more distinguished independent variable values, monotonicity in the predictions produced by a statistical model |
| US10873603B2 (en) | 2014-02-20 | 2020-12-22 | Palantir Technologies Inc. | Cyber security sharing and identification system |
| US10896449B2 (en) | 2006-02-03 | 2021-01-19 | Zillow, Inc. | Automatically determining a current value for a real estate property, such as a home, that is tailored to input from a human user, such as its owner |
| US10943149B2 (en) | 2017-08-31 | 2021-03-09 | Omniearth, Inc. | Systems and methods for automatic estimation of object characteristics from digital images |
| US10984489B1 (en) | 2014-02-13 | 2021-04-20 | Zillow, Inc. | Estimating the value of a property in a manner sensitive to nearby value-affecting geographic features |
| CN112860831A (en) * | 2021-01-29 | 2021-05-28 | 城云科技(中国)有限公司 | Method and system for processing and displaying GIS point locations of urban management events |
| US11093982B1 (en) | 2014-10-02 | 2021-08-17 | Zillow, Inc. | Determine regional rate of return on home improvements |
| US11182839B2 (en) * | 2012-12-06 | 2021-11-23 | Unison Holdings Llc | System and method for uploading video files to a real estate listing and for reporting interest level in a real estate listing |
| CN114153363A (en) * | 2021-12-02 | 2022-03-08 | 网易(杭州)网络有限公司 | Map display control method and device and electronic equipment |
| US11315202B2 (en) | 2006-09-19 | 2022-04-26 | Zillow, Inc. | Collecting and representing home attributes |
| US11682052B2 (en) | 2019-10-15 | 2023-06-20 | Orchard Technologies, Inc. | Machine learning systems and methods for determining home value |
| US11861748B1 (en) * | 2019-06-28 | 2024-01-02 | MFTB Holdco, Inc. | Valuation of homes using geographic regions of varying granularity |
Citations (9)
| Publication number | Priority date | Publication date | Assignee | Title |
|---|---|---|---|---|
| US20030101063A1 (en) * | 2001-09-28 | 2003-05-29 | Sexton Ashley K. | Real estate information system |
| US6778193B2 (en) | 2001-02-07 | 2004-08-17 | International Business Machines Corporation | Customer self service iconic interface for portal entry and search specification |
| US20050288959A1 (en) | 2004-06-16 | 2005-12-29 | David Eraker | Map-based search for real estate service providers |
| US20050288957A1 (en) | 2004-06-16 | 2005-12-29 | David Eraker | Web-based real estate mapping system |
| US20060095345A1 (en) | 2004-10-28 | 2006-05-04 | Microsoft Corporation | System and method for an online catalog system having integrated search and browse capability |
| US20060271280A1 (en) * | 2005-05-27 | 2006-11-30 | O'clair Brian | Using boundaries associated with a map view for business location searching |
| US7237187B2 (en) | 2002-01-31 | 2007-06-26 | Requisite Technology, Inc. | Interactively comparing records in a database |
| US20080086451A1 (en) | 2006-10-05 | 2008-04-10 | Torres Robert J | System and Method to Provide Custom Constraints for Faceted Exploration |
| US7734566B2 (en) | 2004-11-01 | 2010-06-08 | Sap Ag | Information retrieval method with efficient similarity search capability |
-
2008
- 2008-02-14 US US12/031,436 patent/US8095434B1/en active Active
Patent Citations (9)
| Publication number | Priority date | Publication date | Assignee | Title |
|---|---|---|---|---|
| US6778193B2 (en) | 2001-02-07 | 2004-08-17 | International Business Machines Corporation | Customer self service iconic interface for portal entry and search specification |
| US20030101063A1 (en) * | 2001-09-28 | 2003-05-29 | Sexton Ashley K. | Real estate information system |
| US7237187B2 (en) | 2002-01-31 | 2007-06-26 | Requisite Technology, Inc. | Interactively comparing records in a database |
| US20050288959A1 (en) | 2004-06-16 | 2005-12-29 | David Eraker | Map-based search for real estate service providers |
| US20050288957A1 (en) | 2004-06-16 | 2005-12-29 | David Eraker | Web-based real estate mapping system |
| US20060095345A1 (en) | 2004-10-28 | 2006-05-04 | Microsoft Corporation | System and method for an online catalog system having integrated search and browse capability |
| US7734566B2 (en) | 2004-11-01 | 2010-06-08 | Sap Ag | Information retrieval method with efficient similarity search capability |
| US20060271280A1 (en) * | 2005-05-27 | 2006-11-30 | O'clair Brian | Using boundaries associated with a map view for business location searching |
| US20080086451A1 (en) | 2006-10-05 | 2008-04-10 | Torres Robert J | System and Method to Provide Custom Constraints for Faceted Exploration |
Non-Patent Citations (2)
| Title |
|---|
| HouseFront Offers Real Estate Property Info Via Cell Phone. Wireless News Jul. 18, 2007. * |
| Non-Final Office Action for U.S. Appl. No. 11/943,695, Mail Date Jun. 17, 2011, 14 pages. |
Cited By (119)
| Publication number | Priority date | Publication date | Assignee | Title |
|---|---|---|---|---|
| US20120011471A1 (en) * | 1998-09-18 | 2012-01-12 | Vepse Technology Co., L.L.C. | Real estate value map computer system |
| US20070013708A1 (en) * | 2005-07-14 | 2007-01-18 | Bob Barcklay | Tiled map display on a wireless device |
| US9367566B2 (en) | 2005-07-14 | 2016-06-14 | Telecommunication Systems, Inc. | Tiled map display on a wireless device |
| US9041744B2 (en) | 2005-07-14 | 2015-05-26 | Telecommunication Systems, Inc. | Tiled map display on a wireless device |
| US10896449B2 (en) | 2006-02-03 | 2021-01-19 | Zillow, Inc. | Automatically determining a current value for a real estate property, such as a home, that is tailored to input from a human user, such as its owner |
| US10074111B2 (en) | 2006-02-03 | 2018-09-11 | Zillow, Inc. | Automatically determining a current value for a home |
| US11769181B2 (en) | 2006-02-03 | 2023-09-26 | Mftb Holdco. Inc. | Automatically determining a current value for a home |
| US11244361B2 (en) | 2006-02-03 | 2022-02-08 | Zillow, Inc. | Automatically determining a current value for a home |
| US9275073B2 (en) | 2006-08-21 | 2016-03-01 | Telecommunication Systems, Inc. | Associating metro street address guide (MSAG) validated addresses with geographic map data |
| US11315202B2 (en) | 2006-09-19 | 2022-04-26 | Zillow, Inc. | Collecting and representing home attributes |
| US10521191B1 (en) | 2006-12-06 | 2019-12-31 | Zillow, Inc. | Multi-faceted search |
| US9424305B1 (en) | 2006-12-06 | 2016-08-23 | Zillow, Inc. | Multi-faceted search |
| US10585920B2 (en) | 2007-03-20 | 2020-03-10 | Google Llc | Temporal layers for presenting personalization markers on imagery |
| US8584013B1 (en) * | 2007-03-20 | 2013-11-12 | Google Inc. | Temporal layers for presenting personalization markers on imagery |
| US11636138B1 (en) | 2007-03-20 | 2023-04-25 | Google Llc | Temporal layers for presenting personalization markers on imagery |
| US8862710B2 (en) | 2007-09-11 | 2014-10-14 | Telecommunication Systems, Inc. | Dynamic configuration of mobile station location services |
| US20090098889A1 (en) * | 2007-09-11 | 2009-04-16 | Bob Barcklay | Wireless device location alerts on battery notification events |
| US9554245B2 (en) | 2007-09-11 | 2017-01-24 | Telecommunication Systems, Inc. | Dynamic configuration of mobile station location services |
| US20090144247A1 (en) * | 2007-11-09 | 2009-06-04 | Eric Wistrand | Point-of-interest panning on a displayed map with a persistent search on a wireless phone using persistent point-of-interest criterion |
| US8521422B2 (en) | 2007-11-14 | 2013-08-27 | Telecommunication Systems, Inc. | Stateful, double-buffered dynamic navigation voice prompting |
| US9605704B1 (en) | 2008-01-09 | 2017-03-28 | Zillow, Inc. | Automatically determining a current value for a home |
| US11449958B1 (en) | 2008-01-09 | 2022-09-20 | Zillow, Inc. | Automatically determining a current value for a home |
| US20090265340A1 (en) * | 2008-04-07 | 2009-10-22 | Bob Barcklay | Proximity search for point-of-interest names combining inexact string match with an expanding radius search |
| US8407619B2 (en) * | 2008-07-30 | 2013-03-26 | Autodesk, Inc. | Method and apparatus for selecting and highlighting objects in a client browser |
| US20100031196A1 (en) * | 2008-07-30 | 2010-02-04 | Autodesk, Inc. | Method and apparatus for selecting and highlighting objects in a client browser |
| US9420398B2 (en) | 2008-10-06 | 2016-08-16 | Telecommunication Systems, Inc. | Remotely provisioned wireless proxy |
| US8594627B2 (en) | 2008-10-06 | 2013-11-26 | Telecommunications Systems, Inc. | Remotely provisioned wirelessly proxy |
| US8838379B2 (en) | 2008-10-06 | 2014-09-16 | Telecommunication Systems, Inc. | Probalistic reverse geocoding |
| US20100087167A1 (en) * | 2008-10-06 | 2010-04-08 | Kevin Tsurutome | Remotely provisioned wirelessly proxy |
| US9400182B2 (en) | 2008-10-06 | 2016-07-26 | Telecommunication Systems, Inc. | Probabilistic reverse geocoding |
| US8712408B2 (en) | 2008-10-06 | 2014-04-29 | Telecommunication Systems, Inc. | Remotely provisioned wireless proxy |
| US20160169693A1 (en) * | 2008-10-06 | 2016-06-16 | Telecommunication Systems, Inc. | Probabilistic Reverse Geocoding |
| US20100094550A1 (en) * | 2008-10-07 | 2010-04-15 | Kevin Tsurutome | User interface for dynamic user-defined stopovers during guided naviation ('side trips") |
| US9372091B2 (en) | 2008-10-07 | 2016-06-21 | Telecommunication Systems, Inc. | User interface for predictive traffic |
| US20100087207A1 (en) * | 2008-10-07 | 2010-04-08 | Kevin Tsurutome | User interface for content channel hud (heads-up display) and channel sets for location-based maps |
| US9200913B2 (en) | 2008-10-07 | 2015-12-01 | Telecommunication Systems, Inc. | User interface for predictive traffic |
| US20100088020A1 (en) * | 2008-10-07 | 2010-04-08 | Darrell Sano | User interface for predictive traffic |
| US9285239B2 (en) | 2008-10-07 | 2016-03-15 | Telecommunication Systems, Inc. | User interface for content channel HUD (heads-up display) and channel sets for location-based maps |
| US20100088018A1 (en) * | 2008-10-08 | 2010-04-08 | Kevin Tsurutome | Glance ahead navigation |
| US10380653B1 (en) | 2010-09-16 | 2019-08-13 | Trulia, Llc | Valuation system |
| US11727449B2 (en) | 2010-09-16 | 2023-08-15 | MFTB Holdco, Inc. | Valuation system |
| US9141641B2 (en) * | 2010-10-28 | 2015-09-22 | Sap Se | Aggregating based on hierarchy and scaling input |
| US20120110513A1 (en) * | 2010-10-28 | 2012-05-03 | Sap Ag | Aggregating based on hierarchy and scaling input |
| US9032314B2 (en) * | 2010-12-01 | 2015-05-12 | Microsoft Technology Licensing, Llc | Proposing visual display components for processing data |
| US20120144325A1 (en) * | 2010-12-01 | 2012-06-07 | Microsoft Corporation | Proposing visual display components for processing data |
| US11068911B1 (en) | 2011-03-09 | 2021-07-20 | Zillow, Inc. | Automatically determining market rental rate index for properties |
| US11288756B1 (en) | 2011-03-09 | 2022-03-29 | Zillow, Inc. | Automatically determining market rental rates for properties |
| US10460406B1 (en) | 2011-03-09 | 2019-10-29 | Zillow, Inc. | Automatically determining market rental rates for properties |
| US10198735B1 (en) | 2011-03-09 | 2019-02-05 | Zillow, Inc. | Automatically determining market rental rate index for properties |
| US20130051672A1 (en) * | 2011-08-26 | 2013-02-28 | Skybox Imaging, Inc. | Adaptive Image Acquisition and Processing with Image Analysis Feedback |
| US9105128B2 (en) * | 2011-08-26 | 2015-08-11 | Skybox Imaging, Inc. | Adaptive image acquisition and processing with image analysis feedback |
| CN103377273A (en) * | 2012-04-13 | 2013-10-30 | 陈桂荣 | Code based indexing and information retrieval system |
| CN102760160B (en) * | 2012-06-08 | 2015-03-11 | 张必胜 | System for downsizing multi-scale geographic map in spatial information database |
| CN102760160A (en) * | 2012-06-08 | 2012-10-31 | 湘潭市勘测设计院 | System for downsizing multi-scale geographic map in spatial information database |
| US20180025448A1 (en) * | 2012-06-08 | 2018-01-25 | Benutech, Inc. | Real estate systems and methods for providing tract data |
| US9881396B2 (en) | 2012-08-10 | 2018-01-30 | Microsoft Technology Licensing, Llc | Displaying temporal information in a spreadsheet application |
| US9996953B2 (en) | 2012-08-10 | 2018-06-12 | Microsoft Technology Licensing, Llc | Three-dimensional annotation facing |
| US20140047381A1 (en) * | 2012-08-10 | 2014-02-13 | Microsoft Corporation | 3d data environment navigation tool |
| US9317963B2 (en) | 2012-08-10 | 2016-04-19 | Microsoft Technology Licensing, Llc | Generating scenes and tours in a spreadsheet application |
| US10008015B2 (en) | 2012-08-10 | 2018-06-26 | Microsoft Technology Licensing, Llc | Generating scenes and tours in a spreadsheet application |
| US11182839B2 (en) * | 2012-12-06 | 2021-11-23 | Unison Holdings Llc | System and method for uploading video files to a real estate listing and for reporting interest level in a real estate listing |
| US10643263B2 (en) * | 2013-02-13 | 2020-05-05 | Rentpath, Llc | Method and apparatus for apartment listings |
| US11301914B2 (en) * | 2013-02-13 | 2022-04-12 | Rentpath Holdings, Inc. | Method and apparatus for apartment listings |
| US20140229336A1 (en) * | 2013-02-13 | 2014-08-14 | Discover Home Network, Inc. | Method and Apparatus for Apartment Listings |
| US9269125B2 (en) * | 2013-03-15 | 2016-02-23 | Yahoo! Inc. | Visualizing regions characterized by labeled measurements |
| US20140267433A1 (en) * | 2013-03-15 | 2014-09-18 | Yahoo! Inc. | Visualizing regions charcaterized by labeled measurements cross-reference to related applications |
| US9953445B2 (en) | 2013-05-07 | 2018-04-24 | Palantir Technologies Inc. | Interactive data object map |
| US10360705B2 (en) | 2013-05-07 | 2019-07-23 | Palantir Technologies Inc. | Interactive data object map |
| US20140340416A1 (en) * | 2013-05-15 | 2014-11-20 | Google Inc. | Water color gradients on a digital map |
| US9471959B2 (en) * | 2013-05-15 | 2016-10-18 | Google Inc. | Water color gradients on a digital map |
| CN105474301A (en) * | 2013-08-02 | 2016-04-06 | Zag控股公司 | Systems and methods for presenting summary information associated with map elements |
| WO2015013814A1 (en) * | 2013-08-02 | 2015-02-05 | Zag Holdings Inc. | Systems and methods for presenting summary information associated with map elements |
| US20160170620A1 (en) * | 2013-08-02 | 2016-06-16 | Zag Holdings Inc. | Systems and methods for presenting summary information associated with map elements |
| US20150128089A1 (en) * | 2013-11-01 | 2015-05-07 | Google Inc. | Scale Sensitive Treatment of Features in a Geographic Information System |
| US9804748B2 (en) * | 2013-11-01 | 2017-10-31 | Google Inc. | Scale sensitive treatment of features in a geographic information system |
| US10754884B1 (en) * | 2013-11-12 | 2020-08-25 | Zillow, Inc. | Flexible real estate search |
| US11232142B2 (en) | 2013-11-12 | 2022-01-25 | Zillow, Inc. | Flexible real estate search |
| US10019767B2 (en) * | 2013-12-13 | 2018-07-10 | Buyer Hero, Llc | Computerized system and method for real estate searches and procurement |
| US20150170301A1 (en) * | 2013-12-13 | 2015-06-18 | Buyer Hero, Llc | Computerized system and method for real estate searches and procurement |
| US10984489B1 (en) | 2014-02-13 | 2021-04-20 | Zillow, Inc. | Estimating the value of a property in a manner sensitive to nearby value-affecting geographic features |
| US10873603B2 (en) | 2014-02-20 | 2020-12-22 | Palantir Technologies Inc. | Cyber security sharing and identification system |
| US20150310292A1 (en) * | 2014-04-29 | 2015-10-29 | Targeteam Services and IT GmbH | Method for displaying and updating of documents displayed on a user interface |
| US9594773B2 (en) * | 2014-05-20 | 2017-03-14 | Vesmir, Inc. | Pattern-retaining method for displaying large volumes of geographic based data using statistical depopulation |
| US20150339320A1 (en) * | 2014-05-20 | 2015-11-26 | Vesmir Inc. | Pattern-retaining Method for Displaying Large Volumes of Geographic Based Data Using Statistical Depopulation |
| US10572496B1 (en) * | 2014-07-03 | 2020-02-25 | Palantir Technologies Inc. | Distributed workflow system and database with access controls for city resiliency |
| US11093982B1 (en) | 2014-10-02 | 2021-08-17 | Zillow, Inc. | Determine regional rate of return on home improvements |
| US10838988B2 (en) * | 2014-12-04 | 2020-11-17 | Google Llc | System and method for efficient geospatial indexing |
| US20180276242A1 (en) * | 2014-12-04 | 2018-09-27 | Google Llc | System and Method For Efficient Geospatial Indexing |
| US10229655B2 (en) | 2015-02-28 | 2019-03-12 | Microsoft Technology Licensing, Llc | Contextual zoom |
| US20160274781A1 (en) * | 2015-03-16 | 2016-09-22 | Palantir Technologies Inc. | Interactive user interfaces for location-based data analysis |
| US9891808B2 (en) * | 2015-03-16 | 2018-02-13 | Palantir Technologies Inc. | Interactive user interfaces for location-based data analysis |
| US10459619B2 (en) | 2015-03-16 | 2019-10-29 | Palantir Technologies Inc. | Interactive user interfaces for location-based data analysis |
| US10643232B1 (en) | 2015-03-18 | 2020-05-05 | Zillow, Inc. | Allocating electronic advertising opportunities |
| US11354701B1 (en) | 2015-03-18 | 2022-06-07 | Zillow, Inc. | Allocating electronic advertising opportunities |
| US10444940B2 (en) | 2015-08-17 | 2019-10-15 | Palantir Technologies Inc. | Interactive geospatial map |
| US10444941B2 (en) | 2015-08-17 | 2019-10-15 | Palantir Technologies Inc. | Interactive geospatial map |
| US10706434B1 (en) | 2015-09-01 | 2020-07-07 | Palantir Technologies Inc. | Methods and systems for determining location information |
| US10650354B2 (en) | 2015-12-29 | 2020-05-12 | Setschedule Ip Holdings, Llc | System and method for transacting lead and scheduled appointment records |
| US9934490B2 (en) | 2015-12-29 | 2018-04-03 | Setschedule Ip Holdings, Llc | System and method for transacting lead and scheduled appointment records |
| US10789549B1 (en) | 2016-02-25 | 2020-09-29 | Zillow, Inc. | Enforcing, with respect to changes in one or more distinguished independent variable values, monotonicity in the predictions produced by a statistical model |
| US11886962B1 (en) | 2016-02-25 | 2024-01-30 | MFTB Holdco, Inc. | Enforcing, with respect to changes in one or more distinguished independent variable values, monotonicity in the predictions produced by a statistical model |
| US10733229B2 (en) | 2016-02-25 | 2020-08-04 | Omniearth, Inc. | Image analysis of multiband images of geographic regions |
| US10255296B2 (en) | 2016-02-25 | 2019-04-09 | Omniearth, Inc. | System and method for managing geodemographic data |
| US11392635B2 (en) | 2016-02-25 | 2022-07-19 | Omniearth, Inc. | Image analysis of multiband images of geographic regions |
| US20170277364A1 (en) * | 2016-03-22 | 2017-09-28 | Amazon Technologies, Inc. | User interface with dynamic refinement of filtered results |
| US11782959B2 (en) | 2016-06-27 | 2023-10-10 | Omniearth, Inc. | Systems and methods for utilizing property features from images |
| US11392625B2 (en) | 2016-06-27 | 2022-07-19 | Omniearth, Inc. | Systems and methods for utilizing property features from images |
| WO2018005542A1 (en) | 2016-06-27 | 2018-01-04 | Omniearth, Inc. | Systems and methods for utilizing property features from images |
| US20180130152A1 (en) * | 2016-11-10 | 2018-05-10 | Fannie Mae | Property characteristics filtering to automatically update sub-markets for a subject property |
| US10378918B2 (en) | 2017-01-03 | 2019-08-13 | Microsoft Technology Licensing, Llc | Generating routes from lines based on zoom levels |
| WO2018152348A1 (en) * | 2017-02-15 | 2018-08-23 | Mastery Transcript Consortium | Transforming disparate data types into a holistic format for rendering at varying granularity levels |
| US10943149B2 (en) | 2017-08-31 | 2021-03-09 | Omniearth, Inc. | Systems and methods for automatic estimation of object characteristics from digital images |
| US11734560B2 (en) | 2017-08-31 | 2023-08-22 | Omniearth, Inc. | Systems and methods for automatic estimation of object characteristics from digital images |
| US11861748B1 (en) * | 2019-06-28 | 2024-01-02 | MFTB Holdco, Inc. | Valuation of homes using geographic regions of varying granularity |
| US11682052B2 (en) | 2019-10-15 | 2023-06-20 | Orchard Technologies, Inc. | Machine learning systems and methods for determining home value |
| US11769180B2 (en) | 2019-10-15 | 2023-09-26 | Orchard Technologies, Inc. | Machine learning systems and methods for determining home value |
| CN112860831A (en) * | 2021-01-29 | 2021-05-28 | 城云科技(中国)有限公司 | Method and system for processing and displaying GIS point locations of urban management events |
| CN114153363B (en) * | 2021-12-02 | 2023-08-22 | 网易(杭州)网络有限公司 | Map display control method and device and electronic equipment |
| CN114153363A (en) * | 2021-12-02 | 2022-03-08 | 网易(杭州)网络有限公司 | Map display control method and device and electronic equipment |
Similar Documents
| Publication | Publication Date | Title |
|---|---|---|
| US8095434B1 (en) | Automatically performing varying levels of summarization of geographic data points in response to a user's selection of zoom level | |
| US10521191B1 (en) | Multi-faceted search | |
| US9830393B2 (en) | User interface for search method and system | |
| US9846729B1 (en) | Attribute category enhanced search | |
| CN105229637B (en) | Properties collection automatically generates | |
| US8306971B2 (en) | Methods and systems of automatically geocoding a dataset for visual analysis | |
| US20110282871A1 (en) | System and method of displaying search results based on density | |
| US20120124039A1 (en) | Online Search Based On Geography Tagged Recommendations | |
| EP2656247A1 (en) | Augmentation of place ranking using 3d model activity in an area | |
| US20150073941A1 (en) | Hotel finder interface | |
| WO2010060440A2 (en) | Computer-implemented method for providing location related content to a mobile device | |
| US8341156B1 (en) | System and method for identifying erroneous business listings | |
| US8346751B1 (en) | Hierarchial category index navigational system | |
| US9015142B2 (en) | Identifying listings of multi-site entities based on user behavior signals | |
| KR20160117510A (en) | Method and apparatus for provisioning geofences | |
| EP2734940A1 (en) | System and method of providing information based on street address | |
| Zhang et al. | Terrafly geocloud: an online spatial data analysis and visualization system | |
| JP5487475B2 (en) | Property information processing system and program | |
| US20170064512A1 (en) | System and method for facilitating user connections in travel locations | |
| JPH10247201A (en) | Information guidance system with information evaluating value | |
| US20230350955A1 (en) | Comparative search within user-generated content | |
| US20120265568A1 (en) | System and method for determining the return on investment of an application | |
| US8868593B1 (en) | User interface content view searching | |
| US20180011934A1 (en) | Identifying spatial records | |
| Papastefanatos et al. | VisualFacts: A Platform for In-Situ Visual Exploration and Real-Time Entity Resolution. |
Legal Events
| Date | Code | Title | Description |
|---|---|---|---|
| AS | Assignment |
Owner name: ZILLOW, INC., WASHINGTON Free format text: ASSIGNMENT OF ASSIGNORS INTEREST;ASSIGNORS:PUTTICK, RANDY W.;LEWIS, WILLIAM M.;BURROUGHS, JOHN K.;AND OTHERS;REEL/FRAME:020512/0685 Effective date: 20080207 |
|
| STCF | Information on status: patent grant |
Free format text: PATENTED CASE |
|
| CC | Certificate of correction | ||
| AS | Assignment |
Owner name: SILICON VALLEY BANK, CALIFORNIA Free format text: SECURITY AGREEMENT;ASSIGNOR:ZILLOW, INC.;REEL/FRAME:028169/0881 Effective date: 20120430 |
|
| FEPP | Fee payment procedure |
Free format text: PAT HOLDER NO LONGER CLAIMS SMALL ENTITY STATUS, ENTITY STATUS SET TO UNDISCOUNTED (ORIGINAL EVENT CODE: STOL); ENTITY STATUS OF PATENT OWNER: LARGE ENTITY |
|
| FPAY | Fee payment |
Year of fee payment: 4 |
|
| MAFP | Maintenance fee payment |
Free format text: PAYMENT OF MAINTENANCE FEE, 8TH YEAR, LARGE ENTITY (ORIGINAL EVENT CODE: M1552); ENTITY STATUS OF PATENT OWNER: LARGE ENTITY Year of fee payment: 8 |
|
| AS | Assignment |
Owner name: ZILLOW, LLC, WASHINGTON Free format text: ARTICLES OF ENTITY CONVERSION AND CERTIFICATE OF FORMATION;ASSIGNOR:ZILLOW, INC.;REEL/FRAME:062136/0427 Effective date: 20221028 |
|
| AS | Assignment |
Owner name: PUSH SUB I, INC., WASHINGTON Free format text: ASSIGNMENT OF ASSIGNORS INTEREST;ASSIGNOR:ZILLOW, LLC;REEL/FRAME:062353/0901 Effective date: 20221030 |
|
| AS | Assignment |
Owner name: MFTB HOLDCO, INC., WASHINGTON Free format text: MERGER;ASSIGNOR:PUSH SUB I, INC.;REEL/FRAME:062389/0035 Effective date: 20221031 |
|
| MAFP | Maintenance fee payment |
Free format text: PAYMENT OF MAINTENANCE FEE, 12TH YEAR, LARGE ENTITY (ORIGINAL EVENT CODE: M1553); ENTITY STATUS OF PATENT OWNER: LARGE ENTITY Year of fee payment: 12 |