US8543282B2 - Remote diagnosis modelling - Google Patents
Remote diagnosis modelling Download PDFInfo
- Publication number
- US8543282B2 US8543282B2 US12/600,260 US60026008A US8543282B2 US 8543282 B2 US8543282 B2 US 8543282B2 US 60026008 A US60026008 A US 60026008A US 8543282 B2 US8543282 B2 US 8543282B2
- Authority
- US
- United States
- Prior art keywords
- relations
- systems
- model
- diagnosis
- determined
- Prior art date
- Legal status (The legal status is an assumption and is not a legal conclusion. Google has not performed a legal analysis and makes no representation as to the accuracy of the status listed.)
- Active, expires
Links
Images


Classifications
-
- G—PHYSICS
- G01—MEASURING; TESTING
- G01M—TESTING STATIC OR DYNAMIC BALANCE OF MACHINES OR STRUCTURES; TESTING OF STRUCTURES OR APPARATUS, NOT OTHERWISE PROVIDED FOR
- G01M17/00—Testing of vehicles
-
- G—PHYSICS
- G06—COMPUTING; CALCULATING OR COUNTING
- G06F—ELECTRIC DIGITAL DATA PROCESSING
- G06F11/00—Error detection; Error correction; Monitoring
- G06F11/07—Responding to the occurrence of a fault, e.g. fault tolerance
- G06F11/0703—Error or fault processing not based on redundancy, i.e. by taking additional measures to deal with the error or fault not making use of redundancy in operation, in hardware, or in data representation
- G06F11/0751—Error or fault detection not based on redundancy
-
- G—PHYSICS
- G06—COMPUTING; CALCULATING OR COUNTING
- G06Q—INFORMATION AND COMMUNICATION TECHNOLOGY [ICT] SPECIALLY ADAPTED FOR ADMINISTRATIVE, COMMERCIAL, FINANCIAL, MANAGERIAL OR SUPERVISORY PURPOSES; SYSTEMS OR METHODS SPECIALLY ADAPTED FOR ADMINISTRATIVE, COMMERCIAL, FINANCIAL, MANAGERIAL OR SUPERVISORY PURPOSES, NOT OTHERWISE PROVIDED FOR
- G06Q10/00—Administration; Management
- G06Q10/06—Resources, workflows, human or project management; Enterprise or organisation planning; Enterprise or organisation modelling
-
- G—PHYSICS
- G07—CHECKING-DEVICES
- G07C—TIME OR ATTENDANCE REGISTERS; REGISTERING OR INDICATING THE WORKING OF MACHINES; GENERATING RANDOM NUMBERS; VOTING OR LOTTERY APPARATUS; ARRANGEMENTS, SYSTEMS OR APPARATUS FOR CHECKING NOT PROVIDED FOR ELSEWHERE
- G07C5/00—Registering or indicating the working of vehicles
- G07C5/008—Registering or indicating the working of vehicles communicating information to a remotely located station
-
- G—PHYSICS
- G07—CHECKING-DEVICES
- G07C—TIME OR ATTENDANCE REGISTERS; REGISTERING OR INDICATING THE WORKING OF MACHINES; GENERATING RANDOM NUMBERS; VOTING OR LOTTERY APPARATUS; ARRANGEMENTS, SYSTEMS OR APPARATUS FOR CHECKING NOT PROVIDED FOR ELSEWHERE
- G07C5/00—Registering or indicating the working of vehicles
- G07C5/08—Registering or indicating performance data other than driving, working, idle, or waiting time, with or without registering driving, working, idle or waiting time
Definitions
- the present invention relates to a diagnosis and maintenance method, a diagnosis and maintenance assembly comprising a central server and a system, and a computer program for fault detection for a plurality of systems, particularly for a plurality of vehicles, wherein each system provides at least one system-related signal which serves as basis for the diagnosis and/or maintenance of/for the system.
- mechatronic or electronic systems are for example elevators, robots, cash machines, escalators, airplanes, boats and their sub-systems.
- An important sub-system is for example a sensor network.
- the invention can be used for data networks or telecommunication for monitoring and detecting anomalies in different sub-systems such as routers. Additionally, the inventive method enables classification of different driving scenarios and different usage of vehicles for improving service planning and up-times.
- diagnosis and maintenance methods which allow a monitoring of a single or a plurality of vehicles wherein vehicle status, service requirements, maintenance records and operational characteristics are transmitted from the vehicles to a service centre which provides diagnosis and maintenance.
- the collected data are compared to standard data previously defined for each vehicle. Based on detected deviations from the standard data the service centre determines whether repair, service or maintenance is necessary.
- the service centre is also enabled to transmit updates or to modify maintenance schedules for the vehicles.
- service requirements like replacement of wear parts such as engine oil, oil filters, breaking disks or windscreen wiper blades used to be defined by a certain numbers of days or a certain mileage.
- the vehicle was asked to come to a repair shop for performing the defined necessary maintenance. This maintenance was performed even if the wear parts were still usable. This results in frequent stops at a repair shop, which also means that the vehicle is not usable during that time, which in turn results in increased costs due to the enforced idle period, particularly if commercial vehicles are concerned.
- the service intervals for a vehicle for securing the availability of the vehicle have to be short in order to detect errors or faults before their occurrence.
- a vehicle is in fact malfunctioning the search for the fault consumes a lot of time due to the plurality of different mechanical and electrical components.
- a constant monitoring of the vehicle by several sensors and transmitting the corresponding plurality of signals to the service centre would be necessary.
- Even with the help of wireless communication the sheer mass of data from a single vehicle to the service centre bars this possibility. Therefore, most methods use a limited set of parameters which are determined in advance to monitor the status of a vehicle and correspond to pre-selected subsystems of the vehicle.
- a further disadvantage of the methods known from the state of the art is that the standard values for the monitored parameters are defined as ideal values which are likely not to mirror the reality and are mostly not adaptable during the life time of a vehicle so that aging effects cannot be taken into account.
- the inventive concept is, according to an aspect thereof, based on the fact that system-related signals provided by each system which describe the status of the system can or cannot show a significant relation between them.
- the determination whether a relation is significant or not can be performed by comparing the compatible relations between the systems. For this comparison it is preferred to use an appropriate metric.
- this significant relation can be compared between systems, or compared for single systems over time, and used as a basis on which a decision on a necessity for providing maintenance and/or repair to an individual system can be reached.
- the proposed method according to an aspect thereof, can also be updated with time, and thus adjust to e.g. wear, and can monitor subsystems that were not considered in the initial design phase. Additionally, the significant relation also relates the fault to a sub-system, whereby the time for the search for a malfunction can be reduced.
- the relation can occur between same system-related signals at different time points, which allows a detection of an aging behaviour of the system, or between different system-related signals at same time-points which can be an indication for an interaction between the systems or system-parts which are characterized by the corresponding system-related signal. Additionally, it is also possible to determine a relation between different system-related signals at different time-points which can indicate an aging behaviour of the interaction between systems or system-parts.
- the relation is defined by a linear or non-linear correlation wherein also autocorrelation can be regarded.
- linear or nonlinear correlations can be represented by eigenvectors of a correlation matrix.
- observed joint distribution of observed values which can preferably be expressed through histogramming or clustering, wherein the latter can be with or without topological information.
- the norm is defined by comparing the significant relations for the plurality of systems. Further, it is preferred to detect a deviation from this defined norm. The decision whether maintenance and/or repair is necessary can then be based on the existence of a detected deviation from the norm and/or whether the detected deviation is significant.
- the advantage of defining the norm by comparing the significant relation for all systems is that the reality can be taken into account.
- the defined norm is determined by the systems themselves under real operation conditions and not through idealised values determined e.g. under laboratory or test-bench conditions. Additionally, since it is not a priori defined which system is to be investigated but the occurrence of a significant relation between system-related signals is determined, any system can be investigated as long as there are system-related signals available that are influenced by an operation of the system.
- the definition of the norm and/or the detection of a deviation from the norm are preferably performed by statistical methods, particularly statistical classification methods, wherein the significance of the deviation can be quantified by a statistical confidence test.
- the determination of a relation between system-related signals is performed by fitting a model to the signals, whereby the model, associated model parameters, a model output and a fitting quality are defined.
- the model captures the relations between the system-related signals and consequently represents a reduced representation of the data since, for example, only the model parameters or model outputs need to be regarded for gaining information on the system. Whether the relations are significant or not can then be determined by considering the fitting quality and the variance of the models within the plurality of systems.
- a cross validation of the models can be performed.
- Analyzing the changes in the fitted model allows for e.g. a detection of a malfunction in a system and improving/adapting existing models provides a possibility to adapt the model to aging effects of the systems.
- the models are fitted by the systems itself, wherein additionally the systems also perform a selection which sensors and system-related signals are monitored, and subsequently a comparison between the fitted models is performed. Based on the result of the comparison a best model or norm model can be defined which serves as basis for the decision whether maintenance or repair is necessary.
- the norm can be advantageous to define the norm by defining norm values for the model parameters and/or the model output, wherein for the determination of the norm values the model parameters/outputs of all systems are regarded.
- the definition of the norm values for the model parameters and/or the model output are performed by statistical methods.
- a simple but sufficient possibility is to calculate average values for the model parameters and/or outputs. Whether a deviation from the norm occurs can then be determined by detecting whether the model parameter/output under investigation is outside a range defined by a suitable parameterised distribution around the average value, for example given by a Gaussian probability density model.
- the significant relation is monitored, particularly by constantly determining the model parameters and/or outputs for the significant relation and comparing the model parameters and/or outputs to the corresponding norm values, whereby a deviation from the norm values can be detected.
- the system performs the step of determining the relation and/or the fitting of the model itself. This results in a reduction of data volume which is transmitted to a central server, particularly a service centre, for the decision whether maintenance or repair needs to be performed.
- the remaining steps such as comparing the relations, determining the significant relations, detecting a deviation and deciding whether the detected deviation is significant for the need of maintenance or repair are preferably performed by the central server, which can take into account the relations of a plurality of systems. But it is also possible that the central server performs all steps and the systems just provide the system-related signals to the central server, or, vice versa, that the systems perform all steps, or that the assignment of the steps to system/central server differs.
- wireless communication units are provided for the communication between central server and systems.
- the single FIGURE shows:
- FIG. 1 a flow diagram for a preferred embodiment of the method according to the present invention.
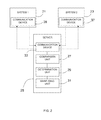
- FIG. 2 is a schematic view of an assembly according to an aspect of the present invention.
- each of the vehicles comprising several sub-system for which maintenance and diagnosis should be provided.
- the sub-system regarded in the following as preferred embodiment is an air suspension system for which diagnosis and maintenance is performed.
- the air suspension system serves as exemplary system only. Every other sub-system included in a vehicle or even the vehicle itself could be regarded.
- the invention is described for a fleet of vehicles it is also usable for any mechatronic or electronic system as for example elevators, robots, cash machines, escalators, airplanes, boats and their sub-systems.
- An important sub-system is for example a sensor network.
- the invention can be used for data networks or telecommunication for monitoring and detecting anomalies in different sub-systems such as routers. Additionally, the inventive method enables classification of different driving scenarios and different usage of vehicles for improving service planning and up-times.
- the exemplary regarded air suspension system provides system-related signals as for example pressure (P) and level (L) at a bellow and accumulator tank pressure (Pw), which are provided for example by sensors arranged at the bellow and the wet tank.
- system-related signals such as for example Vfan (fan speed), ⁇ (engine torque) and Tcm (temperature of the cooling media) could be regarded just as well.
- Vfan fan speed
- ⁇ engine torque
- Tcm temperature of the cooling media
- the system-related signals can be chosen randomly or deterministically by an engineer and/or a specialist to the system.
- Whether there is a relation is not determined by the single investigated (main-) system but by a plurality of (main-)systems which determine relations for the same chosen system-related signals of the (main-)system or of sub-systems of the main-system. In case, for example, most of the (main-)systems show a relation between the chosen system-related signals it is likely that the relation is also a significant relation.
- the determination whether there is/are a relation/s is performed by fitting a model to the system-related signals to be investigated, whereby the model, associated model parameters, a model output and a fitting quality can be defined.
- the model encodes the relations between the system-related signals that are part of the system.
- the investigated subsystem can be the air suspension system of a vehicle.
- the vehicle itself comprises a determination unit, for example an on-board computer, which is adapted to fit a model to system-related signals.
- the system-related signals in turn can be derived from a sensor network or a single sensor within the vehicle, wherein the signals can be transmitted from the. sensors to the determination unit by, for example, communication busses or a vehicle-intern communication network.
- an assembly for performing the diagnosis and maintenance method can comprise at least two systems 21 and 23 for which diagnosis and/or maintenance are performed. Each system 21 and 23 provides at least one system-related signal and each system is adapted to determine at least one relation between the system-related signals.
- the assembly further comprises a central server 25 including a comparison unit 27 for comparing the compatible determined relations, a determination unit 29 for determining based on the result of the comparison which relations are a significant relations, and a diagnosis/maintenance unit 31 for providing a diagnosis and/or maintenance decision based on the determined significant relations.
- Both the central server 25 and each system 21 and 23 further each include a communication device 33 , 35 , and 37 , respectively.
- the communication device 33 of the central server 25 is adapted to transmit to each system 21 and 23 a request for at least one relation between system-related signals, the communication device 35 and 37 of each system 21 and 23 , respectively, is adapted to receive the request and to transmit the requested relation, and the communication device of the central server is further adapted to receive the transmitted requested relation.
- FIG. 1 shows a flow diagram of a preferred embodiment of the inventive method, wherein in a first step 1 the system-related signals for which a relation should be determined are selected.
- This selection can be performed for example by a service engineer or a specialist working at a service centre (comprising a central server) which provides maintenance and diagnosis to a fleet of vehicles.
- the system-related signals that are used can also be configured automatically for example by the service centre itself.
- a random or deterministic search method can be used, wherein the deterministic search method can be based on collected data of a single vehicle.
- the service centre specifies a model structure for the system-related signals, which describes the relations to be investigated and therefore characterises systems, subsystems or cross-relations between systems.
- This model specification is transmitted to the plurality of systems or in the regarded case to each vehicle in the fleet. It is also possible to send out different signal configurations to each vehicle (system) and let an optimization algorithm in every vehicle fit a model to the measured data during operation of the vehicles (step 3 ).
- the fitting of the model creates data on the model, the model parameters, the model output and the fitting quality.
- the regarded air suspension system comprises a number of system-related signals that are measured continuously, for example pressure (P) and level (L) at a bellow and the accumulator tank pressure (Pw).
- P pressure
- L level
- Pw accumulator tank pressure
- model parameters fitted by each vehicle as well as the model output and the fitting quality are transmitted in a further step 4 from each vehicle back to the service centre.
- the service centre compares in step 5 how well different vehicles have fitted their specified models, and then selects the best model specification by comparing models, model parameters, model outputs, fitting qualities and how the model parameters vary between the vehicles (step 6 ).
- step 6 the service centre determines whether the relations described by the model configuration are significant or not by comparing the fitting qualities, calculating and comparing the variance of the models and performing a cross validation for the models of all vehicles. It is also possible that the service centre tests how well different signal configurations can be fitted by sending the configurations to all vehicles in a fleet where each vehicle then only sends back how well it managed to make a fit (fitting quality). In this manner the most suitable configuration can be found as the configuration with the lowest fitting error and/or the largest spread of parameters. It goes without saying, that a configuration can also be regarded as most suitable configuration that shows reasonable values only for a single vehicle, but shows a very stable and high quality (e.g. low noise) relation so that the configuration is worth a try. By accepting also such a configuration as most suitable configuration it is for example possible to disregard environmental influences, since it is possible that the vehicle showing the stable relation is operated under completely different conditions than all other vehicles in the fleet.
- a configuration can also be regarded as most suitable configuration that shows reasonable values only for a single
- this configuration is marked as “interesting” configuration. It is possible to select more than one configuration as a “interesting”-configuration, if, for example, it is not possible to discriminate between them (e.g. if the confidence range of the fitting error overlap with the range of a different model).
- step 7 the chosen “interesting” model/s is/are transmitted to all vehicles in the fleet and is/are continuously adapted (fitted) by all vehicles in the fleet (step 8 ). Subsequently each vehicle transmits back constantly calculated model parameters, model outputs and fitting qualities (step 8 ). On the basis of these data it is then possible to provide decisions on needs for maintenance or diagnosis for each individual vehicle.
- a suitable statistical method can be used. For example, it is possible to simply calculate averages and standard deviations for the model parameters.
- the comparison of models is done using a distance metric appropriate for the type of model, for example a Euclidean metric between parameters, a Mahalanobis metric between model parameters, a Krzanowski similarity for vectors, a distance between cluster centers, a Hausdorff metric between topological surfaces, etc.
- a distance metric appropriate for the type of model, for example a Euclidean metric between parameters, a Mahalanobis metric between model parameters, a Krzanowski similarity for vectors, a distance between cluster centers, a Hausdorff metric between topological surfaces, etc.
- a linear model as described in the preferred embodiment can be used, but also other statistical methods like e.g. Principal Component Analysis, Self Organising Maps or Random Sample Consensus Method are applicable.
- the data transmitted from the vehicles can be monitored from now on, and can be constantly compared to the corresponding norm value (step 11 ). If one (or several) of the model parameters/outputs deviate/s significantly from the norm, a problem in the regarded system of that vehicle is likely. Necessary actions can then be taken, such as start of downloading software from the service centre to the vehicle to provide a more detailed diagnosis for that system.
- step 12 For the determination (step 12 ) whether there is a significant deviation it is also preferable to use statistical methods.
- the determination of a significant deviation can be performed for example by a cross-validation experiment, using a covariance matrix Mstd for the model parameters Mk (where k is an index for a population of K vehicles) which are sent continuously back to the service centre. It is also possible that the models are calculated continuously and are only transmitted, for example, in case a change in model parameters or outputs is detected or after a certain predetermined time period.
- Mstd is the covariance matrix for the model parameters for a subset of the vehicles and M is the average value of the model parameters for the same subset of vehicles.
- the significance can then be determined for example by a statistical confidence test which determines, if the parameters of a model from one vehicle are significantly different from those in the subset (fleet) of models (vehicles).
- a possible statistical test is to compute the probability for the observed deviation between the single vehicle and the subset under the assumption of, e.g., a multivariate normal distribution.
- the service centre can set in step 13 a “fault” signal for that system for which the deviation was detected and transmit a message to the vehicle that for example maintenance, repair or further diagnosis is necessary (step 14 ).
- the service centre can comprise a mechanism that enables the service centre to remove models from vehicles in the population that have been used in an environment or in a manner that deviates from the other vehicles before the values are determined. For example a vehicle is idle during a longer period of time, for example, due to repair or holiday of the user, or a vehicle is unexpectedly used in a different environment for example if a vehicle is used in a desert while it is normally used in a temperate climate.
Abstract
Description
where the signals are measured at times t1 to tk
Model 1:
L(t)=a·L(t 1)+b·P(t)+c (Eq. 2)
or Model 2:
L(t)=a·L(t 1)+b·P(t)+c·P w(t)+d (Eq. 3)
wherein the model parameters M=[a b c] (or M=[a b c d] for the latter case) can be found through an optimization method (such as the least squares method) applied to the measured data on a single vehicle. This parameter fitting can be done on the vehicle and each vehicle returns a set of parameters describing the observed relations for that specific vehicle.
wherein Mstd is the covariance matrix for the model parameters for a subset of the vehicles and
Claims (24)
Applications Claiming Priority (4)
| Application Number | Priority Date | Filing Date | Title |
|---|---|---|---|
| SEPCT/SE07/00466 | 2007-05-14 | ||
| WOPCT/SE2007/000466 | 2007-05-14 | ||
| PCT/SE2007/000466 WO2008140363A1 (en) | 2007-05-14 | 2007-05-14 | Remote diagnosis modellin |
| PCT/SE2008/000327 WO2008140381A1 (en) | 2007-05-14 | 2008-05-12 | Remote diagnosis modelling |
Publications (2)
| Publication Number | Publication Date |
|---|---|
| US20100174444A1 US20100174444A1 (en) | 2010-07-08 |
| US8543282B2 true US8543282B2 (en) | 2013-09-24 |
Family
ID=40002438
Family Applications (1)
| Application Number | Title | Priority Date | Filing Date |
|---|---|---|---|
| US12/600,260 Active 2029-01-28 US8543282B2 (en) | 2007-05-14 | 2008-05-12 | Remote diagnosis modelling |
Country Status (8)
| Country | Link |
|---|---|
| US (1) | US8543282B2 (en) |
| EP (1) | EP2153415A4 (en) |
| JP (1) | JP5432128B2 (en) |
| KR (1) | KR20100021408A (en) |
| CN (1) | CN101681531B (en) |
| BR (1) | BRPI0811607A8 (en) |
| RU (1) | RU2479042C2 (en) |
| WO (2) | WO2008140363A1 (en) |
Cited By (3)
| Publication number | Priority date | Publication date | Assignee | Title |
|---|---|---|---|---|
| US20140025250A1 (en) * | 2012-07-18 | 2014-01-23 | Honeywell International Inc. | Non-deterministic maintenance reasoner and method |
| US10354462B1 (en) | 2018-04-06 | 2019-07-16 | Toyota Motor Engineering & Manufacturing North America, Inc. | Fault diagnosis in power electronics using adaptive PCA |
| US10650616B2 (en) | 2018-04-06 | 2020-05-12 | University Of Connecticut | Fault diagnosis using distributed PCA architecture |
Families Citing this family (23)
| Publication number | Priority date | Publication date | Assignee | Title |
|---|---|---|---|---|
| AT505105B1 (en) * | 2008-07-24 | 2009-10-15 | Avl List Gmbh | METHOD FOR ASSESSING THE RABBABILITY OF VEHICLES |
| US8095261B2 (en) * | 2009-03-05 | 2012-01-10 | GM Global Technology Operations LLC | Aggregated information fusion for enhanced diagnostics, prognostics and maintenance practices of vehicles |
| CN102844721B (en) * | 2010-02-26 | 2015-11-25 | 株式会社日立制作所 | Failure cause diagnostic system and method thereof |
| US8433472B2 (en) * | 2010-08-04 | 2013-04-30 | GM Global Technology Operations LLC | Event-driven data mining method for improving fault code settings and isolating faults |
| US20120185126A1 (en) * | 2011-01-19 | 2012-07-19 | GM Global Technology Operations LLC | Vehicle control system diagnostic tool |
| US20140222310A1 (en) * | 2012-10-09 | 2014-08-07 | United Technologies Corporation | Engine monitor for a multi-engine system |
| US9014918B2 (en) * | 2012-10-12 | 2015-04-21 | Cummins Inc. | Health monitoring systems and techniques for vehicle systems |
| FR2997451B1 (en) * | 2012-10-26 | 2015-01-16 | Snecma | SYSTEM FOR MONITORING A SET OF ENGINE COMPONENTS |
| CN105658937B (en) | 2013-10-04 | 2019-06-28 | 沃尔沃卡车集团 | Method for monitoring the operation of sensor |
| US20160035145A1 (en) * | 2014-07-31 | 2016-02-04 | Ford Global Technologies, Llc | Method and Apparatus for Vehicle Data Gathering and Analysis |
| FR3053492A1 (en) * | 2016-06-30 | 2018-01-05 | Compagnie Generale Des Etablissements Michelin | METHOD AND DEVICE FOR DETERMINING AN ESTIMATE OF THE TOTAL MASS OF A MOTOR VEHICLE |
| US10096178B2 (en) * | 2017-01-03 | 2018-10-09 | The Boeing Company | Reducing nuisance fault indications from a vehicle using physics based and data driven models |
| JP7179444B2 (en) * | 2017-03-29 | 2022-11-29 | 三菱重工業株式会社 | Sign detection system and sign detection method |
| CN110678727B (en) * | 2017-06-02 | 2021-08-31 | 富士通株式会社 | Determination device, determination method, and storage medium |
| CN107403051B (en) * | 2017-08-01 | 2020-07-31 | 贺州学院 | Maintenance time determining method and device |
| RU2680945C1 (en) * | 2018-04-17 | 2019-02-28 | Закрытое акционерное общество "Туполев-Проект" | Intelligent system of finding failures on aircraft |
| DE102018132685A1 (en) * | 2018-12-18 | 2020-06-18 | Bayerische Motoren Werke Aktiengesellschaft | Method for the remote control of a fault finding of a means of transportation, means of transportation, back-end server and system |
| RU2729110C1 (en) * | 2019-07-01 | 2020-08-04 | Акционерное общество "Туполев-Проект" | Intelligent aircraft maintenance system |
| CN110689642B (en) * | 2019-09-18 | 2020-10-09 | 山东大学 | Abnormal driving distinguishing method and system based on vehicle-mounted OBD data and probability statistics |
| US11900330B1 (en) * | 2019-10-18 | 2024-02-13 | State Farm Mutual Automobile Insurance Company | Vehicle telematics systems and methods |
| JP7381353B2 (en) * | 2020-01-21 | 2023-11-15 | 三菱重工エンジン&ターボチャージャ株式会社 | Prediction device, prediction method and program |
| KR102545924B1 (en) * | 2020-11-25 | 2023-06-20 | 한국수력원자력 주식회사 | Method for analyzing answer of survey |
| US11922806B2 (en) * | 2022-02-24 | 2024-03-05 | GM Global Technology Operations LLC | System and method enabling validation-as-a-service for continuous validation of advanced driver assistance systems and autonomous vehicles |
Citations (9)
| Publication number | Priority date | Publication date | Assignee | Title |
|---|---|---|---|---|
| US5737215A (en) | 1995-12-13 | 1998-04-07 | Caterpillar Inc. | Method and apparatus for comparing machines in fleet |
| US5809437A (en) | 1995-06-07 | 1998-09-15 | Automotive Technologies International, Inc. | On board vehicle diagnostic module using pattern recognition |
| WO2001031448A1 (en) | 1999-10-28 | 2001-05-03 | General Electric Company | A process and system for developing predictive diagnostics algorithms in a machine |
| WO2001043079A1 (en) | 1999-12-09 | 2001-06-14 | Robert Bosch Gmbh | Method for recognition of faults on a motor vehicle |
| US6609051B2 (en) * | 2001-09-10 | 2003-08-19 | Daimlerchrysler Ag | Method and system for condition monitoring of vehicles |
| US6735549B2 (en) * | 2001-03-28 | 2004-05-11 | Westinghouse Electric Co. Llc | Predictive maintenance display system |
| US7069124B1 (en) * | 2002-10-28 | 2006-06-27 | Workhorse Technologies, Llc | Robotic modeling of voids |
| US7243009B2 (en) * | 2003-05-09 | 2007-07-10 | Yamaha Hatsudoki Kabushiki Kaisha | Parameter optimization method, parameter optimization apparatus, parameter optimization program, and marine vessel navigation control apparatus |
| US7751955B2 (en) * | 2006-06-30 | 2010-07-06 | Spx Corporation | Diagnostics data collection and analysis method and apparatus to diagnose vehicle component failures |
Family Cites Families (7)
| Publication number | Priority date | Publication date | Assignee | Title |
|---|---|---|---|---|
| DE4438854C2 (en) * | 1994-11-02 | 1996-12-12 | Siemens Ag | Monitoring system for a technical system |
| JP3495129B2 (en) * | 1995-03-03 | 2004-02-09 | 株式会社東芝 | Plant abnormality detection device |
| JP3849675B2 (en) * | 2003-07-25 | 2006-11-22 | トヨタ自動車株式会社 | Vehicle diagnosis method, vehicle diagnosis system, vehicle and center |
| JP2005301582A (en) * | 2004-04-09 | 2005-10-27 | Toshiba Corp | Process management device |
| JP4542819B2 (en) * | 2004-05-21 | 2010-09-15 | 株式会社小松製作所 | Hydraulic machine, system and method for monitoring the health status of a hydraulic machine |
| JP2006135412A (en) * | 2004-11-02 | 2006-05-25 | Tokyo Gas Co Ltd | Remote supervisory system |
| CN1858808A (en) * | 2006-04-20 | 2006-11-08 | 深圳市元征科技股份有限公司 | Radio diagnostic device for automobile fault |
-
2007
- 2007-05-14 WO PCT/SE2007/000466 patent/WO2008140363A1/en active Application Filing
-
2008
- 2008-05-12 RU RU2009146122/08A patent/RU2479042C2/en not_active IP Right Cessation
- 2008-05-12 CN CN2008800159398A patent/CN101681531B/en active Active
- 2008-05-12 EP EP08753947A patent/EP2153415A4/en not_active Ceased
- 2008-05-12 WO PCT/SE2008/000327 patent/WO2008140381A1/en active Application Filing
- 2008-05-12 US US12/600,260 patent/US8543282B2/en active Active
- 2008-05-12 BR BRPI0811607A patent/BRPI0811607A8/en active IP Right Grant
- 2008-05-12 JP JP2010508335A patent/JP5432128B2/en active Active
- 2008-05-12 KR KR1020097023039A patent/KR20100021408A/en not_active Application Discontinuation
Patent Citations (10)
| Publication number | Priority date | Publication date | Assignee | Title |
|---|---|---|---|---|
| US5809437A (en) | 1995-06-07 | 1998-09-15 | Automotive Technologies International, Inc. | On board vehicle diagnostic module using pattern recognition |
| US5737215A (en) | 1995-12-13 | 1998-04-07 | Caterpillar Inc. | Method and apparatus for comparing machines in fleet |
| WO2001031448A1 (en) | 1999-10-28 | 2001-05-03 | General Electric Company | A process and system for developing predictive diagnostics algorithms in a machine |
| WO2001043079A1 (en) | 1999-12-09 | 2001-06-14 | Robert Bosch Gmbh | Method for recognition of faults on a motor vehicle |
| US6766232B1 (en) | 1999-12-09 | 2004-07-20 | Robert Bosch Gmbh | Method for recognition of faults on a motor vehicle |
| US6735549B2 (en) * | 2001-03-28 | 2004-05-11 | Westinghouse Electric Co. Llc | Predictive maintenance display system |
| US6609051B2 (en) * | 2001-09-10 | 2003-08-19 | Daimlerchrysler Ag | Method and system for condition monitoring of vehicles |
| US7069124B1 (en) * | 2002-10-28 | 2006-06-27 | Workhorse Technologies, Llc | Robotic modeling of voids |
| US7243009B2 (en) * | 2003-05-09 | 2007-07-10 | Yamaha Hatsudoki Kabushiki Kaisha | Parameter optimization method, parameter optimization apparatus, parameter optimization program, and marine vessel navigation control apparatus |
| US7751955B2 (en) * | 2006-06-30 | 2010-07-06 | Spx Corporation | Diagnostics data collection and analysis method and apparatus to diagnose vehicle component failures |
Non-Patent Citations (2)
| Title |
|---|
| European Search Report (Sep. 26, 2012) for corresponding European App. EP 48 75 3947. |
| International Search Report for corresponding International Application PCT/SE2008/000327. |
Cited By (4)
| Publication number | Priority date | Publication date | Assignee | Title |
|---|---|---|---|---|
| US20140025250A1 (en) * | 2012-07-18 | 2014-01-23 | Honeywell International Inc. | Non-deterministic maintenance reasoner and method |
| US9008895B2 (en) * | 2012-07-18 | 2015-04-14 | Honeywell International Inc. | Non-deterministic maintenance reasoner and method |
| US10354462B1 (en) | 2018-04-06 | 2019-07-16 | Toyota Motor Engineering & Manufacturing North America, Inc. | Fault diagnosis in power electronics using adaptive PCA |
| US10650616B2 (en) | 2018-04-06 | 2020-05-12 | University Of Connecticut | Fault diagnosis using distributed PCA architecture |
Also Published As
| Publication number | Publication date |
|---|---|
| RU2479042C2 (en) | 2013-04-10 |
| WO2008140363A1 (en) | 2008-11-20 |
| JP5432128B2 (en) | 2014-03-05 |
| CN101681531B (en) | 2012-10-10 |
| JP2010527089A (en) | 2010-08-05 |
| RU2009146122A (en) | 2011-06-20 |
| KR20100021408A (en) | 2010-02-24 |
| EP2153415A4 (en) | 2012-11-07 |
| BRPI0811607A2 (en) | 2014-11-04 |
| WO2008140381A1 (en) | 2008-11-20 |
| EP2153415A1 (en) | 2010-02-17 |
| US20100174444A1 (en) | 2010-07-08 |
| BRPI0811607A8 (en) | 2017-11-07 |
| CN101681531A (en) | 2010-03-24 |
Similar Documents
| Publication | Publication Date | Title |
|---|---|---|
| US8543282B2 (en) | Remote diagnosis modelling | |
| US6609051B2 (en) | Method and system for condition monitoring of vehicles | |
| US8285438B2 (en) | Methods systems and apparatus for analyzing complex systems via prognostic reasoning | |
| JP5746420B2 (en) | Collaborative multi-agent vehicle fault diagnosis system and related methods | |
| US8346429B2 (en) | Vehicle health monitoring system architecture for diagnostics and prognostics disclosure | |
| US20090326890A1 (en) | System and method for predicting system events and deterioration | |
| US20070088570A1 (en) | System and method for predicting device deterioration | |
| US8346700B2 (en) | Vehicle health monitoring reasoner architecture for diagnostics and prognostics | |
| KR102215107B1 (en) | Vehicle state predicting system and method based on driving data | |
| WO2016020914A1 (en) | System and method for providing optimal state indication of a vehicle | |
| Keller et al. | An architecture to implement integrated vehicle health management systems | |
| US20130246860A1 (en) | System monitoring | |
| US7243265B1 (en) | Nearest neighbor approach for improved training of real-time health monitors for data processing systems | |
| US8359577B2 (en) | Software health management testbed | |
| Svensson et al. | Self-organizing maps for automatic fault detection in a vehicle cooling system | |
| Scheidemann | Optimizing the selection of representative configurations in verification of evolving product lines of distributed embedded systems | |
| JP2022136039A (en) | Method for determining the operating state of vehicle components | |
| JP5572966B2 (en) | Data similarity calculation method, system, and program | |
| Körper et al. | Harmonizing Heterogeneous Diagnostic Data of a Vehicle Fleet for Data-Driven Analytics | |
| WO2024013879A1 (en) | Diagnostic control unit and diagnostic control method | |
| BRPI0811607B1 (en) | REMOTE DIAGNOSTIC MODELING | |
| Cloudin | Enhanced System for the Prediction of Vehicle Condition. | |
| CN116068987A (en) | Apparatus for predicting failure of fuel injection pump in vehicle and method thereof | |
| Larsson Olsson et al. | Early Warning Leakage Detection for Pneumatic Systems on Heavy Duty Vehicles: Evaluating Data Driven and Model Driven Approach | |
| CN117454263A (en) | Vehicle anomaly identification and model construction method and device and vehicle |
Legal Events
| Date | Code | Title | Description |
|---|---|---|---|
| AS | Assignment |
Owner name: VOLVO TECHNOLOGY CORP., SWEDEN Free format text: ASSIGNMENT OF ASSIGNORS INTEREST;ASSIGNORS:HANSSON, JORGEN;SVENSSON, MAGNUS;ROGNVALDSSON, THORSTEINN;AND OTHERS;SIGNING DATES FROM 20091013 TO 20091031;REEL/FRAME:023518/0408 |
|
| STCF | Information on status: patent grant |
Free format text: PATENTED CASE |
|
| FPAY | Fee payment |
Year of fee payment: 4 |
|
| AS | Assignment |
Owner name: VOLVO TRUCK CORPORATION, SWEDEN Free format text: ASSIGNMENT OF ASSIGNORS INTEREST;ASSIGNOR:VOLVO TECHNOLOGY CORPORATION;REEL/FRAME:042235/0279 Effective date: 20170502 |
|
| MAFP | Maintenance fee payment |
Free format text: PAYMENT OF MAINTENANCE FEE, 8TH YEAR, LARGE ENTITY (ORIGINAL EVENT CODE: M1552); ENTITY STATUS OF PATENT OWNER: LARGE ENTITY Year of fee payment: 8 |