US8553495B2 - Device and method for imaging of non-linear and linear properties of formations surrounding a borehole - Google Patents
Device and method for imaging of non-linear and linear properties of formations surrounding a borehole Download PDFInfo
- Publication number
- US8553495B2 US8553495B2 US12/893,573 US89357310A US8553495B2 US 8553495 B2 US8553495 B2 US 8553495B2 US 89357310 A US89357310 A US 89357310A US 8553495 B2 US8553495 B2 US 8553495B2
- Authority
- US
- United States
- Prior art keywords
- borehole
- sequence
- pulses
- nonlinear
- receivers
- Prior art date
- Legal status (The legal status is an assumption and is not a legal conclusion. Google has not performed a legal analysis and makes no representation as to the accuracy of the status listed.)
- Active, expires
Links
Images


Classifications
-
- G—PHYSICS
- G01—MEASURING; TESTING
- G01V—GEOPHYSICS; GRAVITATIONAL MEASUREMENTS; DETECTING MASSES OR OBJECTS; TAGS
- G01V1/00—Seismology; Seismic or acoustic prospecting or detecting
- G01V1/40—Seismology; Seismic or acoustic prospecting or detecting specially adapted for well-logging
- G01V1/44—Seismology; Seismic or acoustic prospecting or detecting specially adapted for well-logging using generators and receivers in the same well
- G01V1/46—Data acquisition
Definitions
- the present disclosure relates generally to acoustic interrogation of rock formations around a borehole and more particularly to imaging of non-linear and linear properties of formation surrounding the borehole.
- a method for investigating material surrounding a borehole includes generating within a borehole an intermittent low frequency vibration that propagates as a tube wave longitudinally to the borehole and induces a nonlinear response in one or more features in the material that are substantially perpendicular to a longitudinal axis of the borehole; generating within the borehole a sequence of high frequency pulses directed such that they travel longitudinally to the borehole within the surrounding material; and receiving, at one or more receivers positionable in the borehole, a signal that includes components from the low frequency vibration and the sequence of high frequency pulses during intermittent generation of the low frequency vibration, to investigate the material surrounding the borehole.
- the sequence of high frequency pulses can be configured to propagate into the material as refracted waves, scattered waves or direct waves.
- the low frequency vibration, the sequence of high frequency pulses or both can be produced by a compressional source, a shear wave source or both wherein the compressional source, the shear wave source or both can include a vibrating member that is configured to induce elastic nonlinearity into the material.
- the one or more receivers can be arranged in an array in the borehole and the one or more receivers can be configured to record one or more directional components of the sequence of high frequency pulses.
- the method can include repeating the generating the low frequency vibration and the sequences of high frequency pulses at different azimuth orientations and at different depths within the borehole to produce one or more images of the material or properties of the material including a linear velocity, a linear modulus, a nonlinear velocity and/or a nonlinear modulus.
- an elastic distortion cycle can be caused by the low frequency vibration results in a corresponding cyclical variation in local velocity in the material.
- the method can include processing a sequence of high frequencies pulses returned to the one or more receivers from the material to determine an elastic nonlinear response of the material.
- an apparatus for investigating material surrounding a borehole can include a first acoustic wave source configured to generate within a borehole an intermittent low frequency vibration that propagates as a tube wave longitudinally to the borehole and induces a nonlinear response in one or more features in the material that are substantially perpendicular to a longitudinal axis of the borehole; a second acoustic wave source configured to direct a continuous sequence of high frequency pulses longitudinally to the borehole into the material; and one or more receivers positionable in the borehole and configured to receive a signal that includes components from the low frequency vibration and the sequence of high frequency pulses during intermittent generation of the low frequency vibration, to investigate the material surrounding the borehole.
- the sequence of high frequency pulses can be configured to propagate into the material as refracted waves, scattered waves or direct waves.
- the first acoustic wave source, the second acoustic wave source, or both can include a compressional source, a shear wave source or both, wherein the compressional source, the shear wave source or both can include a vibrating member that is configured to induce elastic nonlinearity into the material.
- the one or more receivers can be arranged in an array in the borehole and can be configured to record one or more directional components of the sequence of high frequency pulses.
- the apparatus can include a controller configured to repeat the generation of the low frequency vibration and the sequences of high frequency pulses at different azimuth orientations and at different depths within the borehole to produce one or more images of the material or properties of the material including a linear velocity, a linear modulus, a nonlinear velocity and/or a nonlinear modulus.
- an elastic distortion cycle of the low frequency vibration generated by the first acoustic wave source can result in a corresponding cyclical variation in local velocity in the material.
- the apparatus can include a processor in communication with a memory having machine executable instructions stored therein which, when executed cause the processor to determine an elastic nonlinear response of the material based on a sequence of high frequencies pulses returned to the one or more receivers from the material.
- FIG. 1 shows an example arrangement for investigating cracks and other damage in material that runs parallel or sub-parallel to the borehole in accordance with an aspect of the disclosure.
- FIGS. 2 a and 2 b show an example interaction of the material surrounding the borehole to the low frequency acoustic wave, or “pump” wave and the sequence of high frequency pulses, or “probe” wave or pulses in accordance with aspects of the disclosure.
- FIGS. 3 a - 3 c show an example detection process used to distinguish between linear and nonlinear scatters in accordance with aspects of the disclosure.
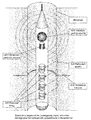
- FIG. 4 shows an example arrangement for investigating cracks and other damage that are oriented perpendicular or substantially perpendicular to the borehole in accordance with aspects of the disclosure.
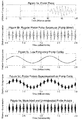
- FIGS. 5 a - 5 e show an example graphic illustration of the operation of the arrangement of FIG. 4 .
- FIGS. 6 a - 6 c show an example of received signals from the arrangement of FIG. 4 .
- FIG. 1 shows an example arrangement for investigating cracks and other damage in material surrounding the borehole that runs parallel or sub-parallel to the borehole.
- the borehole can be drilled in a variety of inclinations, such as vertical, inclined or horizontal, and embedded in a rock formation.
- the term “sub-parallel” will mean almost parallel, but diverging or converging slightly.
- the material surrounding the borehole can include cement, casing, rock formations and/or various types of fluids such as drilling mud, completion fluid, formation water or hydrocarbon.
- One or more low frequency transducers 105 are arranged within borehole 110 to produces a low frequency acoustic wave or “pump” wave into material 115 surrounding borehole 110 .
- the low frequency acoustic wave is sufficiently powerful to induce non-linear behavior in material 115 that has this characteristic.
- the low frequency or “pump” wave can be between 1 Hz to 100 kHz.
- One or more high frequency transducers 120 are arranged within borehole 110 to contemporaneously produce a sequence of a high frequency pulses, or “probe” wave into material 115 .
- This non-linear behavior refers to a non-linear dependence of elastic properties on the instantaneous strain state of the materials undergoing the strain.
- the behavior of the high frequency pulses can be modified, for example, by a change in a pulse amplitude and/or a pulse velocity.
- Transducer 120 can be arranged to generate pulses at a high repetition rate.
- transducer 120 can be configured to have a repetition rate of between 5 to 100 times for each pump wave cycle and emits bursts of high frequency 10-100 times that of the pump.
- transducers 105 , 120 or both can include a vibration source and can be either clamped or unclamped in the borehole 110 .
- both transducers 105 and 120 are arranged such that they generate the low frequency acoustic wave and the sequence of high frequency pulses, respectively, that propagate radially with respect to the longitudinal axis of borehole 110 into material 115 .
- the low frequency acoustic waves generated by transducer 105 tends to spread out more, only transducer 120 is oriented to generate the sequence of high frequency pulses radially into material 115 .
- one or more piezoelectric transducers can be used. If more than one transducer is used, they can be arranged in an array configuration.
- the array configuration can be linear, circular, a filled circle or a square array.
- the transducers within the array can be divided into groups, such that a first group of transducers can be driven by a source at the low frequency and a second group of transducers can be driven by the source or by a different source at the higher frequency.
- one or more sources can be used to produce signals to drive transducers 105 and/or 120 .
- the signals can be produced by a 2-channel signal generator. Similar signal or function generators may be used.
- Low frequency sources 105 and high frequencies sources 120 can be controlled by a controller (not shown) to emit their respective acoustic waves or pulses contemporaneously into material 115 .
- the low frequency wave and/or the high frequencies pulses can be broadband having a frequency range spread about the central frequency.
- One or more receivers 125 can be positionable, such that they can be arranged within borehole 110 at either above, below or both low frequency sources 105 , high frequency sources 120 or both.
- One or more of low frequency sources 105 , high frequencies sources 120 , and/or receivers 125 can be arranged in an array configuration within borehole 110 .
- One or more of low frequency sources 105 , high frequencies sources 120 , receivers 125 can be arranged on a common tool body 130 that can be raised or lowered within borehole 110 .
- the one or more receivers 125 can be locked to a side of the borehole and may record three components of wave particle motion so that the nonlinear feature azimuth can be inferred.
- the low frequency (pump) wave and the high frequency pulses (probe) both travel perpendicular to borehole 110 out into the material 115 surrounding borehole 110 .
- the pump wave has sufficient amplitude (generally greater than 10 ⁇ 6 strain amplitude), it will cause non-linear behavior, as discussed above, to be exhibited by cracks in material 115 that are oriented approximately perpendicular to radii of borehole 110 .
- Transducer 120 is arranged to emit a sequence of high frequency pulses or bursts to probe for nonlinearity induced by the pump wave. If a crack is present, the low frequency or pump wave will cause the crack to close and open depending on the pump wave phase.
- the crack closes and the high frequency wave pass through the crack and does not return to borehole 110 , since the closed crack does not exhibit any noticeable acoustical impedance contrast.
- the crack is propped open briefly and the probe pulses are reflected back to borehole 110 to be detected by receiver 125 in borehole 110 .
- the crack while open, creates an acoustical impedance contrast.
- Cracks can be distinguished from other reflecting interfaces such as structural boundaries or voids, because only cracks create the nonlinear effect that depends on pump wave phase. An interface or void will reflect the probe pulses independent of the pump wave phase.
- cracks can be distinguished from interfaces, voids, intact bonds between cement and casing or formation, etc.
- Other nonlinear features such as disbonding between cement and a casing in the borehole, as well as the cement and surrounding formations can also be probed.
- FIGS. 2 a and 2 b show an example interaction of the material surrounding the borehole to the low frequency acoustic wave, or “pump” wave produced by a compressional source and the sequence of high frequency pulses, or “probe” wave or pulses.
- stress amplitude of the rock formation (arbitrary units) is shown versus time (arbitrary units).
- the low frequency vibration oscillates a crack or a sequence of cracks in the formation causing the crack(s) to open during the wave dilation (tension) phase and to close during the wave compression phase.
- the high frequency pulses are emitted such that they are many pulses during each low frequency vibration cycle.
- both the high frequency pulses and the low frequency waves are reflected back from the feature to the borehole, as shown by the in FIG. 2 a .
- a crack, series of cracks or a highly mechanically damaged region is encountered, the feature is activated by its intrinsic nonlinearity.
- the crack is under compression from the effect of the vibration, the high and low frequency signals pass through it, not sensing the crack.
- the crack is under tension from the dilatational portion of the vibration, the high and low frequency signals are reflected from the crack, back to the borehole, as shown by FIG. 2 b.
- FIGS. 3 a - 3 c show an example detection process used to distinguish between linear and nonlinear scatters.
- FIG. 3 a shows an arrangement similar to FIG. 1 , where a crack (nonlinear feature) is located at position “A” and a void (linear feature) is located at position “B.”
- FIGS. 3 b and 3 c show how the detection process is used to determine if a scatterer is a crack or not.
- the top plot of FIG. 3 b shows a plot of stress (arbitrary units) versus time (arbitrary units) and the bottom plot of FIG.
- FIG. 3 b shows a plot of amplitude (arbitrary units) versus time (arbitrary units) for signals returned from the crack located at position “A” where the low frequency signal has been removed by application of a high-pass filter.
- the top plot of FIG. 3 c shows a plot of stress (arbitrary units) versus time (arbitrary units) and the bottom plot of FIG. 3 c shows a plot of amplitude (arbitrary units) versus time (arbitrary units) for signals returned from the void located at position “B.”
- the top plot of FIG. 3 b shows the reflected and detected low frequency vibration with the high frequency pulses sitting atop of it.
- the bottom plot of FIG. 3 b shows the same signal as the top plot of FIG. 3 b after the signal has been high-pass filtered to eliminate the low frequency wave.
- a time amplitude modulated returned signal indicates that a nonlinear feature has been detected.
- a linear feature such as the void at position “B”
- a two-way time delay from the reflector can be obtained by standard cross-correlation of the source pulse with the reflected pulse.
- the first sequence of high frequency pulses can be either chirped or coded or both chirped and coded.
- the first sequence of high frequency pulses can be modulated, wherein the modulation can include a modulation of an amplitude, a phase or a period of the pulse. If the linear velocity of the medium is known from other borehole measurement techniques, the distance to the nonlinear feature can be obtained.
- the azimuth of the reflector can be obtained by decomposition of the signals recorded by three component receivers. Repetition of the above steps at a given depth for different azimuths of the stringer and at different depths will provide a 3D image of the scattering structure and distinguish which scatterers are linear and which are not.
- FIG. 4 shows an example arrangement for investigating cracks and other damage that are oriented perpendicular or substantially perpendicular to the borehole.
- probing and imaging nonlinear features that can be sensed by refracted waves running parallel to the borehole, for instance cracks oriented perpendicular to the borehole.
- the borehole can be drilled in a variety of inclinations, such as vertical, inclined or horizontal, and embedded in a rock formation.
- Material 415 surrounding borehole 410 can include damage 430 that runs perpendicular or substantially perpendicular to borehole 410 .
- the term “substantially perpendicular” will mean almost perpendicular, but diverging or converging slightly.
- One or more transducers 405 are arranged to generate a low frequency or “pump” wave and oriented such that the wave propagates along the longitudinal axis of borehole 410 .
- the low frequency wave or vibration can propagate upward/downward along the longitudinal axis of borehole 410 as tube or refracted waves.
- flexibility in the disposition of transducer 405 within borehole 410 is feasible, as long as the low frequency wave induces a small elastic nonlinearity next to borehole 410 in the material 415 as a result of particle motion in the surrounding material parallel to the borehole axis.
- transducer 405 are arranged to generate the low frequency wave intermittently, such that transducer 405 will have time periods when it is actively generating the low frequency wave and time periods when it is not actively generating the low frequency wave.
- the cycle time for transducer 405 can be controlled to optimize the operation of this arrangement
- One or more transducers 420 can be arranged longitudinally within borehole 410 to generate a sequence of high frequency pulses, or “probe” pulses, contemporaneously with the low frequency wave. In some aspects, transducer 420 can operate continuously during operation of this arrangement. In some aspects, the sequence of high frequency pulses can be a compressional and/or shear wave source. Transducers 420 can be arranged to operate with a repetition rate of at least 10 times for each pump wave cycle, emits bursts of high frequency, 10-1000 times that of the pump. These high frequency pulses propagate parallel or longitudinally to borehole 410 and as both refracted and direct waves, as well as scattered waves in material 415 .
- the refracted probe pulses traveling parallel to the borehole within material 415 are of particular interest in this aspect. If the pump wave has sufficient amplitude to induce crack nonlinearity (generally greater than 10 ⁇ 6 strain amplitude, but increased effective pressure requires larger dynamic wave strain amplitudes), the pump wave will cause existing cracks or fissures in material 415 that are oriented approximately perpendicular to borehole 410 to exhibit strongly non-linear behavior in addition to any inherent non-linearity of the material itself.
- Transducer 420 can be arranged to emit a sequence of bursts or pulses to probe for nonlinearity induced by the low frequency waves generated by transducer 405 . If a crack is present it creates what is known as a softening nonlinearity.
- the softening nonlinearity is manifest by wave harmonics, but more importantly, by local changes in formation velocity during the dilatational part of the low frequency cycle from transducer 420 to receiver 425 . Changes in velocity are used to infer the presence of a crack. Normally, during the compressional phase, the wave velocity sensed by the probe pulses decreases proportionally to the amplitude and phase of the low frequency wave. In most instances, cracks and/or rocks may undergo softening nonlinearity induced by the interaction of the pump wave on the features that may experience the non-linear behavior. This means that for the pump wave minimum amplitude (zero phase, amplitude equals zero) there is no change in velocity. The velocity decrease is progressively larger as the pump wave phase approaches the compression maximum amplitude.
- the wave velocity progressively increases as the pump wave approaches maximum dilation amplitude.
- the velocity changes during the dilatational cycle are more pronounced and can be used to determine if cracks are present.
- the cracks and/or rocks may undergo a hardening nonlinearity where the low frequency compression phase causes the probe pulses to increase in speed as they traverse the features undergoing the nonlinear response.
- the velocity changes are measured relative to pulse propagation velocities measured with the low-frequency pump source silent. This measurement gives the linear wavespeed of the formation from source to receiver(s).
- One or more receivers 425 can be arranged within borehole 410 to record the vibration signal plus the ultrasonic pulses. Although four receivers are shown (Rx 1 , Rx 2 , Rx 3 Rx 4 ), this is only illustrative since more or fewer than four may be used. Receivers 425 can be locked to the borehole side or not, and individual elements of the array may record three components so that azimuth can be inferred. If more receivers are used, a longer portion of borehole 410 can be probed using the multiple receivers. In instances where more than one receiver is used, the change in wave speed and therefore the nonlinearity can be determined from successive receiver pairs. This can be done by correlating one receiver with another receiver during a pump wave cycle where each preceding receiver can be treated as a reference to obtain the nonlinearity between itself and the next receiver,
- a relative change in velocity between the presence of cracks can be determined and used to distinguish cracks from other reflecting interfaces such as formation boundaries, because only cracks create the strong nonlinear effect on velocity that depends on pump amplitude.
- the nonlinear attenuation can also be used as redundant information for inferring the presence of a crack.
- Pump wave harmonics can be used in addition to velocity and attenuation changes to aid in the determination of the presence of cracks and formation nonlinearity.
- Processing the sequence of the high frequency refracted arrival pulse signals recorded by receiver 425 can give the full elastic nonlinear response of the formation near the borehole for a given wave path.
- the signal processing requires measuring a pulse signal obtained without the vibration source. This signal gives the linear time delay and velocity of the medium since the distance between the source and receivers are known. This signal is cross-correlated with each signal of the sequence of pulse signals emitted when the vibration is in the formation.
- the correlation output gives the change in velocity with vibration pressure. Since the wave path length is known from pulse source to receivers, and assuming a medium density obtained from other borehole logging procedures, the modulus as a function of pressure can be obtained. From this pressure derivative, the total nonlinearity of the medium can be obtained by using a model, for instance the Preisach-Mayergoyz (PM) space theory of elasticity as is known in the art. Other suitable models may also be used.
- PM Preisach-Mayergoyz
- Repetition of the above steps at a given depth for different azimuths and frequencies within borehole 410 and at different depths can provide a 3D annular image of the velocity and modulus, and nonlinear velocity and modulus of the formation.
- cracks oriented perpendicular to the borehole will give a large nonlinear signature.
- This arrangement can determine all the nonlinear moduli simultaneously including the nonlinear moduli in tension and compression.
- Operation of this arrangement is similar to applying a quasistatic, progressively increasing load while time-of-flight is measured across or along the sample at each load interval.
- This allows dynamic strains (10 ⁇ 9 -10 ⁇ 5 ) to be explored and both tension and compression can be probed and the entire material nonlinearity is measured at once.
- the higher order nonlinearity is hysteretic in nature and very sensitive to the effects of fluids and mechanical damage.
- FIGS. 5 a to 5 e show an example graphic illustration of the operation of the arrangement of FIG. 4 .
- ultrasonic velocity and vibrational strain modulation are shown.
- FIG. 5 a shows an individual pulse
- FIG. 5 b shows a regular sequence of compressional high frequency pulses that can be emitted from transducer 420 . If the pump source is silent, a similar regular sequence of pulses may be recorded at any of the elements of receiver array 425 .
- FIG. 5 c shows two periods of a low frequency vibration that can be generated by the compressional source 405 .
- the portion of the vibration having a positive amplitude on the figure is a compressional phase of the vibration and the portion of the vibration have a negative amplitude is a dilatational phase of the vibration.
- the summation of the two emitted signals of FIGS. 5 b and 5 c , depicted as FIG. 5 d is recorded at receiver 425 . Since the speed of refracted waves 435 varies through the pump wave cycle, the received refracted pulses do not arrive regularly because their velocity varies with compressional and dilatational strain. Wave speed can be measured throughout a vibration cycle in both tension and compression in this manner. Similar recordings are made at the individual elements of receiver array 425 . The recorded wave train of FIG.
- 5 d may be filtered to remove the low frequency wave of 5 c , leaving the irregular pulse sequence colored black on FIG. 5 e .
- the regular pulse sequence of FIG. 5 c is shown for reference, shaded gray, to highlight the modulation of the receiver pulse sequence.
- the ultrasonic wave decreases in velocity with a minimum at the peak pump compression. The maximum velocity is measured during peak dilatation.
- the above discussion is relevant for softening nonlinearity; however, as described above, certain material may undergo hardening nonlinearity where the pump compression cause the probe pulses to increase in speed. In this hardening case, the plots would indicate velocity changes in the opposite sense. From wave speed change through a wave strain cycle, all of the nonlinear coefficients may be defined. Multiple vibration cycles provide very good accuracy and precision of the change in wave speed with strain and therefore in the determination of the nonlinear coefficients.
- the delay of each is obtained by applying cross-correlation using the reference signal TD(1).
- the wave velocity c is,
- ( 3 ) ⁇ ⁇ ⁇ M M - ⁇ ⁇ ⁇ ⁇ LF - ⁇ LF 2 - ⁇ ⁇ ( ⁇ LF + ⁇ LF ⁇ ⁇ sign ( ⁇ .
- ⁇ is the hysteretic nonlinear parameter
- ⁇ LF is the instantaneous strain of the pump wave
- ⁇ dot over ( ⁇ ) ⁇ LF is the instantaneous strain derivative with time
- ⁇ LF is the maximum strain excursion in a cycle
- ⁇ and ⁇ are the third and fourth order nonlinear coefficients, respectively
- sign( ⁇ dot over ( ⁇ ) ⁇ LF ) is from the sign of the strain derivative, and details of which can be found in Renaud, G., S. Callé, and M.
- the full nonlinearity of the near-borehole may be obtained, and by standard imaging methods that may be based on refraction of waveform migration, a nonlinear image of the near-borehole region may be obtained.
- FIGS. 6 a to 6 c show an example of received signals for the arrangement of FIG. 4 in the case of softening non-linearity.
- the material around the borehole has constant properties over the vertical extent of the receiver array 425 , and a very thin open fracture 430 crosses the borehole.
- FIG. 6 a shows an amplitude verses time plot for signals received by receiver 425 when transducer 405 is silent.
- FIG. 6 b shows an amplitude verses time plot for signals received by receiver 425 during maximum low frequency compression.
- FIG. 6 c shows an amplitude verses time plot for signals received by receiver 425 during maximum low frequency dilatation.
- the time axis is with respect to receiver Rx 1 .
- the above-described acoustic beam sources can be used for various evaluation of natural fractures, mapping of vugs, nodules or other inhomogeneities, evaluation of the presence and properties of the cement sheath between one or more casing strings and the formation around a cased well, mapping fluid invasion from the borehole and assessment of the mechanical integrity of the formation around the wellbore, in particular any alteration or localized mechanical damage caused by the near wellbore stress concentration.
Abstract
Description
where M=K+4/3μand L is propagation distance, TD the elapsed time, M, K and μ are the compressional, bulk and shear moduli, and ρ the bulk density of the medium. For small amplitude/velocity variations,
where α is the hysteretic nonlinear parameter, εLF is the instantaneous strain of the pump wave, and {dot over (ε)}LF is the instantaneous strain derivative with time, ΔεLF is the maximum strain excursion in a cycle and where β and δ are the third and fourth order nonlinear coefficients, respectively and sign({dot over (ε)}LF) is from the sign of the strain derivative, and details of which can be found in Renaud, G., S. Callé, and M. Defontaine, Remote dynamic acoustoelastic testing: Elastic and dissipative nonlinearities measured under hydrostatoc tension and compression and Van Den Abeele, K. E.-A., A. Sutin, J. Carmeliet, and P. Johnson, Micro-damage diagnostics using nonlinear elastic wave spectroscopy (NEWS), NDT&E International 34, 239-248 (2001), both of which are hereby incorporated by references in their entirety.
Claims (18)
Priority Applications (11)
| Application Number | Priority Date | Filing Date | Title |
|---|---|---|---|
| US12/893,573 US8553495B2 (en) | 2010-09-29 | 2010-09-29 | Device and method for imaging of non-linear and linear properties of formations surrounding a borehole |
| SG2013022298A SG189098A1 (en) | 2010-09-29 | 2011-09-28 | Device and method for imaging of non-linear and linear properties of formations surrounding a borehole |
| JP2013531761A JP2013545077A (en) | 2010-09-29 | 2011-09-28 | Apparatus and method for image processing of linear and non-linear characteristics of a layer surrounding a borehole |
| BR112013005705-0A BR112013005705B1 (en) | 2010-09-29 | 2011-09-28 | device and method for imaging linear and non-linear properties of formations surrounding a well |
| PCT/US2011/053645 WO2012050880A2 (en) | 2010-09-29 | 2011-09-28 | Device and method for imaging of non-linear and linear properties of formations surrounding a borehole |
| AU2011314117A AU2011314117B2 (en) | 2010-09-29 | 2011-09-28 | Device and method for imaging of non-linear and linear properties of formations surrounding a borehole |
| MX2013003144A MX2013003144A (en) | 2010-09-29 | 2011-09-28 | Device and method for imaging of non-linear and linear properties of formations surrounding a borehole. |
| EP11770259.7A EP2622379B1 (en) | 2010-09-29 | 2011-09-28 | Device and method for imaging of non-linear and linear properties of formations surrounding a borehole |
| EA201390462A EA201390462A1 (en) | 2010-09-29 | 2011-09-28 | DEVICE AND METHOD FOR VISUALIZATION OF NONLINEAR AND LINEAR PROPERTIES OF FORMATIONS AROUND THE WELLS |
| CN201180047125.4A CN103140773B (en) | 2010-09-29 | 2011-09-28 | For carrying out the apparatus and method of imaging to the non-linear and linear characteristic of boring surrounding formation |
| CA2811426A CA2811426A1 (en) | 2010-09-29 | 2011-09-28 | Device and method for imaging of non-linear and linear properties of formations surrounding a borehole |
Applications Claiming Priority (1)
| Application Number | Priority Date | Filing Date | Title |
|---|---|---|---|
| US12/893,573 US8553495B2 (en) | 2010-09-29 | 2010-09-29 | Device and method for imaging of non-linear and linear properties of formations surrounding a borehole |
Publications (2)
| Publication Number | Publication Date |
|---|---|
| US20120075952A1 US20120075952A1 (en) | 2012-03-29 |
| US8553495B2 true US8553495B2 (en) | 2013-10-08 |
Family
ID=45870539
Family Applications (1)
| Application Number | Title | Priority Date | Filing Date |
|---|---|---|---|
| US12/893,573 Active 2031-12-02 US8553495B2 (en) | 2010-09-29 | 2010-09-29 | Device and method for imaging of non-linear and linear properties of formations surrounding a borehole |
Country Status (1)
| Country | Link |
|---|---|
| US (1) | US8553495B2 (en) |
Cited By (4)
| Publication number | Priority date | Publication date | Assignee | Title |
|---|---|---|---|---|
| CN109343120A (en) * | 2018-10-17 | 2019-02-15 | 吉林大学 | Incorporate the sound wave curve reconstructing method of constrained sparse spike inversion inverting low-frequency compensation |
| US11079505B2 (en) | 2016-03-09 | 2021-08-03 | Triad National Security, Llc | Time-reversed nonlinear acoustics for downhole pressure measurements |
| US11086040B2 (en) * | 2016-03-09 | 2021-08-10 | Triad National Security, Llc | Time-reversed nonlinear acoustics for wellbore integrity characterization |
| US11346204B2 (en) | 2018-01-25 | 2022-05-31 | Wellguard As | Tool, system and a method for determining barrier and material quality behind multiple tubulars in a hydrocarbon wellbore |
Families Citing this family (4)
| Publication number | Priority date | Publication date | Assignee | Title |
|---|---|---|---|---|
| US20140321240A1 (en) * | 2013-04-26 | 2014-10-30 | Siemens Medical Solutions Usa, Inc. | Elastography for cement integrity inspection |
| US10094945B2 (en) * | 2014-03-24 | 2018-10-09 | Baker Hughes, A Ge Company, Llc | Formation measurements using nonlinear guided waves |
| WO2017106724A1 (en) | 2015-12-17 | 2017-06-22 | Seismos Inc. | Method for evaluating and monitoring formation fracture treatment using fluid pressure waves |
| US10684384B2 (en) * | 2017-05-24 | 2020-06-16 | Baker Hughes, A Ge Company, Llc | Systems and method for formation evaluation from borehole |
Citations (21)
| Publication number | Priority date | Publication date | Assignee | Title |
|---|---|---|---|---|
| US3302745A (en) | 1964-02-06 | 1967-02-07 | Ikrath Kurt | Generation and reception of low frequency seismic waves |
| US3974476A (en) | 1975-04-25 | 1976-08-10 | Shell Oil Company | Highly-directional acoustic source for use in borehole surveys |
| SU913303A1 (en) | 1978-07-25 | 1982-03-15 | Volzh Otdel I Geol Razrabotki | Method and device for acoustic well-logging |
| US4382290A (en) | 1977-07-11 | 1983-05-03 | Schlumberger Technology Corporation | Apparatus for acoustically investigating a borehole |
| US4383308A (en) * | 1980-12-29 | 1983-05-10 | Mobil Oil Corporation | Acoustic well logging device for detecting shear and compressional waves |
| US4852067A (en) * | 1983-05-31 | 1989-07-25 | Schlumberger Well Services | Low frequency sonic logging |
| US4888740A (en) * | 1984-12-26 | 1989-12-19 | Schlumberger Technology Corporation | Differential energy acoustic measurements of formation characteristic |
| US5144590A (en) | 1991-08-08 | 1992-09-01 | B P America, Inc. | Bed continuity detection and analysis using crosswell seismic data |
| US5331604A (en) * | 1990-04-20 | 1994-07-19 | Schlumberger Technology Corporation | Methods and apparatus for discrete-frequency tube-wave logging of boreholes |
| US5398215A (en) * | 1993-11-19 | 1995-03-14 | Schlumberger Technology Corporation | Identification of stress induced anisotropy in formations |
| US5475650A (en) * | 1993-11-19 | 1995-12-12 | Schlumberger Technology Corporation | Measurement of nonlinear properties of formation using sonic borehole tool while changing pressure in borehole |
| US5521882A (en) | 1993-11-19 | 1996-05-28 | Schlumberger Technology Corporation | Measurement of formation characteristics using acoustic borehole tool having sources of different frequencies |
| US5719823A (en) | 1996-07-08 | 1998-02-17 | Lucent Technologies Inc. | Ground penetrating sonar |
| US5838633A (en) * | 1997-01-27 | 1998-11-17 | Schlumberger Technology Corporation | Method for estimating formation in-situ stress magnitudes using a sonic borehole tool |
| US6009043A (en) | 1996-08-30 | 1999-12-28 | Western Atlas International, Inc. | Cross-well connectivity mapping including separation of compressional and shear wave energy |
| US6175536B1 (en) | 1997-05-01 | 2001-01-16 | Western Atlas International, Inc. | Cross-well seismic mapping method for determining non-linear properties of earth formations between wellbores |
| US6216540B1 (en) | 1995-06-06 | 2001-04-17 | Robert S. Nelson | High resolution device and method for imaging concealed objects within an obscuring medium |
| EP1122558A1 (en) | 2000-02-01 | 2001-08-08 | Institut Francais Du Petrole | Vibrator and method for the exploration of a material medium by elastic vibrations of very low frequency |
| US6440075B1 (en) | 2000-10-02 | 2002-08-27 | Koninklijke Philips Electronics N.V. | Ultrasonic diagnostic imaging of nonlinearly intermodulated and harmonic frequency components |
| US6704247B1 (en) | 2003-03-24 | 2004-03-09 | The United States Of America As Represented By The Secretary Of The Navy | High efficiency parametric sonar |
| GB2404983A (en) | 2003-08-13 | 2005-02-16 | Baker Hughes Inc | Generating directional low frequency acoustic signals for well logging |
-
2010
- 2010-09-29 US US12/893,573 patent/US8553495B2/en active Active
Patent Citations (23)
| Publication number | Priority date | Publication date | Assignee | Title |
|---|---|---|---|---|
| US3302745A (en) | 1964-02-06 | 1967-02-07 | Ikrath Kurt | Generation and reception of low frequency seismic waves |
| US3974476A (en) | 1975-04-25 | 1976-08-10 | Shell Oil Company | Highly-directional acoustic source for use in borehole surveys |
| US4382290A (en) | 1977-07-11 | 1983-05-03 | Schlumberger Technology Corporation | Apparatus for acoustically investigating a borehole |
| SU913303A1 (en) | 1978-07-25 | 1982-03-15 | Volzh Otdel I Geol Razrabotki | Method and device for acoustic well-logging |
| US4383308A (en) * | 1980-12-29 | 1983-05-10 | Mobil Oil Corporation | Acoustic well logging device for detecting shear and compressional waves |
| US4852067A (en) * | 1983-05-31 | 1989-07-25 | Schlumberger Well Services | Low frequency sonic logging |
| US4888740A (en) * | 1984-12-26 | 1989-12-19 | Schlumberger Technology Corporation | Differential energy acoustic measurements of formation characteristic |
| US5331604A (en) * | 1990-04-20 | 1994-07-19 | Schlumberger Technology Corporation | Methods and apparatus for discrete-frequency tube-wave logging of boreholes |
| US5144590A (en) | 1991-08-08 | 1992-09-01 | B P America, Inc. | Bed continuity detection and analysis using crosswell seismic data |
| US5475650A (en) * | 1993-11-19 | 1995-12-12 | Schlumberger Technology Corporation | Measurement of nonlinear properties of formation using sonic borehole tool while changing pressure in borehole |
| US5521882A (en) | 1993-11-19 | 1996-05-28 | Schlumberger Technology Corporation | Measurement of formation characteristics using acoustic borehole tool having sources of different frequencies |
| US5398215A (en) * | 1993-11-19 | 1995-03-14 | Schlumberger Technology Corporation | Identification of stress induced anisotropy in formations |
| US6216540B1 (en) | 1995-06-06 | 2001-04-17 | Robert S. Nelson | High resolution device and method for imaging concealed objects within an obscuring medium |
| US5719823A (en) | 1996-07-08 | 1998-02-17 | Lucent Technologies Inc. | Ground penetrating sonar |
| US6009043A (en) | 1996-08-30 | 1999-12-28 | Western Atlas International, Inc. | Cross-well connectivity mapping including separation of compressional and shear wave energy |
| US5838633A (en) * | 1997-01-27 | 1998-11-17 | Schlumberger Technology Corporation | Method for estimating formation in-situ stress magnitudes using a sonic borehole tool |
| US6175536B1 (en) | 1997-05-01 | 2001-01-16 | Western Atlas International, Inc. | Cross-well seismic mapping method for determining non-linear properties of earth formations between wellbores |
| EP1122558A1 (en) | 2000-02-01 | 2001-08-08 | Institut Francais Du Petrole | Vibrator and method for the exploration of a material medium by elastic vibrations of very low frequency |
| US6440075B1 (en) | 2000-10-02 | 2002-08-27 | Koninklijke Philips Electronics N.V. | Ultrasonic diagnostic imaging of nonlinearly intermodulated and harmonic frequency components |
| US6704247B1 (en) | 2003-03-24 | 2004-03-09 | The United States Of America As Represented By The Secretary Of The Navy | High efficiency parametric sonar |
| GB2404983A (en) | 2003-08-13 | 2005-02-16 | Baker Hughes Inc | Generating directional low frequency acoustic signals for well logging |
| US7301852B2 (en) | 2003-08-13 | 2007-11-27 | Baker Hughes Incorporated | Methods of generating directional low frequency acoustic signals and reflected signal detection enhancements for seismic while drilling applications |
| US7463551B2 (en) | 2003-08-13 | 2008-12-09 | Baker Hughes Incorporated | Method of generating directional low frequency acoustic signals and reflected signal detection enhancements for seismic while drilling applications |
Non-Patent Citations (10)
| Title |
|---|
| D.A. Kas'Yanov et al: "Nonlinear Acoustic Logging," XI Session of the Russian Acoustical Society, Jan. 1, 2001, pp. 361-364, XP55039034. |
| International Preliminary Search Report and Written Opinion, regarding PCT/US2011/053645, mailed Mar. 15, 2013, 23 pages. |
| International Search Report and Written Opinion for PCT International Patent Application No. PCT/US2009/047184, mailed Dec. 21, 2009. |
| International Search Report and Written Opinion for PCT International Patent Application No. PCT/US2009/047934 mailed Dec. 1, 2009. |
| International Search Report and Written Opinion, regarding PCT/US2011/053645, mailed Oct. 9, 2012, 15 pages. |
| Johnson et al., "Nonlinear Generation of Elastic Waves in Crystalline Rock", Journal of Geophysical Research, vol. 92, No. B5, Apr. 10, 1987, pp. 3597-3602. |
| Johnson et al., "Nonlinear Generation of Elastic Waves in Granite and Sandstone: Continuous Wave and Travel Time Observations", Journal of Geophysical Research, vol. 94, No. B12, Dec. 10, 1989, pp. 17,729-17,733. |
| Jones et al., "Interaction of Elastic Waves in an Isotropic Solid", The Journal of the Acoustical Society of America, vol. 35, No. 1, Jan. 1963, pp. 5-10. |
| Ostrovsky et al., "Dynamic Nonlinear Elasticity in Geomaterials", Rivista del Nuovo Cimento, vol. 24, No. 7., 2001. |
| Westervelt, "Parametric Acoustic Array", The Journal of the Acoustical Society of America, vol. 35, No. 4, Apr. 1963, pp. 535-537. |
Cited By (5)
| Publication number | Priority date | Publication date | Assignee | Title |
|---|---|---|---|---|
| US11079505B2 (en) | 2016-03-09 | 2021-08-03 | Triad National Security, Llc | Time-reversed nonlinear acoustics for downhole pressure measurements |
| US11086040B2 (en) * | 2016-03-09 | 2021-08-10 | Triad National Security, Llc | Time-reversed nonlinear acoustics for wellbore integrity characterization |
| US11346204B2 (en) | 2018-01-25 | 2022-05-31 | Wellguard As | Tool, system and a method for determining barrier and material quality behind multiple tubulars in a hydrocarbon wellbore |
| CN109343120A (en) * | 2018-10-17 | 2019-02-15 | 吉林大学 | Incorporate the sound wave curve reconstructing method of constrained sparse spike inversion inverting low-frequency compensation |
| CN109343120B (en) * | 2018-10-17 | 2019-10-01 | 吉林大学 | Incorporate the sound wave curve reconstructing method of constrained sparse spike inversion inverting low-frequency compensation |
Also Published As
| Publication number | Publication date |
|---|---|
| US20120075952A1 (en) | 2012-03-29 |
Similar Documents
| Publication | Publication Date | Title |
|---|---|---|
| US8576661B2 (en) | Device and method for imaging of non-linear and linear properties of formations surrounding a borehole | |
| US8553495B2 (en) | Device and method for imaging of non-linear and linear properties of formations surrounding a borehole | |
| EP2622379B1 (en) | Device and method for imaging of non-linear and linear properties of formations surrounding a borehole | |
| US20200109627A1 (en) | Method for evaluating and monitoring formation fracture treatment using fluid pressure waves | |
| Hevin et al. | Characterization of surface cracks with Rayleigh waves: a numerical model | |
| US9822627B2 (en) | Systems and methods for downhole cement evaluation | |
| CA2706297A1 (en) | Method and system for evaluating the characteristic properties of two contacting media and of the interface between them based on mixed surface waves propagating along the interface | |
| US11067711B2 (en) | Time-reversed nonlinear acoustic downhole pore pressure measurements | |
| CN109563736A (en) | The estimation of horizontal stress and nonlinear constant in the anisotropic formation of interlayer carbonate horizon in such as organic shale reservoir | |
| US11086040B2 (en) | Time-reversed nonlinear acoustics for wellbore integrity characterization | |
| JP2000035483A (en) | Imaging method of water permeability in deposit and ground structure containing underground fluid, and measuring method of physical characteristic of medium | |
| US6061300A (en) | Method of imaging the permeability and fluid content structure within sediment | |
| Nabipour | Experimental and numerical study of ultrasonic monitoring of hydraulic fracture propagation | |
| JP5517258B2 (en) | Q factor measurement method using vertical array seismometer | |
| Williams et al. | Integrated geomechanical interpretation of hydraulic stimulation operations using distributed vibration sensing | |
| Ahmad | Piezoelectric device for measuring shear wave velocity of soils and evaluation of low and high strain shear modulus | |
| Kuvshinov et al. | Non-linear interaction of elastic waves in rocks | |
| Shkuratnik et al. | Ultrasonic correlation logging for roof rock structure diagnostics | |
| Parra | Analysis of elastic wave propagation in stratified fluid‐filled porous media for interwell seismic applications | |
| Sinha et al. | Hydraulic fracture characterization using cased-hole sonic data | |
| Pasquet et al. | Laser-Doppler acoustic probing of granular media with varying water levels | |
| RU2439317C1 (en) | Evaluation method and system of characteristic properties of two contacting media and boundary surface between them considering mixed surface waves propagating along their boundary surface | |
| Radtke et al. | Low-frequency drill bit seismic while drilling | |
| Nourifard et al. | Laser Doppler Interferometry as a receiver of the ultrasonic waves: An experimental study on Gosford sandstone | |
| Zaslavskiĭ et al. | Experimental analysis of flexural waves in river ice |
Legal Events
| Date | Code | Title | Description |
|---|---|---|---|
| AS | Assignment |
Owner name: CHEVRON U.S.A. INC., CALIFORNIA Free format text: ASSIGNMENT OF ASSIGNORS INTEREST;ASSIGNORS:JOHNSON, PAUL ALLAN;TENCATE, JAMES A.;LE BAS, PIERRE-YVES;AND OTHERS;SIGNING DATES FROM 20100924 TO 20100929;REEL/FRAME:025062/0716 |
|
| AS | Assignment |
Owner name: U.S. DEPARTMENT OF ENERGY, DISTRICT OF COLUMBIA Free format text: CONFIRMATORY LICENSE;ASSIGNOR:LOS ALAMOS NATIONAL SECURITY;REEL/FRAME:028086/0217 Effective date: 20120313 |
|
| FEPP | Fee payment procedure |
Free format text: PAYOR NUMBER ASSIGNED (ORIGINAL EVENT CODE: ASPN); ENTITY STATUS OF PATENT OWNER: LARGE ENTITY |
|
| STCF | Information on status: patent grant |
Free format text: PATENTED CASE |
|
| FPAY | Fee payment |
Year of fee payment: 4 |
|
| AS | Assignment |
Owner name: TRIAD NATIONAL SECURITY, LLC, NEW MEXICO Free format text: ASSIGNMENT OF ASSIGNORS INTEREST;ASSIGNOR:LOS ALAMOS NATIONAL SECURITY, LLC;REEL/FRAME:047485/0103 Effective date: 20181101 |
|
| AS | Assignment |
Owner name: TRIAD NATIONAL SECURITY, LLC, NEW MEXICO Free format text: ASSIGNMENT OF ASSIGNORS INTEREST;ASSIGNOR:CHEVRON U.S.A INC.;REEL/FRAME:048155/0044 Effective date: 20190124 |
|
| MAFP | Maintenance fee payment |
Free format text: PAYMENT OF MAINTENANCE FEE, 8TH YEAR, LARGE ENTITY (ORIGINAL EVENT CODE: M1552); ENTITY STATUS OF PATENT OWNER: LARGE ENTITY Year of fee payment: 8 |