US8806519B2 - Method to evaluate the geographic popularity of geographically located user-generated content items - Google Patents
Method to evaluate the geographic popularity of geographically located user-generated content items Download PDFInfo
- Publication number
- US8806519B2 US8806519B2 US13/358,982 US201213358982A US8806519B2 US 8806519 B2 US8806519 B2 US 8806519B2 US 201213358982 A US201213358982 A US 201213358982A US 8806519 B2 US8806519 B2 US 8806519B2
- Authority
- US
- United States
- Prior art keywords
- user
- content item
- media content
- generated media
- geographic
- Prior art date
- Legal status (The legal status is an assumption and is not a legal conclusion. Google has not performed a legal analysis and makes no representation as to the accuracy of the status listed.)
- Active
Links
Images


Classifications
-
- H—ELECTRICITY
- H04—ELECTRIC COMMUNICATION TECHNIQUE
- H04N—PICTORIAL COMMUNICATION, e.g. TELEVISION
- H04N21/00—Selective content distribution, e.g. interactive television or video on demand [VOD]
- H04N21/40—Client devices specifically adapted for the reception of or interaction with content, e.g. set-top-box [STB]; Operations thereof
- H04N21/43—Processing of content or additional data, e.g. demultiplexing additional data from a digital video stream; Elementary client operations, e.g. monitoring of home network or synchronising decoder's clock; Client middleware
- H04N21/442—Monitoring of processes or resources, e.g. detecting the failure of a recording device, monitoring the downstream bandwidth, the number of times a movie has been viewed, the storage space available from the internal hard disk
- H04N21/44204—Monitoring of content usage, e.g. the number of times a movie has been viewed, copied or the amount which has been watched
-
- G—PHYSICS
- G06—COMPUTING; CALCULATING OR COUNTING
- G06F—ELECTRIC DIGITAL DATA PROCESSING
- G06F16/00—Information retrieval; Database structures therefor; File system structures therefor
- G06F16/90—Details of database functions independent of the retrieved data types
- G06F16/95—Retrieval from the web
- G06F16/953—Querying, e.g. by the use of web search engines
- G06F16/9537—Spatial or temporal dependent retrieval, e.g. spatiotemporal queries
-
- G—PHYSICS
- G06—COMPUTING; CALCULATING OR COUNTING
- G06Q—INFORMATION AND COMMUNICATION TECHNOLOGY [ICT] SPECIALLY ADAPTED FOR ADMINISTRATIVE, COMMERCIAL, FINANCIAL, MANAGERIAL OR SUPERVISORY PURPOSES; SYSTEMS OR METHODS SPECIALLY ADAPTED FOR ADMINISTRATIVE, COMMERCIAL, FINANCIAL, MANAGERIAL OR SUPERVISORY PURPOSES, NOT OTHERWISE PROVIDED FOR
- G06Q30/00—Commerce
- G06Q30/02—Marketing; Price estimation or determination; Fundraising
-
- H—ELECTRICITY
- H04—ELECTRIC COMMUNICATION TECHNIQUE
- H04L—TRANSMISSION OF DIGITAL INFORMATION, e.g. TELEGRAPHIC COMMUNICATION
- H04L67/00—Network arrangements or protocols for supporting network services or applications
- H04L67/50—Network services
- H04L67/52—Network services specially adapted for the location of the user terminal
-
- H—ELECTRICITY
- H04—ELECTRIC COMMUNICATION TECHNIQUE
- H04N—PICTORIAL COMMUNICATION, e.g. TELEVISION
- H04N21/00—Selective content distribution, e.g. interactive television or video on demand [VOD]
- H04N21/20—Servers specifically adapted for the distribution of content, e.g. VOD servers; Operations thereof
- H04N21/25—Management operations performed by the server for facilitating the content distribution or administrating data related to end-users or client devices, e.g. end-user or client device authentication, learning user preferences for recommending movies
- H04N21/251—Learning process for intelligent management, e.g. learning user preferences for recommending movies
- H04N21/252—Processing of multiple end-users' preferences to derive collaborative data
-
- H—ELECTRICITY
- H04—ELECTRIC COMMUNICATION TECHNIQUE
- H04N—PICTORIAL COMMUNICATION, e.g. TELEVISION
- H04N21/00—Selective content distribution, e.g. interactive television or video on demand [VOD]
- H04N21/20—Servers specifically adapted for the distribution of content, e.g. VOD servers; Operations thereof
- H04N21/25—Management operations performed by the server for facilitating the content distribution or administrating data related to end-users or client devices, e.g. end-user or client device authentication, learning user preferences for recommending movies
- H04N21/254—Management at additional data server, e.g. shopping server, rights management server
-
- H—ELECTRICITY
- H04—ELECTRIC COMMUNICATION TECHNIQUE
- H04N—PICTORIAL COMMUNICATION, e.g. TELEVISION
- H04N21/00—Selective content distribution, e.g. interactive television or video on demand [VOD]
- H04N21/20—Servers specifically adapted for the distribution of content, e.g. VOD servers; Operations thereof
- H04N21/25—Management operations performed by the server for facilitating the content distribution or administrating data related to end-users or client devices, e.g. end-user or client device authentication, learning user preferences for recommending movies
- H04N21/258—Client or end-user data management, e.g. managing client capabilities, user preferences or demographics, processing of multiple end-users preferences to derive collaborative data
- H04N21/25808—Management of client data
- H04N21/25841—Management of client data involving the geographical location of the client
-
- H—ELECTRICITY
- H04—ELECTRIC COMMUNICATION TECHNIQUE
- H04N—PICTORIAL COMMUNICATION, e.g. TELEVISION
- H04N21/00—Selective content distribution, e.g. interactive television or video on demand [VOD]
- H04N21/20—Servers specifically adapted for the distribution of content, e.g. VOD servers; Operations thereof
- H04N21/25—Management operations performed by the server for facilitating the content distribution or administrating data related to end-users or client devices, e.g. end-user or client device authentication, learning user preferences for recommending movies
- H04N21/258—Client or end-user data management, e.g. managing client capabilities, user preferences or demographics, processing of multiple end-users preferences to derive collaborative data
- H04N21/25866—Management of end-user data
- H04N21/25891—Management of end-user data being end-user preferences
-
- H—ELECTRICITY
- H04—ELECTRIC COMMUNICATION TECHNIQUE
- H04N—PICTORIAL COMMUNICATION, e.g. TELEVISION
- H04N21/00—Selective content distribution, e.g. interactive television or video on demand [VOD]
- H04N21/20—Servers specifically adapted for the distribution of content, e.g. VOD servers; Operations thereof
- H04N21/27—Server based end-user applications
- H04N21/274—Storing end-user multimedia data in response to end-user request, e.g. network recorder
- H04N21/2743—Video hosting of uploaded data from client
-
- H—ELECTRICITY
- H04—ELECTRIC COMMUNICATION TECHNIQUE
- H04N—PICTORIAL COMMUNICATION, e.g. TELEVISION
- H04N21/00—Selective content distribution, e.g. interactive television or video on demand [VOD]
- H04N21/40—Client devices specifically adapted for the reception of or interaction with content, e.g. set-top-box [STB]; Operations thereof
- H04N21/41—Structure of client; Structure of client peripherals
- H04N21/422—Input-only peripherals, i.e. input devices connected to specially adapted client devices, e.g. global positioning system [GPS]
- H04N21/42202—Input-only peripherals, i.e. input devices connected to specially adapted client devices, e.g. global positioning system [GPS] environmental sensors, e.g. for detecting temperature, luminosity, pressure, earthquakes
-
- H—ELECTRICITY
- H04—ELECTRIC COMMUNICATION TECHNIQUE
- H04N—PICTORIAL COMMUNICATION, e.g. TELEVISION
- H04N21/00—Selective content distribution, e.g. interactive television or video on demand [VOD]
- H04N21/40—Client devices specifically adapted for the reception of or interaction with content, e.g. set-top-box [STB]; Operations thereof
- H04N21/43—Processing of content or additional data, e.g. demultiplexing additional data from a digital video stream; Elementary client operations, e.g. monitoring of home network or synchronising decoder's clock; Client middleware
- H04N21/442—Monitoring of processes or resources, e.g. detecting the failure of a recording device, monitoring the downstream bandwidth, the number of times a movie has been viewed, the storage space available from the internal hard disk
- H04N21/44213—Monitoring of end-user related data
- H04N21/44222—Analytics of user selections, e.g. selection of programs or purchase activity
- H04N21/44224—Monitoring of user activity on external systems, e.g. Internet browsing
-
- H—ELECTRICITY
- H04—ELECTRIC COMMUNICATION TECHNIQUE
- H04N—PICTORIAL COMMUNICATION, e.g. TELEVISION
- H04N21/00—Selective content distribution, e.g. interactive television or video on demand [VOD]
- H04N21/40—Client devices specifically adapted for the reception of or interaction with content, e.g. set-top-box [STB]; Operations thereof
- H04N21/45—Management operations performed by the client for facilitating the reception of or the interaction with the content or administrating data related to the end-user or to the client device itself, e.g. learning user preferences for recommending movies, resolving scheduling conflicts
- H04N21/4508—Management of client data or end-user data
- H04N21/4524—Management of client data or end-user data involving the geographical location of the client
-
- H—ELECTRICITY
- H04—ELECTRIC COMMUNICATION TECHNIQUE
- H04N—PICTORIAL COMMUNICATION, e.g. TELEVISION
- H04N21/00—Selective content distribution, e.g. interactive television or video on demand [VOD]
- H04N21/60—Network structure or processes for video distribution between server and client or between remote clients; Control signalling between clients, server and network components; Transmission of management data between server and client, e.g. sending from server to client commands for recording incoming content stream; Communication details between server and client
- H04N21/65—Transmission of management data between client and server
- H04N21/658—Transmission by the client directed to the server
- H04N21/6582—Data stored in the client, e.g. viewing habits, hardware capabilities, credit card number
-
- H—ELECTRICITY
- H04—ELECTRIC COMMUNICATION TECHNIQUE
- H04N—PICTORIAL COMMUNICATION, e.g. TELEVISION
- H04N21/00—Selective content distribution, e.g. interactive television or video on demand [VOD]
- H04N21/80—Generation or processing of content or additional data by content creator independently of the distribution process; Content per se
- H04N21/83—Generation or processing of protective or descriptive data associated with content; Content structuring
- H04N21/84—Generation or processing of descriptive data, e.g. content descriptors
Definitions
- Embodiments of the present invention relate to the field of shared content hosting platforms and, more particularly, to a mechanism to evaluate the geographic popularity of geographically-located user-generated content.
- Geographic relevance of a video may be a powerful factor impacting video popularity. For instance, topics like sports, politics, and news tend to have a spatial focus of interest. In addition, language and culture also tend to constrain the propagation of videos to a global audience. As such, the geographic scope of a video might well be constrained to web users in a limited geographic region. Furthermore, geographic locality also has an impact on systems and infrastructure. Understanding how and where users watch videos on video sharing platforms is useful across several domains, such as building predictive modules of user interest and recommending systems. In a similar way, geographic locality can impact geographically distributed content delivery systems and data centers.
- Some video sharing platforms have provided technology that allows users of the video sharing platform to see video views broken down by country. However, these technologies do not take into consideration the geographic location attached to the video itself or the popularity of the video locally versus globally.
- a method to evaluate the geographic popularity of geographically-located user-generated content includes receiving a user-generated content item having metadata indicating a geographic location of the user-generated content item and determining geographic location metadata of each of a plurality of views of the content item. The method further includes calculating a view geographic entropy of the content item by dividing the plurality of views across multiple geographic regions while taking into account the geographic location of the content item. Lastly, the method includes providing the calculated view geographic entropy of the content item for presentation in a visual display that is part of an analytical report of the content item.
- the view geographic entropy of the content item is equal to ⁇ i (v i /V) log (v i /V*d i )), where v i is a number of views received in a particular region i, V is a total number of views for the content item overall, and d i is a distance between the geographic location of the content item and a location of a geographic region associated with the number of views in v i .
- the view geographic entropy may be used to classify the content item on a scale that ranges from a highly global content item to a highly local content item, where highly global indicates the content item has a consistent popularity through multiple geographic regions and highly local indicates the content item has a high popularity in a single geographic region.
- computing devices for performing the operations of the above described embodiments are also implemented.
- a computer readable storage media stores methods for performing the operations of the above described embodiments.
- FIG. 1 illustrates an exemplary system architecture, in accordance with one embodiment of the present invention.
- FIGS. 2A and 2B illustrate a trends graphical user interface (GUI) presented to a user, in accordance with one embodiment of the present invention.
- GUI graphical user interface
- FIG. 3 illustrate an individual content item view GUI presented to a user, in accordance with another embodiment of the present invention.
- FIG. 4 is a flow diagram illustrating one embodiment for a method of tracking geographic popularity of geographically-located user-generated content.
- FIG. 5 is a flow diagram illustrating another embodiment for a method of comparing geographic popularity of geographically-located user-generated content.
- FIG. 6 is a flow diagram illustrating another embodiment for a method of displaying geographic popularity of geographically-located user-generated content.
- FIG. 7 is a block diagram of an exemplary computer system that may perform one or more of the operations described herein.
- a mechanism to evaluate the geographic popularity of geographically-located user-generated content is described.
- User-generated content items experience a wide range of popularity when shared via an online sharing platform, with requests sometimes coming from all over the world. Often times, a geographic location is attached to the user-generated content items.
- Embodiments of the invention present a system and methods to evaluate the geographic popularity of these user-generated content items in order to provide additional analytics about the content items when sharing these items on a shared content hosting platform.
- a method to evaluate the geographic popularity of geographically-located user-generated content includes receiving a user-generated content item having metadata that indicates a geographic location of the user-generate content item. The method then determines geographic location metadata for each view of the content item. Then, the method calculates a view geographic entropy metric of the content item. The view geographic entropy metric is calculated by dividing the views of the content item across multiple geographic regions, while taking into account the geographic location of the content item. Lastly, the method provides the calculated view geographic entropy of the content item for presentation in a visual display. In some embodiments, the visual display is part of an analytical report of the content item presented to an end user of a shared content hosting platform via a user interface (UI).
- UI user interface
- user-generated content is referred to in terms of videos.
- embodiments of the invention are also equally applicable to other types of user-generated content such as photos, documents, music, and any other type of media a user may generate.
- FIG. 1 illustrates an exemplary system architecture 100 , in accordance with one embodiment of the present invention.
- System 100 comprises a shared content hosting platform 107 including front-end server 110 , an analytic server 120 , a search engine 130 , and a content database 140 .
- client/user devices 105 are in communication over a network 102 with the shared content hosting platform 107 via front-end server 110 .
- the network 102 may comprise the Internet in one embodiment. In other embodiments, other networks, wired and wireless, such as an intranet, local area network (LAN), wide area network (WAN), cellular network or broadcast network may be used.
- LAN local area network
- WAN wide area network
- broadcast network may be used.
- the client/user device 105 may be any type of computing device, for example, a device including a processor, a computer-readable medium, and a memory.
- the client/user device 105 may be executing a browser application or other application adapted to communicate over Internet-related protocols (e.g., TCP/IP and HTTP) and/or display a user interface. While only a single client/user device 105 is shown in FIG. 1 , system 100 may support a large number of concurrent sessions with many client/user devices 105 .
- embodiments of the invention may operate within a single server device or on multiple server devices.
- front-end server 110 analytic server 120 , search engine 130 , and content database 140 are depicted in FIG. 1 as single, disparate components, these components may be implemented together in a single device or networked in various combinations of multiple different devices that operate together.
- Examples of devices may include, but are not limited to, servers, mainframe computers, networked computers, process-based devices, and similar type of systems and devices.
- a user accesses shared content hosting platform 107 via client/user device 105 over network 102 .
- the front-end server 110 receives communications from the client/user device 105 , and processes and/or directs these communications accordingly.
- the front-end server 110 comprises a processing device and a computer-readable memory.
- Front-end server 110 is communicably coupled to analytic server 120 and search engine 130 .
- Analytic server 120 and search engine 130 may be implemented in hardware, software, firmware, or any combination of the above.
- Front-end server 110 , analytic server 120 , and search engine 130 may operate in combination to provide a shared content hosting platform 107 to end users, such as a user utilizing client/user device 105 .
- the end users may upload a variety of content to the shared content hosting platform 107 to share with other ends users via the shared content hosting platform.
- analytic server 120 provides geographic popularity statistics to front-end server 110 as part of a user interface (UI) displayed to a user of client/user device 105 .
- the user may request a particular user-generated content item from shared content hosting platform 107 via a Uniform Resource Locator (URL) link for that content item.
- URL Uniform Resource Locator
- the URL may be directly entered by the user or the result of a search for the content item by the user.
- the request for the content item is then forwarded by front-end server 110 to search engine 130 , which retrieves the requested content item from content database 140 .
- a user may directly utilize an analytic service of the shared content hosting platform 107 .
- the analytic service may provide a user detailed statistics about content items that the users queries to the analytic service.
- analytic server 120 provides the operations and functions for the analytic service of shared content hosting platform 107 .
- the shared content hosting platform 107 notifies users of the types of information that are stored by the shared content hosting platform 107 and analyzed by analytic server 120 , and provides the user the opportunity to opt-out of having such information collected and/or shared with the server.
- the analytic server 120 may perform various assessments of metadata 150 associated with the retrieved content to create detailed statistics regarding the content. In one embodiment, analytic server 120 performs an assessment of the user-generated content metadata 150 to determine the geographic popularity of the content with regard to the geographic location of the content.
- the metadata 150 of a content item stored in content database 140 includes a geographic location of the content item.
- the geographic location may include where the item was created, where the item was uploaded, and/or the location of the content depicted in the item.
- the geographic location may be directly provided by the user uploading the content item.
- the geographic location may be inferred by the Internet Protocol (IP) address of the user when they uploaded the content item.
- IP Internet Protocol
- each content item also has associated view history data.
- the view history data may include, for each view of the content item, a time and date of a view of the content item, an IP address associated with the view, a duration of the view, and other view data as relevant to the type of content item. For instance, if the content item is a video, then the view data may include any time markers within the content item where the viewer paused, rewound, or forwarded the video, as authorized by the user. The view data could also include time markers indicating when the viewer closed out of the content item.
- the view history data may be stored with the metadata 150 associated with the content item. In another embodiment, view history data for content items are kept in storage separate from the content and its associated metadata.
- the geographic location data of a content item and the view history data of the content item are utilized by the analytic server 120 to determine the geographic popularity of the content with regard to the geographic location of the content.
- the analytic server 120 uses this data, for any content item, it is possible to define measures that summarize whether requests are coming from locations close to the item itself or from further away.
- Embodiments of the invention consider how the view requests for the content item can be divided across spatial regions, in order to take into account the geographic distance between those regions and the location of the content item itself.
- Item 1 receives 20 views from Boston and 80 views from Los Angeles (as determined from the view history data of that content item).
- Item 2 receives 50 views from New York City, 40 views from Boston, 5 views from London, and 5 views from Paris.
- Each item receives the same number of total views (100), but varies greatly in the geographic dispersion of these views.
- the analytic server 120 of embodiments of the invention may associate measures to these two items to highlight that Item 2 receives more views from places nearby its geographic location, or that Item 1 receives views from a less geographically diverse set of locations.
- Embodiments of the invention provide metrics that indicate whether a content item is popular in a confined geographic area or rather around the world, taking into account the item's geographic location.
- the measures of an individual content item may be compared with the average value of the same measures for items within a certain distance of the item itself.
- the following description provides a listing of formulas that the analytic server 120 may apply to content item data, such as geographic location metadata and view history data, to determine the geographic measures utilized in embodiments of the invention.
- i geographic area (e.g., region, country, or city)
- d i distance between the geographic location of the item and the location of the geographic region i
- Total Views (V): V ⁇ i v i
- the formula for Total Views, V measures total number of views of a content item.
- View Distance (D): D 1/ V ⁇ i v i *di
- the formula for View Distance, D measures the average distance between the view locations and the item location, which can generally represent how an item receives views from distant regions.
- View Locality (L): L 1 /V ⁇ i v i /di
- the formula for View Locality, L measures how an item receives views from distant places by applying more weight to views coming from places nearby and less weight to views coming from distant regions.
- View Entropy (H): H ⁇ i v i /V log ( v i /( V*d i ) The formula for View Entropy, H, measures how views are spread across different regions, without considering the geographic location of the item.
- View Geographic Entropy (G): G ⁇ i v i /V log ( v i /( V*d i )) The formula for View Geographic Entropy, G, measures how views are spread across different regions, while taking into account the geographic location of the content item.
- the analytic server 120 may determine a variety of metrics with regard to a content item's geographic diversity. In embodiments of the invention, the analytic server 120 may then provide these metrics to the front-end server to present to an end user in a variety of different formats.
- FIGS. 2A , 2 B, and 3 depict exemplary UIs that utilize results based on the geographic measures of embodiments of the invention in order to present one or more content items to an end user.
- FIGS. 2A and 2B illustrate an exemplary trends UI 200 presented to an end user of shared content platform 107 via client/user device 105 .
- FIG. 2A depicts a UI 200 that can be personalized to browse content items that are popular in different geographic areas.
- the user controls 201 , 202 , 203 in UI 200 include drop-down menus where a user may select different popularity profiling options, such as a preferred geographic location 201 , and age range 202 and gender 203 if such data is available.
- an end user may select a specific location and demographic of interest to view content items 205 that are popular for these indicated areas.
- analytic server 120 may calculate the geographic entropy metric, G, for each content item in the shared content hosting platform 107 , and then use the results of this calculation to narrow down potential candidates for the requested search provided in FIG. 2A .
- FIG. 2B depicts a UI 200 that can be personalized to compare different groups of content items that are popular in different geographic areas.
- the user controls 205 , 206 , 207 in UI 200 include drop-down menus and selectable links where a user may indicate different popularity profile options, such as a preferred geographic location 201 , age range 202 , and gender 203 .
- a user may select different geographic areas and demographics in order to compare content items 215 , 216 , 217 that are popular for these specific groups.
- analytic server 120 may calculate the geographic entropy metric, G, for each content item in the shared content hosting platform 107 .
- this calculated metric, G is used to narrow down the content items to those that should be included in each group 215 , 216 , 217 .
- the results of this filtering may then be displayed in a UI, such as UI 200 illustrated in FIG. 2B .
- UI 200 illustrated in FIG. 2B .
- FIG. 3 illustrates another exemplary UI 300 that depicts geographic popularity for an individual content item.
- UI 300 may be used to provide metrics to an end user that uploaded a content item or, as authorized by that end user, to a general administrator, managing user, or other user inquiring into the metrics of a content item.
- UI 300 depicts a thumbnail image 301 of the content item, a description 302 of the content item, which can include the title, short narrative, length of video, owner, upload date, total number of views, and total time viewed.
- UI 300 provides a variety of different graphs and charts to illustrate the different metrics that analytic server 120 can provide for the content item.
- view graph 305 shows the daily views of the content item over the lifetime of the content item on the shared content hosting platform.
- Drop-down menu 303 allows a user to change the type of view depicting in graph 305 , such as daily views, weekly views, monthly views, and so on.
- UI 300 provides graph 310 depicting the number of views as a function of distance from the geographic location of the content item.
- map 320 provides a global view of the popularity of the video, providing different shading for geographic areas depending on the number of views in those areas.
- scale 315 classifies the content item in terms of global versus local popularity. The depicted range of the scale flows from ‘Strongly Local’ to ‘Strongly Global’.
- the geographic popularity formulas described above may be applied by analytic server 120 to produce the data underlying the graphs, chart, maps, and scales 305 - 320 provided in UI 300 .
- One skilled in the art will appreciate that other illustrations and depictions of the metrics are possible and that embodiments of the invention are not limited to those provided in FIG. 3 .
- FIGS. 4-6 are flow diagrams of various embodiments of methods for evaluating geographic popularity of geographically-located user-generated content.
- the methods are performed by processing logic that may comprise hardware (circuitry, dedicated logic, etc.), software (such as is run on a general purpose computer system or a dedicated machine), or a combination of both.
- the methods of FIGS. 4-6 may be performed by analytic server 120 running on a server machine or another machine as described with respect to FIG. 1 .
- FIG. 4 is a flow diagram illustrating one embodiment for a method 400 of tracking geographic popularity of geographically-located user-generated content.
- a content item is received with geographic location metadata.
- the content item is uploaded to a shared content hosting platform.
- the content item may be at least one of video, photos, music, documents, and so on.
- view data associated with the content item is recorded.
- the view data includes a time and date of a view, an IP address associated with the view, a duration of the view, and other view data as relevant to the type of content item.
- the view history data may be stored with the metadata associated with the content item.
- view history data for a content item is kept in storage separate from the content and its associated metadata.
- Blocks 430 through 470 utilize the geographic location metadata and view history data identified in blocks 410 and 420 to calculate various geographic-related metrics.
- a total views metric, V is calculated for the content item. As described above, the total views metric, V, measures the total number of views of a content item.
- a view distance metric, D is calculated for the content item. The view distance metric, D, measures the average distance between the view locations and the item location, which illustrates generally how an item receives views from distant regions.
- a view locality metric, L is calculated for the content item.
- the view locality metric, L measures how the content item receives views from distant places by applying more weight to views coming from places nearby and less weight to views coming from distant regions.
- a view entropy metric, H is calculated for the content item.
- the view entropy metric, H measures how views are spread across different regions without considering the content item's location.
- a view geographic entropy metric, G is calculated for the content item.
- the view geographic entropy metric, G measures how views are spread across different regions, while taking into account the geographic location of the content item.
- the calculated metrics from block 430 through 470 are stored with at least one of the metadata of the content item or other analytic data of the content item.
- the other analytic data may include the view history data of the content item, for instance.
- Blocks 420 - 480 of method 400 may be periodically repeated throughout the lifetime of the content item. For example, these steps may be repeated on a daily basis or a weekly basis.
- FIG. 5 is a flow diagram illustrating one embodiment for a method 500 of comparing geographic popularity of geographically-located user-generated content.
- a request is received to compare geographic popularity for a plurality of content items.
- the request further indicates one or more geographic regions to consider in this comparison.
- the geographic areas may range from a region level (e.g., Asia-Pacific) to a country level (e.g., Australia) down to a local region (e.g., Silicon Valley) or a city level (e.g., Phoenix).
- the request is received at a front-end server of a shared content hosting platform, and passed on to an analytic server of the platform for analysis services.
- view geographic entropy metric data is retrieved or accessed for all of the content items in the shared content hosting platform.
- the view geographic entropy metric data had previously been calculated on a periodic basis for each content item stored at the platform.
- each content item is ranked according to its view geographic entropy metric for each of the indicated geographic areas.
- the ranking results from block 530 are returned for display in a UI. In one embodiment, the results are returned to the front-end server for display to an end user via the UI.
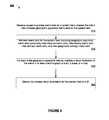
- FIG. 6 is a flow diagram illustrating one embodiment for a method 600 of displaying geographic popularity of geographically-located user-generated content.
- a request is received to provide metric data for a content item.
- the metric data includes geographic popularity metric data for the content item.
- the request is received at a front-end server of a shared content hosting platform, and passed on to an analytic server of the platform for analysis services.
- metric data for the content item is retrieved, including the geographic popularity metric data comprising view distance metric data, view locality metric data, view entropy metric data, and view geographic entropy metric data.
- the metric data had previously been calculated on a periodic basis for each content item stored at the platform.
- the metric data may be stored with metadata of the content item or separately with pre-aggregated analytic data.
- visual illustrations of each of the geographic popularity metrics are created in the form of at least one of a graph, a chart, a scale, or a map.
- one of the visual illustrations is a scale that classifies the content item on a range running from ‘Strongly Global’ to ‘Strongly Local’.
- the created visual illustrations are displayed for the content item in a UI.
- the results are returned to the front-end server for display to an end user via the UI.
- FIG. 7 illustrates a diagrammatic representation of a machine in the exemplary form of a computer system 700 within which a set of instructions, for causing the machine to perform any one or more of the methodologies discussed herein, may be executed.
- the machine may be connected (e.g., networked) to other machines in a LAN, an intranet, an extranet, or the Internet.
- the machine may operate in the capacity of a server or a client machine in client-server network environment, or as a peer machine in a peer-to-peer (or distributed) network environment.
- the machine may be a personal computer (PC), a tablet PC, a set-top box (STB), a Personal Digital Assistant (PDA), a cellular telephone, a web appliance, a server, a network router, switch or bridge, or any machine capable of executing a set of instructions (sequential or otherwise) that specify actions to be taken by that machine.
- PC personal computer
- PDA Personal Digital Assistant
- STB set-top box
- WPA Personal Digital Assistant
- a cellular telephone a web appliance
- server a server
- network router switch or bridge
- the exemplary computer system 700 includes a processing device (processor) 702 , a main memory 704 (e.g., read-only memory (ROM), flash memory, dynamic random access memory (DRAM) such as synchronous DRAM (SDRAM) or Rambus DRAM (RDRAM), etc.), a static memory 706 (e.g., flash memory, static random access memory (SRAM), etc.), and a data storage device 718 , which communicate with each other via a bus 708 .
- ROM read-only memory
- DRAM dynamic random access memory
- SDRAM synchronous DRAM
- RDRAM Rambus DRAM
- static memory 706 e.g., flash memory, static random access memory (SRAM), etc.
- SRAM static random access memory
- Processor 702 represents one or more general-purpose processing devices such as a microprocessor, central processing unit, or the like. More particularly, the processor 702 may be a complex instruction set computing (CISC) microprocessor, reduced instruction set computing (RISC) microprocessor, very long instruction word (VLIW) microprocessor, or a processor implementing other instruction sets or processors implementing a combination of instruction sets.
- the processor 702 may also be one or more special-purpose processing devices such as an application specific integrated circuit (ASIC), a field programmable gate array (FPGA), a digital signal processor (DSP), network processor, or the like.
- the processor 702 is configured to execute instructions 726 for performing the operations and steps discussed herein, illustrated in FIG. 7 by depicting instructions 726 within processor 702 .
- the computer system 700 may further include a network interface device 722 .
- the computer system 700 also may include a video display unit 710 (e.g., a liquid crystal display (LCD), a cathode ray tube (CRT), or a touchscreen), an alphanumeric input device 712 (e.g., a keyboard), a cursor control device 714 (e.g., a mouse), and a signal generation device 720 (e.g., a speaker).
- a video display unit 710 e.g., a liquid crystal display (LCD), a cathode ray tube (CRT), or a touchscreen
- an alphanumeric input device 712 e.g., a keyboard
- a cursor control device 714 e.g., a mouse
- a signal generation device 720 e.g., a speaker
- the data storage device 718 may include a computer-readable storage medium 724 on which is stored one or more sets of instructions 726 (e.g., software) embodying any one or more of the methodologies or functions described herein.
- the instructions 726 may also reside, completely or at least partially, within the main memory 704 and/or within the processor 702 during execution thereof by the computer system 700 , the main memory 704 and the processor 702 also constituting computer-readable storage media.
- the instructions 726 may further be transmitted or received over a network 774 via the network interface device 722 .
- the instructions 726 include instructions for an analytic server 750 , which may correspond to analytic server 120 of FIG. 1 , and/or a software library containing methods that call an analytic server.
- the computer-readable storage medium 724 is shown in an exemplary embodiment to be a single medium, the term “computer-readable storage medium” should be taken to include a single medium or multiple media (e.g., a centralized or distributed database, and/or associated caches and servers) that store the one or more sets of instructions.
- the term “computer-readable storage medium” shall also be taken to include any medium that is capable of storing, encoding or carrying a set of instructions for execution by the machine and that cause the machine to perform any one or more of the methodologies of the present invention.
- the term “computer-readable storage medium” shall accordingly be taken to include, but not be limited to, solid-state memories, optical media, and magnetic media.
- the present invention also relates to an apparatus for performing the operations herein.
- This apparatus may be specially constructed for the required purposes, or it may comprise a general purpose computer selectively activated or reconfigured by a computer program stored in the computer.
- a computer program may be stored in a computer readable storage medium, such as, but not limited to, any type of disk including floppy disks, optical disks, CD-ROMs, and magnetic-optical disks, read-only memories (ROMs), random access memories (RAMs), EPROMs, EEPROMs, magnetic or optical cards, or any type of media suitable for storing electronic instructions.
Abstract
Description
V=Σ i v i
The formula for Total Views, V, measures total number of views of a content item.
View Distance (D):
D=1/VΣ i v i *di
The formula for View Distance, D, measures the average distance between the view locations and the item location, which can generally represent how an item receives views from distant regions.
View Locality (L):
L=1/VΣ i v i /di
The formula for View Locality, L, measures how an item receives views from distant places by applying more weight to views coming from places nearby and less weight to views coming from distant regions.
View Entropy (H):
H=−Σ i v i /V log (v i/(V*d i)
The formula for View Entropy, H, measures how views are spread across different regions, without considering the geographic location of the item.
View Geographic Entropy (G):
G=−Σ i v i /V log (v i/(V*d i))
The formula for View Geographic Entropy, G, measures how views are spread across different regions, while taking into account the geographic location of the content item.
Claims (20)
Priority Applications (5)
| Application Number | Priority Date | Filing Date | Title |
|---|---|---|---|
| US13/358,982 US8806519B2 (en) | 2011-10-31 | 2012-01-26 | Method to evaluate the geographic popularity of geographically located user-generated content items |
| EP12845467.5A EP2774092A4 (en) | 2011-10-31 | 2012-10-31 | Method to evaluate the geographic popularity of geographically located user-generated content items |
| PCT/US2012/062852 WO2013067047A1 (en) | 2011-10-31 | 2012-10-31 | Method to evaluate the geographic popularity of geographically located user-generated content items |
| CN201280064820.6A CN104169910B (en) | 2011-10-31 | 2012-10-31 | The method of the Geographic Epidemic degree for the content item that user for assessing geo-location generates |
| US14/317,031 US9078036B2 (en) | 2011-10-31 | 2014-06-27 | Mechanism to evaluate the geographic popularity of geographically-located user-generated content items |
Applications Claiming Priority (2)
| Application Number | Priority Date | Filing Date | Title |
|---|---|---|---|
| US201161553610P | 2011-10-31 | 2011-10-31 | |
| US13/358,982 US8806519B2 (en) | 2011-10-31 | 2012-01-26 | Method to evaluate the geographic popularity of geographically located user-generated content items |
Related Child Applications (1)
| Application Number | Title | Priority Date | Filing Date |
|---|---|---|---|
| US14/317,031 Continuation US9078036B2 (en) | 2011-10-31 | 2014-06-27 | Mechanism to evaluate the geographic popularity of geographically-located user-generated content items |
Publications (2)
| Publication Number | Publication Date |
|---|---|
| US20130111512A1 US20130111512A1 (en) | 2013-05-02 |
| US8806519B2 true US8806519B2 (en) | 2014-08-12 |
Family
ID=48173857
Family Applications (2)
| Application Number | Title | Priority Date | Filing Date |
|---|---|---|---|
| US13/358,982 Active US8806519B2 (en) | 2011-10-31 | 2012-01-26 | Method to evaluate the geographic popularity of geographically located user-generated content items |
| US14/317,031 Active US9078036B2 (en) | 2011-10-31 | 2014-06-27 | Mechanism to evaluate the geographic popularity of geographically-located user-generated content items |
Family Applications After (1)
| Application Number | Title | Priority Date | Filing Date |
|---|---|---|---|
| US14/317,031 Active US9078036B2 (en) | 2011-10-31 | 2014-06-27 | Mechanism to evaluate the geographic popularity of geographically-located user-generated content items |
Country Status (4)
| Country | Link |
|---|---|
| US (2) | US8806519B2 (en) |
| EP (1) | EP2774092A4 (en) |
| CN (1) | CN104169910B (en) |
| WO (1) | WO2013067047A1 (en) |
Cited By (2)
| Publication number | Priority date | Publication date | Assignee | Title |
|---|---|---|---|---|
| US9344990B1 (en) * | 2012-12-03 | 2016-05-17 | Sprint Communications Company L.P. | Device location accuracy metrics for applications on wireless communication devices |
| US20210176511A1 (en) * | 2013-04-24 | 2021-06-10 | The Nielsen Company (Us), Llc | Methods and apparatus to correlate census measurement data with panel data |
Families Citing this family (18)
| Publication number | Priority date | Publication date | Assignee | Title |
|---|---|---|---|---|
| US9049546B2 (en) * | 2012-04-10 | 2015-06-02 | Yellowpages.Com Llc | User description based on a context of travel |
| US8849312B2 (en) | 2012-04-10 | 2014-09-30 | Yellowpages.Com Llc | User description based on contexts of location and time |
| KR20140042263A (en) * | 2012-09-28 | 2014-04-07 | 삼성전자주식회사 | Apparatus and method for transmitting and receiving buffering data in media streaming service |
| US9635400B1 (en) * | 2012-10-01 | 2017-04-25 | Google Inc. | Subscribing to video clips by source |
| US9955231B2 (en) * | 2013-03-14 | 2018-04-24 | DISH Technologies L.L.C. | Relevant video content pushed to a mobile phone |
| US20140351687A1 (en) * | 2013-05-24 | 2014-11-27 | Facebook, Inc. | Contextual Alternate Text for Images |
| US9432712B2 (en) * | 2014-01-22 | 2016-08-30 | Zefr, Inc. | Updating channel appearance |
| US10089326B2 (en) * | 2014-07-16 | 2018-10-02 | Google Llc | Generating textual summary about physical location based on computing interactions pertaining to physical location |
| JP6131233B2 (en) * | 2014-10-24 | 2017-05-17 | 豊田鉄工株式会社 | Stacked composite interior parts |
| US9390323B1 (en) | 2015-05-18 | 2016-07-12 | International Business Machines Corporation | Recommending sites through metadata analysis |
| US20170169025A1 (en) * | 2015-12-14 | 2017-06-15 | Google Inc. | Estimating Geographic Entity Capacity |
| US10091549B1 (en) * | 2017-03-30 | 2018-10-02 | Rovi Guides, Inc. | Methods and systems for recommending media assets based on the geographic location at which the media assets are frequently consumed |
| CN107370811B (en) * | 2017-07-14 | 2020-11-27 | 北京知道创宇信息技术股份有限公司 | Resource distribution method of CDN (content delivery network), computing equipment and readable storage medium |
| CN108511073A (en) * | 2017-12-28 | 2018-09-07 | 王秀丽 | A kind of Newborn Birth-defects method for early warning based on grid |
| US11109105B2 (en) | 2019-01-11 | 2021-08-31 | Sharp Nec Display Solutions, Ltd. | Graphical user interface for insights on viewing of media content |
| US11334604B2 (en) * | 2019-09-12 | 2022-05-17 | Snowflake Inc. | Private data exchange |
| KR20220061431A (en) * | 2020-11-06 | 2022-05-13 | 삼성전자주식회사 | Electronic apparatus and method of controlling the same |
| CN114338565A (en) * | 2021-11-19 | 2022-04-12 | 煤炭科学技术研究院有限公司 | Resource allocation method and device and electronic equipment |
Citations (5)
| Publication number | Priority date | Publication date | Assignee | Title |
|---|---|---|---|---|
| US20070214097A1 (en) | 2006-02-28 | 2007-09-13 | Todd Parsons | Social analytics system and method for analyzing conversations in social media |
| US20090030899A1 (en) * | 2007-06-29 | 2009-01-29 | Allvoices, Inc. | Processing a content item with regard to an event and a location |
| US20100058405A1 (en) * | 2008-08-29 | 2010-03-04 | At&T Corp. | Systems and Methods for Distributing Video on Demand |
| US20110083101A1 (en) * | 2009-10-06 | 2011-04-07 | Sharon Eyal M | Sharing of Location-Based Content Item in Social Networking Service |
| US8204977B1 (en) | 2011-11-08 | 2012-06-19 | Google Inc. | Content access analytics |
-
2012
- 2012-01-26 US US13/358,982 patent/US8806519B2/en active Active
- 2012-10-31 CN CN201280064820.6A patent/CN104169910B/en active Active
- 2012-10-31 EP EP12845467.5A patent/EP2774092A4/en not_active Ceased
- 2012-10-31 WO PCT/US2012/062852 patent/WO2013067047A1/en active Application Filing
-
2014
- 2014-06-27 US US14/317,031 patent/US9078036B2/en active Active
Patent Citations (5)
| Publication number | Priority date | Publication date | Assignee | Title |
|---|---|---|---|---|
| US20070214097A1 (en) | 2006-02-28 | 2007-09-13 | Todd Parsons | Social analytics system and method for analyzing conversations in social media |
| US20090030899A1 (en) * | 2007-06-29 | 2009-01-29 | Allvoices, Inc. | Processing a content item with regard to an event and a location |
| US20100058405A1 (en) * | 2008-08-29 | 2010-03-04 | At&T Corp. | Systems and Methods for Distributing Video on Demand |
| US20110083101A1 (en) * | 2009-10-06 | 2011-04-07 | Sharon Eyal M | Sharing of Location-Based Content Item in Social Networking Service |
| US8204977B1 (en) | 2011-11-08 | 2012-06-19 | Google Inc. | Content access analytics |
Non-Patent Citations (6)
| Title |
|---|
| Brodersen et al., "YouTube Around the World: Geographic Popularity of Videos", Presented at the World Wide Web Conference, Apr. 16-20, 2012 (WWW 2012), http://www2012.org/proceedings/proceedings/p241.pdf. |
| International Search Report for and Written Opinion of the International Searching Authority for International Patent Application No. PCT/US12/62852 mailed Jan. 22, 2013. |
| Michael Batty, Spatial Entropy, published Sep. 3, 2010, Wiley Online Library, vol. 6, Issue 1, pp. 1-31, Jan. 1974, retrieved from internet <http://onlinelibrary.wiley.com/doi/10.1111/j.1538-4632.1974.tb01014.x/abstract , select Get PDF (1196K), retreived on Feb. 14, 2013. * |
| Paszto et al, "On Spatial Entrophy in Geographical Data", In: GIS Ostrava, Jan. 25-28, 2009, http://gis.vsb/cz/GIS-Ostrava/GIS-Ova-2009/sbornki/Lists/Papers/017.pdf. |
| Scellato et al., "Track Globally, Deliver Locally: Improving Content Delivery Networks by Tracking Geographic Social Cascades", Presented at the World Wide Web Conference, Mar. 28-Apr. 1, 2011 (WWW 2011), pp. 457-466, https://cs.uwaterloo.ca/~kdaudjee/courses/cs848/papers/scellato11.pdf. |
| Scellato et al., "Track Globally, Deliver Locally: Improving Content Delivery Networks by Tracking Geographic Social Cascades", Presented at the World Wide Web Conference, Mar. 28-Apr. 1, 2011 (WWW 2011), pp. 457-466, https://cs.uwaterloo.ca/˜kdaudjee/courses/cs848/papers/scellato11.pdf. |
Cited By (2)
| Publication number | Priority date | Publication date | Assignee | Title |
|---|---|---|---|---|
| US9344990B1 (en) * | 2012-12-03 | 2016-05-17 | Sprint Communications Company L.P. | Device location accuracy metrics for applications on wireless communication devices |
| US20210176511A1 (en) * | 2013-04-24 | 2021-06-10 | The Nielsen Company (Us), Llc | Methods and apparatus to correlate census measurement data with panel data |
Also Published As
| Publication number | Publication date |
|---|---|
| EP2774092A4 (en) | 2015-06-24 |
| CN104169910B (en) | 2017-12-01 |
| WO2013067047A1 (en) | 2013-05-10 |
| CN104169910A (en) | 2014-11-26 |
| EP2774092A1 (en) | 2014-09-10 |
| US9078036B2 (en) | 2015-07-07 |
| US20130111512A1 (en) | 2013-05-02 |
| US20150007210A1 (en) | 2015-01-01 |
Similar Documents
| Publication | Publication Date | Title |
|---|---|---|
| US9078036B2 (en) | Mechanism to evaluate the geographic popularity of geographically-located user-generated content items | |
| US10430481B2 (en) | Method and apparatus for generating a content recommendation in a recommendation system | |
| US10706325B2 (en) | Method and apparatus for selecting a network resource as a source of content for a recommendation system | |
| CN104782138B (en) | Thumbnail image selects system, method and computer-readable medium | |
| US8510644B2 (en) | Optimization of web page content including video | |
| US11276076B2 (en) | Method and system for generating a digital content recommendation | |
| US8151194B1 (en) | Visual presentation of video usage statistics | |
| WO2017071251A1 (en) | Information pushing method and device | |
| TWI533246B (en) | Method and system for discovery of user unknown interests | |
| US11025583B2 (en) | Recommendation system based on common interests in social networks | |
| US20130247105A1 (en) | Smart subscribe button on watch | |
| CN110268717A (en) | The bit rate of more presentation codes is optimized using statistical information is played | |
| US11818428B2 (en) | Identifying viewing characteristics of an audience of a content channel | |
| RU2714594C1 (en) | Method and system for determining parameter relevance for content items | |
| EP3267386A1 (en) | Method and apparatus for generating a content recommendation in a recommendation system | |
| US20180270305A1 (en) | Systems and methods for throttling incoming network traffic requests | |
| US9569432B1 (en) | Evaluating content in a computer networked environment | |
| US20150074599A1 (en) | Mobile video channel-based gestural user interface | |
| US20230177539A1 (en) | Automatic experience research with a user personalization option method and apparatus | |
| US20160104078A1 (en) | System and method for generating event listings with an associated video playlist | |
| CN107979779B (en) | Combined interaction monitoring of media content groupings on social media services | |
| US10037310B1 (en) | Evaluating content in a computer networked environment | |
| EP3267389A1 (en) | Method and apparatus for selecting a network resource as a source of content for a recommendation system | |
| Król et al. | Performance of map applications on mobile devices: case study | |
| Grammenos et al. | Dissecting the workload of a major adult video portal |
Legal Events
| Date | Code | Title | Description |
|---|---|---|---|
| AS | Assignment |
Owner name: GOOGLE INC., CALIFORNIA Free format text: ASSIGNMENT OF ASSIGNORS INTEREST;ASSIGNORS:SCELLATO, SALVATORE;WATTENHOFER, MIRJAM;BRODERSEN, ANDERS TORP;SIGNING DATES FROM 20120125 TO 20120126;REEL/FRAME:027601/0213 |
|
| STCF | Information on status: patent grant |
Free format text: PATENTED CASE |
|
| AS | Assignment |
Owner name: GOOGLE LLC, CALIFORNIA Free format text: CHANGE OF NAME;ASSIGNOR:GOOGLE INC.;REEL/FRAME:044277/0001 Effective date: 20170929 |
|
| MAFP | Maintenance fee payment |
Free format text: PAYMENT OF MAINTENANCE FEE, 4TH YEAR, LARGE ENTITY (ORIGINAL EVENT CODE: M1551) Year of fee payment: 4 |
|
| MAFP | Maintenance fee payment |
Free format text: PAYMENT OF MAINTENANCE FEE, 8TH YEAR, LARGE ENTITY (ORIGINAL EVENT CODE: M1552); ENTITY STATUS OF PATENT OWNER: LARGE ENTITY Year of fee payment: 8 |