US8838203B2 - Inverse imaging of electrical activity of a heart muscle - Google Patents
Inverse imaging of electrical activity of a heart muscle Download PDFInfo
- Publication number
- US8838203B2 US8838203B2 US13/380,244 US201013380244A US8838203B2 US 8838203 B2 US8838203 B2 US 8838203B2 US 201013380244 A US201013380244 A US 201013380244A US 8838203 B2 US8838203 B2 US 8838203B2
- Authority
- US
- United States
- Prior art keywords
- heart
- activation
- model
- recovery
- ecg
- Prior art date
- Legal status (The legal status is an assumption and is not a legal conclusion. Google has not performed a legal analysis and makes no representation as to the accuracy of the status listed.)
- Expired - Fee Related, expires
Links
Images


Classifications
-
- A61B5/0402—
-
- A—HUMAN NECESSITIES
- A61—MEDICAL OR VETERINARY SCIENCE; HYGIENE
- A61B—DIAGNOSIS; SURGERY; IDENTIFICATION
- A61B5/00—Measuring for diagnostic purposes; Identification of persons
- A61B5/24—Detecting, measuring or recording bioelectric or biomagnetic signals of the body or parts thereof
- A61B5/316—Modalities, i.e. specific diagnostic methods
- A61B5/318—Heart-related electrical modalities, e.g. electrocardiography [ECG]
-
- A—HUMAN NECESSITIES
- A61—MEDICAL OR VETERINARY SCIENCE; HYGIENE
- A61B—DIAGNOSIS; SURGERY; IDENTIFICATION
- A61B18/00—Surgical instruments, devices or methods for transferring non-mechanical forms of energy to or from the body
- A61B2018/00636—Sensing and controlling the application of energy
- A61B2018/00773—Sensed parameters
- A61B2018/00839—Bioelectrical parameters, e.g. ECG, EEG
Definitions
- the invention relates to methods for providing images of heart tissue, in particular of heart muscles, in particular images that can provide information on different areas of a heart muscle.
- the invention relates to non-invasive methods of providing information on heart muscles.
- the invention relates to methods for providing such images based upon ECG's and heart torso geometry measurements and/or models.
- the biophysical modelling approach used in this application relates the activation and recovery of the heart directly to the electrical processes within the myocardial cells.
- a proper understanding of the underlying processes within the myocardial cells and the electrical functioning of the whole heart is important for linking the observations on the body surface to the actual activation and recovery of the heart.
- the cell At rest, ion pumps in the membrane of the cardiac cell maintain a potential difference over the membrane: the cell is polarised. Electrical stimulation of a cell will influence the ion kinetics at the membrane, which causes the cell to depolarise. This depolarisation initiates the influx of calcium, which in turn elicits the contraction. In order to enable a subsequent contraction the calcium must be removed and the cells brought back to the resting polarised state.
- Myocardial cells are electrically coupled by means of gap junctions [1]. This intercellular coupling produces a domino effect, i.e. once a sufficiently large number of cells are depolarised, these cells are able to depolarise their direct neighbours. This process continues until the whole heart is depolarised.
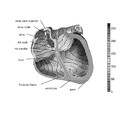
- the heart has four chambers; two atria and two ventricles (see FIG. 1 ).
- the atria have a thin wall and a limited pump function; the ventricles perform the mechanical action involved in pumping the blood to the lungs, other organs, and body tissues.
- the activation of the heart starts in the sinus node region, an atrial area close to the vena cava superior [2] ( FIG. 1 ).
- the sinus node consists of so-called pacemaker cells, which depolarise slowly and autonomously until the depolarisation threshold is reached, resulting in the fast depolarisation of the cells ( FIG. 2 a ).
- the nervous system controls the heart rate by influencing this slow autonomous depolarisation process.
- These pacemaker cells activate the atria by means of the intercellular coupling. This coupling is more effective at the far ends of the elongated atrial myocardial cells than on the remaining part of the cell surface [3,4].
- the atrial activation wave finally reaches the atrio-ventricular junction, also called the bundle of His, an area where the atrial myocardium inserts into, but is electrically separated from, the ventricular myocardium [12,13].
- the electrical impulse is slowly transmitted by the AV node which moves over into two His bundles through which the impulse is rapidly conducted into the Purkinje system ( FIG. 1 ).
- the Purkinje system in humans forms a dense network on the lower part of the left and right endocardial wall [14,15], connected to the myocardium at the endings of the Purkinje fibres. This network facilitates the rapid spread of activation, synchronizing the ventricular contraction by means of the activation of ventricular myocardium from multiple sites [16].
- ventricular myocardium becomes activated, anisotropic activation propagation plays a major role [1].
- atrial cells the electrical coupling of the ventricular cells is most prominent on the far ends.
- ventricular myocardial cells are ordered in bundles running obliquely from apex to base [17,18] ( FIG. 1 ). This bundle structure causes the activation wave to fan out in an elliptic way over the heart surface [19]. Because of this, transmural propagation, from the inner part of the wall, endocardium, to the nearby outer part, epicardium, (wall thickness up to 15 mm) is slower than along the ventricular surface [16].
- FIG. 2 b The activation is followed by the repolarisation of the myocardial cells, in which different stages can be distinguished.
- the transmembrane potential of myocardial cells is maintained at approximately ⁇ 85 mV.
- phase 0 the transmembrane potential rises to approximately +15 mV, immediately followed by an early repolarisation (phase 1), a slowly decreasing plateau (phase 2), and finally the recovery (phase 3), during which myocardial cells are brought back to their resting polarised state (phase 4).
- phase 0 the transmembrane potential waveforms are shown.
- the contraction of the heart is initiated by the fast electrical depolarisation of the membranes of the cardiac cells. This depolarisation spreads in a wave-like fashion over the heart. Immediately after the depolarisation phase the myocardial cells start to repolarise, initially a relatively slow process, followed some 200 ms later by a faster phase that takes up to 150 ms. These electrical processes within the heart generate currents, which are conducted through the various body tissues. As a result these currents generate potentials on the body surface. Recordings of these potentials are called electrocardiograms or ECGs. Since the early days of Einthoven, more than 100 years ago, the ECG has been recorded systematically.
- Non-invasive registration method has become a major clinical tool in assessing the (dis)functioning of the heart.
- Non-invasive imaging techniques can assist in solving this visualisation problem by mapping and displaying the local activation and recovery times on the surface of the heart.
- the electrical activity of the atria and ventricles can be distinguished in the ECG.
- the first clear sign in the ECG of electric activity during any heart beat is the P wave (see FIG. 3 ), resulting from the activation of the atria. This is followed by the QRS complex, signalling the ventricular activation.
- the recovery of the ventricles is visible in the ECG as the T wave. Atrial repolarisation cannot be observed clearly in this display since the magnitude of the associated current is much smaller than that generating the P wave and part of its timing coincides with that of the much larger QRS complex [25].
- the morphology of the ECG is determined by the activation and recovery sequence of the heart.
- the activation sequence of the human heart has been studied extensively for decennia; invasively [16,26,27,28] as well as non-invasively [29,30,31,32].
- ECG electrocardiogram
- the invention now provides a method for providing a representation of the distribution, fluctuation and/or movement of electrical activity through heart tissue, in particular a heart muscle, said method comprising: obtaining an ECG of said heart tissue; obtaining a model of the heart geometry; obtaining a model of the torso geometry; relating the measurements per electrode of the ECG to the heart and torso geometry, in particular based upon a source model and estimating the distribution, fluctuation and/or movement of electrical activity through the heart muscle based upon a fastest route algorithm, a shortest path algorithm and/or fast marching algorithm or combinations thereof. More detailed estimates of the distribution, fluctuation and/or movement can be obtained by using a cellular automaton or by the ion kinetics model, but these are generally not considered necessary.
- the fastest route algorithm in particular together with the equivalent double layer model, (vide infra) allows for so-called inverse functional imaging of electrical activity (activation, recovery) of a heart muscle, in particular of a complete image of a heart, as well as particular areas of interest both on the outside (epicardium) and inside (endocardium) of the heart or both.
- the fast marching algorithm, the shortest path algorithm, the ion kinetic model or the cellular automaton model may be used.
- An ECG is defined herein as any method that (preferably non-invasively) correlates actual electrical activity of the heart muscle to measured or derived (electrical activity) of the heart.
- the differences in potential between electrodes on the body surface are correlated to the electrical activity of the heart.
- Derived ECG's can also be obtained in other ways (e.g. by measurement made by a so-called ICD (Implantable Cardioverter Defibrillator)).
- ICD International Cardioverter Defibrillator
- the fastest route algorithm (vide infra) is used to make such an estimate.
- a model of said heart and torso is required.
- Such a model can be obtained from (MRI) measurements, but as more and more of such measurements become available (parts of) these measurements may be omitted and taken from a reference database.
- the functional images provided by the present invention are provided in silico and preferably depicted on a computer screen, allowing for inter alia virtual “3D” representations. Clinically it may be very relevant which part of a heart muscle is not functioning properly. Although based on present day technology some distinctions are possible, the present invention allows for enhanced localisation of activation and/or repolarisation (recovery) disorders, as well as the identification of areas affected by insults, trauma or otherwise. Thus in one embodiment the invention provides a method according to the invention whereby the representation is an estimation of the activation of different areas of the heart muscle. For these images it may not be necessary to provide an image of a complete heart, although this is preferred according to the present invention.
- MRI measurements are Echi, Röntgen, CT-scan, PET-scan and photo/video (thorax only with electrode positions) measurements. However MRI measurements are preferred.
- the invention provides a method according to the invention, whereby the heart- and/or the torso geometry is based upon a measurement by MRI.
- the present invention allows for providing functional images of electrical activity as it moves through the heart muscle, both activation and repolarisation (recovery) can be visualised and have been shown to match the actual physiological electrical activity patterns of the actual heart.
- Recovery has clinical relevance on its own, thus the invention provides in yet another embodiment a method according to the invention, whereby repolarisation (recovery) of areas of the heart muscle is estimated based upon the sequence of activation through the heart muscle.
- the imaging methods according to the invention are capable of revealing e.g. repolarisation dispersion. Great dispersion in repolarisation times means that a next activation wave over the heart muscle may encounter cells that are not yet repolarised and therefore cannot be activated. This often leads to arrhythmia.
- the present invention can therefore detect whether the heart of a subject is prone to go into arrhythmia. It can also be used to determine the effects of substances given to suppress, prevent or end arrhythmic events.
- the methods according to the invention preferably employ the fastest route algorithm. Preferably this algorithm is adjusted for anisotropy in the heart muscle. This allows for correction of the image for bundles of fibers and start of activation at multiple foci. It also allows for correction of the electrical signal travelling faster in certain directions than in others (fibre orientation).
- the present invention provides a method according to the invention, further comprising adjusting the activation estimation by estimating the fiber orientation in at least one area of the heart muscle.
- the methods according to the invention thus can identify additional activation foci whether they are epicardial or endocardial. It may thereby serve as a guide for surgical procedures intended to remove such additional foci (ablation). On the other hand it may guide procedures where additional activation sites have to be created. It is particularly helpful that the present invention distinguishes epicard and endocard, since different procedures may need to be used to reach epicardial or endocardial sites.
- the invention provides a method whereby the speed, activation and/or recovery estimation is optimised by a Levenberg-Marquardt method.
- the preferred source model according to the invention is the so-called equivalent double layer model (EDL), vide infra. Although this model is preferred deviations (in particular improvements) of this model may be possible.
- EDL equivalent double layer model
- An ion-kinetic model may be suitable, but is more cumbersome to work with. More simple, but less accurate would be the so-called moving dipoles model.
- the invention provides a method according to the invention, wherein the source model is an equivalent double layer model.
- a further layer of information on electrical activity (in at least part) of a heart muscle is available with the methods and means according to the invention.
- the invention provides a method according to the invention, wherein the amplitude of a local transmembrane potential in a heart muscle is estimated based on the ST segment of an ECG of said heart muscle.
- the heart-torso model obtained preferably by MRI in a preferred embodiment is a volume conductor model.
- the invention provides a method according to the invention, wherein a volume conductor model of the heart- and/or torso geometry is provided.
- a preferred volume conductor model is disclosed in international application PCT/NL2009/050711, published in May 2010).
- the volume conductor model is adjusted based upon a database of various heart—and/or torso geometries. It is also preferred to improve estimates relating to a source model by adjustments based upon a database of various heart geometries.
- the databases mentioned herein are of course computer readable databases on data carriers within or outside computers.
- the invention also provides a computer provided with—means (direct or indirect) of providing torso/heart geometries, —means to (directly or indirectly) provide ECG measurements and a program (software) to convert these measurements to an image of electrical activity in a heart muscle presentable on a computer screen or other presenting medium.
- the methods and means according to the invention can be used in a hospital setting, but, in particular with mobile data transfer technology, can also be used to monitor a patient from a distance. Once a torso/heart geometry estimate is available the ECG measurements can be made with a device that can be worn by a subject and the recordings can be transmitted to a computer on which the other necessary data and software is present.
- the invention provides singular, plural, as well as continuous measurements and thereby both historical and “real time” images.
- the methods and means according to the invention can also be used to measure and/or envisage effects for the heart resulting from any outside influence on the body of a subject.
- Physical exertion of the subject may be such an influence as well as stress, etc.
- Particularly of interest are the effects of chemical/biological substances that are introduced into subjects.
- Particularly substances that are intended for the treatment of subjects for a certain disease are particularly preferred.
- the invention provides a method for determining the effects of a substance on at least one area of a heart muscle, comprising obtaining a first and at least one further representation of a heart muscle according to the invention, whereby said first representation is obtained from a heart not exposed to said substance and said at least one further representation is obtained during and/or after exposure of said heart to said substance.
- these measurements can be taken several times or even continuously.
- Such substances may be intended to treat heart disease, but also to treat other diseases, or be considered for human uptake (food/nutrients/cosmetics, pollutants, etc.) of which it is desired to know possible toxicity for the heart upon such uptake. Different areas of the heart may be affected differently by such substances and the relevance of different areas may also differ.
- the invention thus provides a method according to the invention whereby different areas of a heart muscle are analyzed for effects of said substance.
- the first surface source model is that of the potential distribution on a closed surface closely surrounding the heart, somewhat like the pericardium, referred to here as the pericardial potential source (PPS) model.
- the model is based on the fact that, barring all modelling and instrumentation errors, a unique relation exists between the potentials on either of two nested surfaces, one being the body surface, the other the pericardium, provided that there are no active electric sources in the region in between. It was first proposed at Duke by Martin and Pilkington [42]; its potential has subsequently been developed by several other groups, e.g., [43,44,45,46,47].
- the second type of surface source model evolved from the classic model of the double layer as an equivalent source of the currents generated at the cellular membrane during depolarisation, described by Wilson et al. [48]. Initially, this current dipole layer model was used to describe the activity at the front of a depolarisation wave propagating through the myocardium [49,50]. Later, Salu [51] expressed the equivalence between the double layer at the wave front and a uniform double layer at the depolarised part of the surface bounding the myocardium, based on solid angle theory [52]. This source description has been explored by others, e.g., [31,41,53,54,55].
- the EDL model the equivalent double layer on the heart's surface as a model of the electric sources throughout the myocardium; we refer to it as the EDL model.
- the EDL source model relates to the entire surface bounding the atrial or ventricular myocardium: epicardium, endocardium and their connection at the base.
- the EDL was initially used for modelling the currents at the depolarizing wave front only. Based on the theory proposed by Geselowitz [56,57], it was found to be also highly effective for describing the cardiac generator during recovery (the repolarisation phase of the myocytes).
- TMPs transmembrane potentials
- BSPs body surface potentials
- volume conductor In order to solve the forward problem, one needs to compute the potential differences at the body surface that result from the electric currents generated by the heart. For this purpose a realistic description of the volume conductor is needed, incorporating the shape and conductivities of the relevant tissues.
- the standard procedure to obtain such a volume conductor model is to detect the contours of the relevant tissues in a set of MR images of the subject involved and reconstruct triangulated computer models of these tissues [64,65,66,67].
- QRS complex we have chosen to include in our volume conductor model the blood filled cavities within the heart, the lungs, and the rest of the torso with conductivity values 0.6 S/m, 0.04 S/m and 0.2 S/m respectively.
- the first distributed surface source model is that of the potential distribution on a surface closely surrounding the heart, somewhat like the pericardium, referred to here as the pericardial potential source (PPS) model.
- the model is based on the fact that, barring all modelling and instrumentation errors, a unique relation exists between the potentials on either of two nested surfaces, one being the body surface, the other the pericardium, provided that there are no active electric sources in the region in-between. It was first proposed at Duke [42]; its potential has subsequently been developed by several other groups, e.g., [43,44,46,47,69].
- the second model used in our research, is based on the macroscopic equivalent double layer (EDL) model [70], applicable to the entire electrical activity of the atria and ventricles, at any time instant [71].
- EDL equivalent double layer
- This source model stems from the classic model of the double layer as an equivalent source of the currents generated at the cellular membrane during depolarisation, described by Wilson et al. [48].
- this current dipole layer model was used to describe the activity at the front of a depolarisation wave propagating through the myocardium [49,50].
- Salu [51] expressed the equivalence between the double layer at the wave front and a uniform double layer at the depolarised part of the surface bounding the myocardium, based on solid angle theory [52] (see FIG. 4 ).
- An initial estimate for the atrial or ventricular activation can be obtained based on the propagation of the electrical activation inside the myocardium.
- the corresponding ECGs are computed.
- the activation sequence whose computed ECG matches the actual ECG the best is used as the initial estimate.
- the activation of myocardial tissue in the healthy human heart is initiated by the sinus node in the atria and by the His-Purkinje system in the ventricles.
- the initiation may occur anywhere within the atria or ventricles.
- These electrophysiological and clinical facts require the activation modelling to be able to combine activation sequences originating from multiple locations (foci), e.g. as is the case for the His-Purkinje initiated activation.
- the method has to be able to determine the location of a focus anywhere in the atria or ventricles.
- the shortest path algorithm was designed by Dijkstra to compute the path with minimal length between any two nodes in a graph [83].
- a well-known application is the route planning algorithm in any car navigation system, with the roads representing the graph.
- the applications and implementation issues of the fastest-route algorithm in modelling cardiac activation for the application of finding an initial estimate in the inverse procedure are the main topics of interest of this application.
- Atrial activation can be compared to a Huygens wave spreading with uniform velocity in all directions.
- SPA shortest path algorithm
- anisotropic propagation is known to play a prominent role. Consequently it has to be incorporated in the application of SPA to generate ventricular activation sequences.
- FRA fastest route algorithm
- FRA inhomogeneous propagation velocities within the ventricles can be incorporated.
- the FRA is used to simulate the effect a local reduction of the propagation velocity on the overall activation sequence and the simulated ECG.
- the first subject (NH) is a healthy subject [85]. This subject was included to illustrate intermediate and final results of the described inverse procedure. The other two subjects are added to illustrate clinical applications.
- the second subject (WPW) is a WPW patient for whom previously estimated activation times have been published [29,64].
- the recorded ECGs included episodes in which the QRS displayed the typical WPW pattern, i.e., a fusion beat in which the activation is initiated at both the AV node and the Kent bundle. The location of the latter was determined invasively.
- the ECGs were also recorded after an AV-nodal block had been induced by a bolus administration of adenosine, resulting in an activation sequence solely originating from the Kent bundle.
- the third case was a Brugada patient in whom ECG data were recorded during infusion of a sodium channel blocker (Ajmaline) [86], 10 bolus infusions of 10 mg, administered at one-minute intervals [87], which changes the activation and/or recovery sequence.
- the beats selected for analysis were: the baseline beat 5 minutes prior to infusion and the beat after the last bolus had been administered.
- Local repolarisation refers to the period during which the TMP moves toward its resting state (Phases 3 and 4 ), a process that may take up to some hundred ms.
- (4) represents the time interval between the marker used for the timing of local repolarisation ⁇ and the timing of local depolarisation ⁇ ; it may be interpreted as the activation recovery interval [88].
- BEM boundary element method
- FEM Finite element method
- ⁇ ⁇ ( t , l ) ⁇ n ⁇ B ⁇ ( l , n ) ⁇ S ⁇ ( t ; ⁇ n , ⁇ n ) , ( 7 ) with n the number of nodes of the triangulated version of S v .
- the timing of local depolarisation and repolarisation was treated as a parameter estimation problem, carried out by minimizing in the least squares sense with respect to the parameters ⁇ and ⁇ , the difference between the potentials computed on the basis of (7) and the corresponding body surface potentials V(t,l) observed in the subjects studied. Since the source strength depends non-linearly on the parameters, the minimisation procedure needs to be carried out iteratively, for which we used a dedicated version of the Levenberg-Marquardt algorithm [91] The subsequent steps of this procedure alternated between updating the ⁇ and ⁇ estimates. Updating ⁇ was carried out on the basis of solving arg min ⁇ ( ⁇ V ⁇ ( ⁇ ; ⁇ ) ⁇ F 2 + ⁇ 2 ⁇ L ⁇ F 2 ). (8)
- Matrix L represents a numerical form of the surface Laplacian operator [92], which serves to regularise the solution by guarding its (spatial) smoothness, ⁇ 2 its weight [31] in the optimisation process and ⁇ ⁇ F 2 the square of the Frobenius norm.
- Matrix L is the Laplacian operator normalized by the surface [31]. Consequently L ⁇ is proportional to the reciprocal of the propagation velocity. As the propagation velocity of activation and recovery are in the same order of magnitude the same value for ⁇ can be used for activation and recovery.
- Updating ⁇ was based on the same expression after interchanging ⁇ and ⁇ in the regularisation operator (latter part of (8)). Since the problem in hand is non-linear, initial estimates are required for both. In previous studies, related to the activation sequence ( ⁇ ) only, the initial estimates involved were derived exclusively from the observed BSPs [31,53,54,55]. The method employed here is based on the general properties of a propagating wave front. From this initial estimate for depolarisation, an estimate of the initial values of the repolarisation marker, ⁇ , is worked out by including the effect of electrotonic interaction on the repolarisation process.
- the myocardium During activation of the myocardium, current flows from the intracellular space of the depolarised myocytes to the intracellular space of any of its neighbours that are still at rest (polarised at their resting potential). The activation of the latter takes about 1 ms and is confined to about 2 mm. The boundary of this region (the activation wave front) propagates toward the tissue at rest until all of the myocardium has been activated. The propagation can be likened to the Huygens process. The local wave front propagates in directions dominated by the orientation of local fibres, at velocities ranging from 0.3 m/s across fibres to 1 m/s along fibres.
- ventricular depolarisation originates from the bundle of His, progresses through the Purkinje system, from which the myocardium is activated [93]. In humans this Purkinje system is mainly located on the lower 2 ⁇ 3 of the endocardial wall [14,15]. In other cases, ventricular activation originates from an ectopic focus or from a combination of the activity of the His-Purkinje system and an ectopic focus.
- the initial estimate of the inverse procedure was based on the identification of one or more sites of initial activation, from which activation propagates. This includes normal activation of the myocardium, which can be interpreted as originating from several foci representing the endpoints of the Purkinje system. The activation sequence resulting from a single focus was derived by using the fastest route algorithm.
- the fastest route algorithm determines the fastest route between any pair of nodes of a fully connected graph [94].
- the term ‘fully connected’ signifies that all nodes of the graph may be reached from any of the other ones by travelling along line segments, called edges, that directly connect pairs of nodes.
- edges not only refers to the edges of the triangles constituting the numerical representation of S v , but also to the paths connecting epicardial and endocardial nodes [95], provided that the straight line connecting them lies entirely within the interior of S v .
- A adjacency matrix
- the element j of any row i of matrix T was interpreted as the activation time at node j resulting from focal activity at node i only.
- v t scales the elements of T, and consequently of ⁇ .
- the intermediate activation sequence, ⁇ , v t was approximated by max( ⁇ )/T QRS , with T QRS the QRS duration (see Table 1).
- the maximum velocity was set at 0.8 m/s. No maximum velocity was defined for nodes in a region potentially containing Purkinje fibers, the nodes in the lower 2 ⁇ 3 of the endocardial surfaces of the left and right ventricles.
- ECGs were computed from (7) at each of the 65 electrode positions (64 lead signals+reference). Note that, with pre-computed matrices B and T, this requires merely the multiplication of the source vector by matrix B.
- the lead signals were restricted to those pertaining to the QRS interval (about 100 samples spaced at 1 ms).
- the entire procedure was carried out iteratively.
- the accepted values for t i were set at 90% of their activation times found from the previous iteration.
- the values for t i were set at 40% of the previous activation times.
- the Purkinje systems is largely insulated from the myocardial tissue. The propagation velocity in this system ranges between 2 and 4 m/s.
- the 40% value of t i represents a 2.5 times higher velocity than the one used in the previous activation sequence, which is usually around 1 m/s. Within the myocardium the differences in velocity are much smaller, limited to approximately 0.7-1 m/s.
- a focus can be selected more than once, in which case its activation time decreases.
- the intracellular current flowing toward a myocyte is positive when originating from neighbours that are at a less advance state of recovery, thus retarding the local repolarisation stemming from ion kinetics. Conversely, the current flows away when originating from neighbours at a more advanced stage of recovery, thus advancing local repolarisation.
- the size of the two domains determines the balance of these currents, and thus the magnitude of the electrotonic interaction. At a site where depolarisation is initiated, the balance is positive, resulting locally in longer action potential durations than those at locations where depolarisation ends.
- the extent of the two domains is determined by the location of the initial sites of depolarisation and overall tissue geometry [99].
- the differences between simulated and recorded potential data are quantified by using the rd measure: the root mean square value of all matrix elements involved relative to those of the recorded data.
- the linear correlation coefficient R between all elements of simulated and reference data is used.
- the weight parameter of the regularisation operator, ⁇ was empirically determined and set to 1.5 10 ⁇ 4 , both while optimizing activation and recovery.
- the upstroke slope, ⁇ (see (1)), was set to 2, resulting in an upstroke slope of 50 mV/ms.
- the parameter ⁇ (12) was tuned such that, for the healthy subject (NH), the linear slope of ⁇ ( ⁇ ) was ⁇ 1.32 (see Franz et al. [24]). This resulted in a value of 7.9 ⁇ 10 ⁇ 3 for ⁇ .
- the initial activation estimated by means of the focal search algorithm is shown in FIG. 6 a .
- the result obtained from the non-linear optimisation procedure based on this initial estimate is shown in FIG. 6 b.
- the initial estimated activation recovery intervals (ARI), derived from the initial activation sequence ( FIG. 6 a ) and the use of equation (12) are shown in FIG. 7 a . Note that areas activated early indeed have a longer ARI than the areas activated late. After optimisation ( FIG. 7 b ) the global pattern is similar to the initial one, with a minimally reduced range (from 182-320 ms to 176-300, see also Table 3). This can also be observed in FIG. 8 , in which the local initial and final ARI values are plotted as a function of activation time. Consequently, the accompanying reduction in the linear regression slope between initial and estimated ARIs and activation times is also smaller (Table 3).
- the average of the estimated ARIs is 7 ms shorter than the initial ARIs.
- the estimated ARI values in the right ventricle shorten more compared to the initial estimate whereas the ARI values in the left ventricle and septum prolong slightly ( FIG. 8 ).
- the measured ECGs and the simulated ECGs based on the estimated activation and recovery times match very well during both the QRS and the STT segment (see FIG. 10 ), as indicated by the small rd value (0.12, Table 1).
- the first focus identified by the focal search algorithm was the Kent bundle ( FIG. 11 a ; see Fisher et al [29]) subsequently 3 focal areas were determined: one on the lower left septal area and two on the right ventricular wall.
- the estimated repolarisation times have a small dispersion (32 ms, see FIG. 11 b ), which is in agreement with the fact that the heart is activated from both the Kent Bundle and the His-Purkinje system.
- FIG. 13 Examples of the inversely computed timing of depolarisation and repolarisation of the Brugada patient are shown in FIG. 13 . These related to two time instants during the procedure: at baseline and just after the last infusion of Ajmaline.
- the effect of the Ajmaline on the ECG can be observed in the rms signal of the recorded BSPs (insets FIG. 13 ): the QRS broadened and the ST segment became slightly elevated following the administration of Ajmaline.
- the first focal area was found on the left side of the septum for the baseline beat and at peak Ajmaline.
- For the baseline beat two additional foci were found, one on the left and one on right lateral wall (see FIG. 13 a ).
- the estimated activation patterns of both analysed beats are similar, although the activation times of the Ajmaline beat were later near the left and right base of the heart ( FIG. 13 a /b).
- the estimated repolarisation times of the baseline beat show a dominant epi- to endocardial recovery sequence.
- the transmural repolarisation difference in the left ventricle remained almost unchanged, though slowly shifted with time. Large differences, however, are found in the right ventricle ( FIG. 13 d ).
- the accompanying ARIs initially show a dispersion of 116 ms increasing up to 193 ms. This expanded range is mainly caused by the very early recovery in the outflow tract area (see FIG. 13 d ).
- the corresponding ECGs of both beats are shown in FIG. 14 .
- the computation time used by the inverse procedure ranged between 1 ⁇ 2 a minute (BG) up to 23 minutes (NH), depending on the number of nodes (Table 1) used in the mesh in the heart's geometry (Table 4).
- ECG data were recorded during infusion of a sodium channel blocker (Ajmaline) [101], 10 bolus infusions of 10 mg, administered at one-minute intervals [102], which changes the activation and/or recovery sequence.
- the beats selected for analysis were: the baseline beat 5 minutes prior to infusion and the beat after the last bolus had been administered.
- the effect of the Ajmaline is expected, for some cases, to be rather local on the epicardium of the right outflow tract [103].
- the mechanism is thought to be a structural change in this area, causing a current to load mismatch between the cardiac cells, i.e. a single cell has to activate too many neighboring cells.
- the TMP amplitude drops and the propagation velocities decreases.
- a drop in amplitude results in an change of the ST segment level.
- the method proposed uses therefore only the first 40 ms (this might also longer or shorter) after the QRS complex to estimate the local TMP amplitude on the heart.
- this is a linear problem, an can therefore be solved directly through an pseudo inverse procedure, we used the Levenberg-Marquardt algorithm in an iterative procedure to determine the TMP amplitudes. This procedure is the same as used in optimizing the activation and recovery times.
- FIG. 15 show that this procedure identifies a small area on the epicardial outflow tract. Initially, at base line no deviation in TMP amplitude is found. After the first infusion of Ajmaline a small drop in TMP is found decreasing up to 35% at peak Ajmaline.
- a first improvement in the initial estimation procedure was the incorporation of global anisotropic propagation in the simulation of ventricular activation.
- the estimated activation wave revealed earlier epicardial activation for subject NH in the anterior part of the left ventricle [104].
- the global handling of trans-mural anisotropy estimated using common accepted insights [18,105,106], improved the overall performance.
- a second improvement concerns the selection of foci in the multi-foci search algorithm.
- the correlation R between measured and simulated ECGs was used, instead of the rd values used previously.
- the idea to investigate the appropriateness of the correlation arose from the observation that the overall morphology of the simulated wave forms closely corresponded to the measured data, in spite of relatively high rd values. This was first observed in an application to the relatively simple atrial activation sequence, frequently involving just the “focus” in the sinus node region [85].
- Each simulated activation sequence of the initial multi-foci search was scaled by an estimation of the global propagation velocity (v l ) derived from the QRS duration, taking into account the differences in propagation velocity in myocardial and Purkinje tissue.
- the QRS duration was derived from the rms(t) curve, computed from all leads referred to a zero-mean signal reference [25]. This produces the optimal estimate of the global onset and completion of the activation process.
- the estimated activation sequence thus not only shows the correct position of the Kent bundle, but also a true fusion type of activation resulting from early activation in the right ventricle and left septum, as is to be expected in this situation.
- a single focus was found at the approximate location of the Kent bundle (see FIG. 11 b ).
- a reduction in propagation velocity of 20-40% can be found [108] after the administration of Ajmaline, which is reflected in the estimated activation sequences before and after Ajmaline administration (compare FIGS. 13 a & b ).
- the dispersion in the recovery times found was smaller than those of the activation times, in agreement with the negative slopes observed for the ⁇ ( ⁇ ) function.
- the ranges of the activation times found were about twice as large as those of the repolarisation times for the normal cases (NH and BG (1 min), Table 3).
- the apex-to-base differences in the recovery times were small (20-30 ms), which is in accordance to literature data [40]. At several sites the local transmural recovery differences were more substantial ( FIG. 10-13 ).
- the inverse procedure requires the measurement of ECG signals at several (e.g. 64) locations on the body surface, a body surface map (BSM).
- BSM body surface map
- the locations of these electrodes have to be recorded accurately to minimize modeling errors.
- the reference used in this for the BSM can be any reference electrode, such as the Wilson central terminal (average of the 3 extremity leads). By default the average of all signals is used as a reference.
- rms root mean square
- the fiducial points of the P wave, QRS and T wave can be found automatically [112]. Other methods to determine the fiducial points automatically may be applied.
- This rms signal of the QRST sequence is used to estimate the downslopes of the repolarization phase [70].
- the T wave part of the T wave is integrated and fitted by two logistic functions that are multiplied (see FIG. 17 ).
- the volume conductor model contains at least the geometries of the thorax, lungs, blood cavities, major blood vessels and the heart. These geometries are constructed from images, for instance MRI (see FIG. 18 ), CT or echo. The edges of the relevant parts are automatically detected (see FIG. 19 ), from which the geometry of each of the parts is reconstructed.
- the used electrical source model is the Equivalent Double layer [109]. This source model is located on the surface of the heart. Currently 7 parameters are used to describe the local Transmembrane Potential (TMP), see FIG. 21 . The number of parameters can be extended, such that a spike and notch are incorporated in the shape of the TMP (see section 1.3).
- ⁇ , ⁇ , . . . are the source parameters.
- the simulated ECG signals at the electrode positions of the BSM lead system are compared to the measured ECGs signals. Due to the non-linear nature of the used source model (equivalent double layer) the associated inverse problem is non-linear and requires an initial estimate for each of the used source parameters.
- the initial estimate for the repolarization and a plateau slope are derived from the ECG (see section Record ECG).
- the initial estimate from the depolarization moments is obtained from the fastest route algorithm, which subsequently is used to derive an initial estimate for the repolarization times. This is described in full detail in section 1.2.4 and 1.2.5.
- the amplitude or resting potential is estimated from the ST segment or TP segment of the measured ECG. Due to the fact that the ECG signals are baseline corrected a drop in TMP amplitude has the same effect as a rise in resting potential. The drop in TMP amplitude might also be temporal due to a prolonged notch in the TMP as in Brugada patients (see FIG. 22 ). All effects are best visible when the electrical activity of the heart is minimal, i.e. the ST segment for the ventricles, and the end P wave till the beginning of the QRS complex for the atria. The associated estimation problem is nearly linear in nature, i.e. the TMP amplitude/resting potential has to be estimated from the a part of the ST segment.
- the initial estimate for this problem is that the amplitude is homogeneous for the whole heart.
- the final result is obtained through the optimization procedure as described section 1.2.3.
- the activation sequence of the atria can be obtained using the same method (see FIG. 23 )
- FIG. 1 Reconstruction of the heart of a healthy 22 year old male.
- the activation starts in the sinus node region, is delayed in the AV node (not shown). After a fast propagation of the activation along special fibers, all myocytes of the ventricle are activated.
- the color scale indicates the elapsed time in ms.
- FIG. 2 Transmembrane potentials (TMP) of pacemaker cells in the sinus node (panel a), or ventricular cells (panel b).
- the pacemaker cells slowly but continuously depolarise until a threshold is reached (black dotted line), initiating the process of fast depolarisation. This depolarisation is immediately followed by the repolarisation, after which the whole cascade starts again.
- panel b two different ventricular TMPs are shown. These TMPs are divided in 5 phases: 0) depolarisation, 1) early repolarisation, 2) plateau phase, 3) repolarisation, and 4) rest state.
- the red (R) waveform is commonly found in the endocardial cells whereas the blue (B) line is found in epicardial cells. The main differences are found in the early repolarisation phase.
- FIG. 3 An ECG signal with the P wave, (atrial activation), QRS complex (activation of the ventricles), and the T wave (recovery of the ventricles).
- FIG. 4 Three equivalent double layers with the same solid angle, and consequently the same external potentials, e.g. on the body surface.
- FIG. 6 Estimated activation sequences of the ventricles of a healthy subject.
- Panel a the initial estimate resulting from the multi-focal search algorithm; the white dots indicate some of the foci that were identified.
- Panel b the result of the subsequently applied non-linear optimisation procedure. Isochrones are drawn at 10 ms intervals. The ventricles are shown in a frontal view (left) and basal view (right).
- FIG. 7 Estimated activation recovery intervals at the ventricular surface of a healthy subject. Initial and final ARIs as generated in the inverse procedure. Panel a: The initial ARI estimate. Panel b: the ARI distribution after optimisation. Remaining legend as in FIG. 6 .
- FIG. 8 Initial and final ARIs as generated in the inverse procedure.
- the solid black line indicates the linear regression line.
- Three areas within the heart have been identified by different markers, right ventricle (green crosses), left ventricle (red circles) and (left and right) septum (blue dots).
- FIG. 9 Recovery sequence as obtained from the inverse procedure. Remaining legend as in FIG. 6 .
- FIG. 10 Standard 12-lead ECG; in solid blue: the measured data; in dashed black: in black the simulated ECG based on the estimated activation and recovery times.
- FIG. 11 The results of the inverse procedure for a fusion beat, i.e. activation initiated by a Kent bundle and the His-Purkinje system (panel a) and for a Kent-bundle-only beat (panel b).
- the estimated activation sequences are shown on the left, the recovery sequences on the right.
- the white dot indicates the position of the Kent bundle as observed invasively. Remaining legend as in FIG. 6 .
- FIG. 12 The simulated (dashed black lines) and measured ECGs for a fusion beat (blue (B) lines), i.e. activation initiated by a Kent bundle and the His-Purkinje system and a beat for which the AV node was blocked by adenosine, leaving only the Kent bundle intact (red (R) lines).
- FIG. 13 Activation (panel a and b) and recovery (panel b and d) of two beats in a Brugada patient during an Ajmaline provocation test.
- Panel a) and c) show the activation respectively the recovery sequence estimated from the baseline ECG.
- Panel b) and d) show the activation respectively the recovery sequence just after the last infusion of the Ajmaline. Color scale is the same for panel a & b and panel c & d. Remaining legend see FIG. 6 .
- FIG. 14 The simulated (dashed black lines) and measured (blue (B) lines) ECGs for the baseline beat of the Brugada patient, and the simulated (dashed black lines) and measured (red (R) lines) ECGs of the beat at peak Ajmaline.
- FIG. 15 The Action potential amplitude, estimated from the first 40 ms of the ST segment (starting after the J point). First 1 baseline beats top left, subsequently after the first infusion of Ajmaline every next minute. Notice the local reduction of the AP amplitude (up to 65%), in the outflow tract area (red color). The color scales on the are fixed between 0.7 and 1.
- FIG. 16 Left panel: The body surface potentials recorded at 64 electrode positions and the root mean square (rms) signal (grey) on top. The fiducial points of start QRS and end T wave are indicated by a*.
- Right panel Example of BSM lead system.
- FIG. 17 Left panel: black crosses (+) indicate the fiducial points; onset QRS, end QRS, and end T wave, the dot indicates the peak of the T wave.
- the green line (G) is the fitted T wave by derivative of the two logistic curves.
- Right panel the integral of the T wave (black) and the fitted integral curve by two logistic curve (grey line).
- FIG. 18 Example a number of MRI images taken from a heart.
- FIG. 19 Top panel: Contours drawn around the left and right ventricle, indicated by blue lines (B). Lungs are indicated by green dots (G), atria and venea cava by red dots (R). Bottom panel: all contours of the required tissues.
- FIG. 20 reconstructed thorax and heart model with the position of the electrodes
- FIG. 21 TMP with the handlers in light grey.
- Top panel TMP with the handlers at the depolarization moment, repolarization moment, amplitude and resting potential.
- Bottom panel handlers for depolarization slope, plateau an repolarization slope.
- FIG. 22 Three different TMP waveforms: black normal TMP waveform without notch (endocardial node), dashed black: TMP waveform with deep and prolonged notch (associated with e.g. Brugada syndrome), Grey: TMP with a rise in TMP resting potential (associated with ischemia).
- FIG. 23 Estimate of the activation sequence of the atria. Atria are in AP view.
Abstract
Description
| TABLE 1 |
| Subjects for whom the ventricular depolarisation |
| and repolarisation sequences were estimated. |
| # nodes on the | |||
| Subject | Type | heart's surface | QRS duration ms |
| WPW | WPW patient | 697 | 119 (fusion beat) |
| 159 (AV blocked) | |||
| BG | Brugada patient | 287 | 104 (baseline) |
| 124 (peak infusion) | |||
| NH | Healthy subject | 1500 | 101 |
| For subject WPW the fusion beat data and after the administration of adenosine to block the AV node. For subject BG the baseline beat data (first row) and after the last administration of Ajmaline are given. | |||
1.2 Methods
1.2.1 Local EDL Strength
describing a sigmoidal curve with maximum slope β/4 at t=τ. The first of these functions described phase (0) of the TMP time course [20], the depolarisation phase, as
D(t;δ)=L(t;δ,β), (2)
with δ the timing of local depolarisation and the factor β setting the steepness of the upstroke.
R(t;ρ)=L(t;ρ,β 1)L(t;ρ,β2), (3)
in which ρ sets the position of the inflection point of the TMP's down slope and β1 and β2 are constants setting its leading and trailing slope. Note that the action potential duration, α, defined as
α=ρ−δ, (4)
represents the time interval between the marker used for the timing of local repolarisation ρ and the timing of local depolarisation δ; it may be interpreted as the activation recovery interval [88].
S(t;δ,ρ)=D(t;δ)R(t;ρ). (5)
φ(t,{right arrow over (y)})=∫S
in which dω({right arrow over (y)},{right arrow over (x)}) is the solid angle subtended at {right arrow over (y)} by the surface element dS({right arrow over (x)}) of Sv and B({right arrow over (y)}, {right arrow over (x)}) is the transfer function expressing the full complexity of the volume conductor (geometry and tissue conductivity). Previous studies [31,70] indicated that an appropriate volume conductor model requires the incorporation of the heart, blood cavities, lungs and thorax. In this study, the conductivity values σ assigned to the individual compartments were: thorax and ventricular muscle: 0.2 S/m, lungs: 0.04 S/m and blood cavities: 0.6 S/m.
with n the number of nodes of the triangulated version of Sv. For each moment in time this amounts to the pre-multiplication of the instantaneous column vector (source) S by a (transfer) matrix B, which incorporates the solid angles subtended by source elements as viewed from the nodes of the triangulated surface, scaled by the relative jump in (σi +−σi −)/(σi ++σi −) of the local conductivity values σi + and σi − at either sides of the interfaces i considered [38,90].
1.2.3 Inverse Computation of Activation and Recovery
arg minδ(∥V−Φ(δ;ρ)∥F 2+μ2 ∥Lδ∥ F 2). (8)
in which dij is the distance along the edge.
1.2.4.2 Edge Velocities
with d and h the lengths of the projections of the edge along Sv and normal to it, respectively. This procedure approximates locally elliptical wave fronts. The
1.2.4.3 The Initial Activation Estimate: Multi-Foci Search
δj=mink(t k +t k,j), k=1 . . . K. (11)
αn=
with
1.2.6 Notations/Quality Measures
| TABLE 2 |
| R and rd values of the 3 subjects, computed over |
| the segments indicated, pertaining to the initial |
| estimate (focal search) and the final solution. |
| Activation & | |||
| Initial activation | Initial recovery | recovery | |
| (QRS segment only) | (QRST segment) | (QRST segment) |
| Subject | rd | correlation | rd | correlation | rd | correlation |
| NH | 0.69 | 0.85 | 0.73 | 0.80 | 0.12 | 0.99 |
| WPW | 2.46 | 0.87 | 2.39 | 0.84 | 0.19 | 0.98 |
| 1.72 | 0.86 | 2.39 | 0.84 | 0.17 | 0.99 | |
| BG | ||||||
| (at 1 min) | 1.41 | 0.89 | 1.31 | 0.82 | 0.15 | 0.99 |
| (at 10 min) | 1.84 | 0.84 | 2.20 | 0.36 | 0.17 | 0.99 |
| TABLE 3 |
| The range of ARI (α), repolarisation times (ρ) and the slope of the |
| linear regression between ARI and depolarisation times (δ). |
| (Initial) Slope | range α | range ρ | |
| Subject | mV/ms | ms | ms |
| NH | (−1.32) −1.17 | 176-300 (124) | 275-324 (49) |
| WPW (fusion) | (−1.21) −0.83 | 168-263 (95) | 271-306 (35) |
| (AV block) | (−1.08) −0.93 | 119-268 (149) | 248-336 (88) |
| BG (at 1 min) | (−1.27) −1.12 | 182-297 (116) | 244-317 (73) |
| (at 10 min) | (−1.26) −0.92 | 108-302 (193) | 183-358 (174) |
| All values shown relate to the final solution. | |||
| TABLE 4 |
| Computation times of the focal search algorithm |
| and the optimisation procedure. |
| Focal search | Optimisation |
| Computation | # | Computation | ||
| Subject | # scans | time s | iterations | |
| NH |
| 9 | 233 | 10 | 1143 | |
| WPW (fusion) | 4 | 61 | 17 | 208 |
| (AV block) | 2 | 23 | 85 | 993 |
| BG (at 1 min) | 6 | 6 | 23 | 31 |
| (at 10 min) | 1 | 1 | 36 | 46 |
| Some foci in the multi-focal search were optimised more than once, resulting in more scans than foci. Within the optimisation procedure one iteration includes the optimisation of depolarisation times (δ) and repolarisation times (ρ). |
1.3.5 Amplitude Estimation of the Local Transmembrane Potential (TMP) Amplitude Based on the ST Segment of the ECG
Brugada Patient Data:
ECGsim(t)=A·S(δ,ρ, . . . ,t)
- 1 Kléber, A. G. Intercellular communication and impulse propgation. Cardiac Electrophysiology From cell to bedside. D. P. Zipes and J. Jalife. Philadelphia, Saunders. 2004, 213-221.
- 2 Anderson, K. R., S. Y. Ho and R. H. Anderson. Location and vascular supply of sinus node in human heart. Britisch Heart Journal 41(1): 28-32, 1979
- 3 Kléber, A. G. and Y. Rudy. Basic Mechanisms of Cardiac Impulse Propagation and Associated Arrhythmias. Physical Review 84(2): 431-488, 2004
- 4 Saffitz, J. E., H. L. Kanter, K. G. Green, T. K. Tolley and E. C. Beyer. Tissue-specific determinants of anisotropic conduction velocity in canine atrial and ventricular myocardium. Circulation Research 74(6): 1065-1070, 1994
- 5 Roberts, D., L. Hersh and A. Scher. Influence of cardiac fiber orientation on wavefront voltage, conduction velocity, and tissue resistivity in the dog. Circulation Research 44: 701-712, 1979
- 6 Spach, M. S., P. C. Dolber and J. F. Heidlage. Influence of the passive anisotropic properties on directional differences in propagation following modification of the sodium conductance in human atrial muscle. Circulation Research 62: 811-832, 1988
- 7 Spach, M. S., W. T. Miller, P. C. Dolber, J. M. Koorsey, J. R. Sommer and C. E. Mosher. The functional role of structural complexities in the propagation of depolarization in the atrium of the dog. Circulation Research 50(2): 175-191, 1982
- 8 Ho, S. Y., R. H. Anderson and D. Sanchez-Quintana. Atrial structure and fibres: morphologic bases of atrial conduction. Cardiovascular Research 54(2): 325-336, 2002
- 9 Hansson, A., M. Holm, P. Blomstrom, R. Johansson, C. Luhrs, J. Brandt and S. B. Olsson. Right atrial free wall conduction velocity and degree of anisotropy in patients with stable sinus rhythm studied during open heart surgery. European Heart Journal 19: 293-300, 1998
- 10 Wang, K., S. Y. Ho, D. G. Gibson and R. H. Anderson. Architecture of atrial muscle in humans. Britisch Heart Journal 73: 559-565, 1995
- 11 Schuessler, R. B., T. Kawamoto, E. Dwight, M. D. Hand, M. Mitsuno, B. I. Bromberg, J. L. Cox and J. P. Boineau. Simultaneous epicardial and endocardial activation sequence mapping in the isolated canine right atrium. Circulation 88(1): 250-263, 1993
- 12 Anderson, R. H., S. Y. Ho and A. E. Becker. Anatomy of the human atrioventricular junctions revisited. The Anatomical Record 260(1): 81-91, 2000
- 13 Tawara, S. Die Topographie and Histologie der Bruckenfasern. Ein Beitrag zur Lehre von der Bedeutung der Purkinjeschen faden. Zentralb Physiol 19: 70-76, 1906
- 14 Demoulin, J. C. and H. E. Kulbertus. Histopathological examination of concept of left hemiblock. Britisch Heart Journal 34(8): 807-814, 1972
- 15 Oosthoek, P. W., S. Viragh, W. H. Lamers and A. F. Moorman. Immunohistochemical delineation of the conduction system. II: The atrioventricular node and Purkinje fibers. Circulation Research 73(3): 482-491, 1993
- 16 Durrer, D., R. T. van Dam, G. E. Freud, M. J. Janse, F. L. Meijler and R. C. Arzbaecher. Total excitation of the isolated human heart. Circulation 41: 899-912, 1970
- 17 Greenbaum, R. A., S. Y. Ho, D. G. Gibson, A. E. Becker and R. H. Anderson. Left ventricular fibre architecture in man. Britisch Heart Journal 45: 248-263, 1981
- 18 Streeter, D. D. J., H. M. Spotnitz, D. P. Patel, J. J. Ross and E. H. Sonnenblick. Fiber orientation in the canine left ventricle during diastole and systole. Circulation Research 24: 339-347, 1969
- 19 Vetter, F. J., S. B. Simons, S. Mironov, C. J. Hyatt and A. M. Pertsov. Epicardial Fiber Organization in Swine Right Ventricle and Its Impact on Propagation. Circulation Research 96(2): 244-251, 2005
- 20 Katz, A. M. Physiology of the heart. Philadelphia, Lippincott Williams & Wilkins, 2006
- 21 Burgess, M. J., L. S. Green, K. Millar, R. Wyatt and J. A. Abildskov. The sequence of normal ventricular recovery. American Heart Journal 84/5: 660-669, 1972
- 22 Cowan, J. C., C. J. Hilton, C. J. Griffiths, S. Tansuphaswadikul, J. P. Bourke, A. Murray and R. W. F. Campbell. Sequence of epicardial repolarization and configuration of the T wave. Britisch Heart Journal 60: 424-433, 1988
- 23 Millar, C. K., F. A. Kralios and R. L. Lux. Correlation between refractory periods and activation-recovery intervals from electrograms: effects of rate and adrenergic interventions. Circulation 72(6): 1372-1379, 1985
- 24 Franz, M. R., K. Bargheer, W. Rafflenbeul, A. Haverich and P. R. Lichtlen. Monophasic action potential mapping in a human subject with normal electrograms: direct evidence for the genesis of the T wave. Circulation 75/2: 379-386, 1987
- 25 Ihara, Z., A. van Oosterom and R. Hoekema. Atrial repolarization as observable during the PQ interval. Journal of Electrocardiology 39(3): 290-297, 2006
- 26 De Ponti, R., S. Y. Ho, J. A. Salerno-Uriarte, M. Tritto and G. Spadacini. Electroanatomic Analysis of Sinus Impulse Propagation in Normal Human Atria. J Cardiovasc Electrophysiol 13(1): 1-10, 2002
- 27 Hill, A. J., T. G. Laske, J. J. A. Coles, D. C. Sigg, N. D. Skadsberg, S. A. Vincent, C. L. Soule, W. J. Gallagher and P. A. Iaizzo. In Vitro Studies of Human Hearts. Annals of Thoracic Surgery 79(1): 168-177, 2005
- 28 Wyndham, C. R. M., T. Smith, A. Saxema, S. Engleman, R. M. Levitsky and K. M. Rosen. Epicardial activation of the intact human heart without conduction defect. Circulation 59(1): 161-168, 1979
- 29 Fischer, G., F. Hanser, B. Pfeifer, M. Seger, C. Hintermuller, R. Modre, B. Tilg, T. Trieb, T. Berger, F. X. Roithinger, et al. A Signal Processing Pipeline for Noninvasive Imaging of Ventricular Preexcitation. Methods of Information in Medicine 44: 588-515, 2005
- 30 Ghanem, R. N., P. Jia, C. Ramanathan, K. Ryu, A. Markowitz and Y. Rudy. Noninvasive Electrocardiographic Imaging (ECGI): Comparison to intraoperative mapping in patients. Heart Rhythm 2(4): 339-354, 2005
- 31 Huiskamp, G. J. H. and A. van Oosterom. The depolarization sequence of the human heart surface computed from measured body surface potentials. IEEE Transactions on Biomedical Engineering 35(12): 1047-1058, 1988
- 32 Huiskamp, G. J. M., T. F. Oostendorp, N. H. J. Pijls and A. van Oosterom. Invasive confirmation of the human ventricular activation sequence as computed from body surface potentials. Computers in Cardiology '92, Los Alamitos, IEEE Computer Society Press, 1993.
- 33 Einthoven, W. and K. de Lint. Ueber das normale menschliche Elektrokardiogram and Uber die capillar-elektrometrische Untersuchung einiger Herzkranken. Pflugers Arch ges Physiol 80: 139-160, 1900
- 34 Schalij, M. J., M. J. Janse, A. van Oosterom, v. d. W. E. E. and H. J. J. Wellens, Eds. Einthoven 2002: 100 Yeart of Electrocardiography. Leiden, The Einthoven Foundation. 2002
- 35 Burger, H. C. and J. B. v. Milaan. Heart Vector and Leads. Britisch Heart Journal 8: 157-161, 1946
- 36 Frank, E. An accurate, clinically practical system for spatial vectorcardiography. Circulation 13(5): 737-49, 1956
- 37 Geselowitz, D. B. Multipole Representation for an Equivalent Cardiac Generator. Proc IRE: 75-79, 1960
- 38 Gulrajani, R. M. The forward problem in electrocardiography. Bioelectricity and Biomagnetism. New York, John Wiley & Sons. 1998, 348-380.
- 39 Gulrajani, R. M. The inverse problem in electrocardiography. Bioelectricity and Biomagnetism. New York, John Wiley & Sons. 1998, 381-431.
- 40 Ramanathan, C., P. Jia, R. Ghanem, K. Ryu and Y. Rudy. Activation and repolarization of the normal human heart under complete physiological conditions. PNAS 103(16): 6309-6314, 2006
- 41 Huiskamp, G. J. M. and F. Greensite. A New Method for Myocardial Activation Imaging. IEEE Transactions on Biomedical Engineering 44(6): 433-446, 1997
- 42 Martin, R. O. and T. C. Pilkington. Unconstrained Inverse Electrocardiography. IEEE Transactions on Biomedical Engineering 19(4): 276-285, 1972
- 43 Colli-Franzone, P., L. Guerri, S. Tentonia, C. Viganotti, S. Baruffi, S. Spaggiari and B. Taccardi. A mathematical procedure for solving the inverse potential problem of electrocardiography. Analysis of the time-space accuracy from in vitro experimental data. Mathematical Biosciences 77: 353-396, 1985
- 44 Colli-Franzone, P. C., L. Guerri, B. Taccardi and C. Viganotti. The direct and inverse potential problems in electrocardiology. Numerical aspects of some regularization methods and application to data collected in dog heart experiments. Pavia, I. A. N.-C. N. R., 1979
- 45 Ghosh, S. and Y. Rudy Application of L1-Norm Regularization to Epicardial Potential Solution of the Inverse Electrocardiography Problem. Annals of Biomedical Engineering 37(5): 902-912, 2009
- 46 Gulrajani, R. M., P. Savard and F. A. Roberge. The inverse problem in electrocardiography: solution in terms of equivalent sources. CRC Critical Reviews in Biomed. Eng. 16: 171-214, 1988
- 47 Rudy, Y. and B. J. Messinger-Rapport. The Inverse Problem in Electrocardiology: Solutions in Terms of Epicardial Potentials. CRC Critical Reviews in Biomed. Eng. 16: 215-268, 1988
- 48 Wilson, F. N., A. G. Macleod and P. S. Barker. The Distribution of Action Currents produced by the Heart Muscle and Other Excitable Tissues immersed in Conducting Media. J Gen Physiol 16: 423-456, 1933
- 49 Durrer, D. and L. H. van der Tweel. Spread of activation in the left ventricular wall of the dog. American Heart Journal 46: 683-691, 1953
- 50 Scher, A. M., A. C. Young, A. L. Malmgren and R. R. Paton. Spread of Electrical Activity Through the Wall of the Ventricle. Cardiovascular Research 1: 539-547, 1953
- 51 Salu, Y. Relating the Multipole Moments of the Heart to Activated Parts of the Epicardium and Endocardium. Annals of Biomedical Engineering 6: 492-505, 1978
- 52 van Oosterom, A. Solidifying the Solid Angle. Journal of Electrocardiology 35S: 181-192, 2002
- 53 Cuppen, J. J. M. Calculating the Isochrones of Ventricular Depolarization. SIAM J Sci Stat Comp 5: 105-120, 1984
- 54 Modre, R., B. Tilg, G. Fischer, F. Hanser, B. Messarz and J. Segers. Atrial noninvasive activation mapping of paced rhythm data. J Cardiovasc Electrophysiol 13: 712-719, 2003
- 55 Roozen, H. and A. van Oosterom. Computing the activation sequence at the ventricular heart surface from body surface potentials. Medical & Biological Engineering & Computing 25: 250-260, 1987
- 56 Geselowitz, D. B. On the Theory of the Electrocardiogram. Proc IEEE 77/6: 857-876, 1989
- 57 Geselowitz, D. B. Description of cardiac sources in anisotropic cardiac muscle. Application of bidomain model. Journal of Electrocardiology 25 Sup.: 65-67, 1992
- 58 Huiskamp, G. J. M. Simulation of depolarization and repolarization in a membrane equations based model of the anisotropic ventricle. IEEE Transactions on Biomedical Engineering 45(7): 847-855, 1998
- 59 Jacquemet, V., A. van Oosterom, J. M. Vesin and L. Kappenberger. Analysis of electrocardiograms during atrial fibrillation. IEEE Eng Med Biol Mag 25(6): 79-88, 2006
- 60 Simms, H. D. and D. B. Geselowitz. Computation of Heart Surface Potentials Using the Surface Source Model. J Cardiovasc Electrophysiol 6: 522-531, 1995
- 61 van Oosterom, A. The dominant T wave and its significance. J Cardiovasc Electrophysiol 14(10 Suppl): S180-7, 2003
- 62 Modre, R., B. Tilg, G. Fisher and P. Wach. Noninvasive myocardial activation time imaging: a novel; inverse algorithm applied to clinical ECG mapping data. IEEE Transactions on Biomedical Engineering 49(10): 1153-1161, 2002
- 63 Gulrajani, R. M. The forward problem in electrocardiography. Bioelectricity and Biomagnetism. New York, John Wiley & Sons. 1998, 348-380.
- 64 Berger, T., G. Fischer, B. Pfeifer, R. Modre, F. Hanser, T. Trieb, F. X. Roithinger, M. Stuehlinger, O. Pachinger, B. Tilg, et al. Single-Beat Noninvasive Imaging of Cardiac Electrophysiology of Ventricular Pre-Excitation. J Am Coll Cardiol: 2045-52, 2006
- 65 Cuffin, B. N. and D. Geselowitz. Studies on the electrocardiogram using realistic cardiac and torso models. IEEE Transactions on Biomedical Engineering 24(3): 242-252, 1977
- 66 Huiskamp, G. J. M. and A. van Oosterom. Tailored versus realistic geometry in the inverse problem of electrocardiography. IEEE Transactions on Biomedical Engineering 36: 827-835, 1989
- 67 van Oosterom, A. and T. F. Oostendorp. ECGSIM: an interactive tool for studying the genesis of QRST waveforms. Heart 90(2): 165-168, 2004
- 68 van Oosterom, A. and G. J. M. Huiskamp. The effect of torso inhomogeneities on body surface potentials quantified by using tailored geometry. Journal of Electrocardiology 22: 53-72, 1989
- 69 Rudy, Y. and J. E. Burns. Noninvasive Electrocardiographic Imaging. Ann. Noninv. Electrocardiol. 4: 340-359, 1999
- 70 van Oosterom, A. Genesis of the T wave as based on an equivalent surface source model. Journal of Electrocardiography 34(Supplement 2001): 217-227, 2001
- 71 van Oosterom, A. and V. Jacquemet. Genesis of the P wave: Atrial signals as generated by the equivalent double layer source model. Europace 7(s2): S21-29, 2005
- 72 van Oosterom, A. and V. Jacquemet. A Parameterized Description of Transmembrane Potentials used in Forward and Inverse Procedures. Int Conf Electrocardiol, Gdansk; Poland, Folia Cardiologica, 2005.
- 73 Huiskamp, G. J. M. and A. van Oosterom. The depolarization sequence of the human heart surface computed from measured body surface potentials. IEEE Transactions on Biomedical Engineering 35(12): 1047-1058, 1988
- 74 Greensite, F. Remote reconstruction of confined wavefront propagation. Inverse Problems 11: 361-370, 1995
- 75 Colli-Franzone, P. and L. Guerri. Mathematical Model of the Exitation Process in Myocardial Tissue: Influence of Fiber Rotation on Wavefront Propagation and Potential Field. Mathematical Biosciences 101: 155-235, 1990
- 76 Henriquez, A. P., R. Vogel, B. J. Muller-Borer, C. S. Henriquez, R. Weingart and W. E. Cascio. Influence of dynamic gap junction resistance on impulse propagation in ventricular myocardium: a computer simulation study. Biophysical Journal 81(4): 2112-21, 2001
- 77 Potse, M., B. Dube, J. Richer, A. Vinet and R. M. Gulrajani. A comparison of monodomain and bidomain reaction-diffusion models for action potential propagation in the human heart. IEEE Transactions on Biomedical Engineering 53(12): 2425-2435, 2006
- 78 Rudy, Y. and W. L. Quan. A model study of the effects of the discrete cellular structure on electrical propagation in cardiac tissue. Circulation Research 61: 815-823, 1987
- 79 Siregar, P., J. P. Sinteff, N. Julen and P. Le Beux. An Interactive 3D Anisotropic Cellular Automata Model of the Heart. Computers and Biomedical Research 31(5): 323-347, 1998
- 80 Werner, C. D., F. B. Sachse and O. Dossel. Electrical excitation propagation in the human heart. International Journal of Bioelectromagnetism 2(2), 2000
- 81 Sermesant, M., E. Konuko{tilde over (g)}lu, H. Delingette, Y. Coudière, P. Chinchapatnam, K. Rhode, R. Razavi and N. Ayache. An Anisotropic Multi-front Fast Marching Method for Real-Time Simulation of Cardiac Electrophysiology. Functional Imaging and Modeling of the Heart. 2007, 160-169.
- 82 Sethian, J. A. A fast marching level set method for monotonically advancing fronts. Proceedings of the National Academy of Sciences 93(4): 1591-1595, 1996
- 83 Dijkstra, E. W. A Note on Two Problems in Connection with Graphs. Numerische Mathematik 1: 269-271, 1959
- 84 van Dam, P. M. and A. van Oosterom. Volume conductor effects involved in the genesis of the P wave. Europace 7: S30-S38, 2005
- 85 van Dam, P. M. and A. van Oosterom. Atrial Excitation Assuming Uniform Propagation. Journal of Cardiovascular Electrophysiology 14(s10): S166-S171, 2003
- 86 Linnenbank, A. C., A. van Oosterom, T. F. Oostendorp, P. van Dessel, A. C. Van Rossum, R. Coronel, H. L. Tan and J. M. De Bakker. Non-invasive imaging of activation times during drug-induced conduction changes. World Congress on Medical Physics and Biomedical Engineering, IFMBE, Seoul, 2006.
- 87 Wolpert, C., C. Echternach, C. Veltmann, C. Antzelevitch, G. P. Thomas, S. Spehl, F. Streitner, J. Kuschyk, R. Schimpf, K. K. Haase, et al. Intravenous drug challenge using flecainide and ajmaline in patients with Brugada syndrome. Heart rhythm 2(3): 254-260, 2005
- 88 Haws, C. W. and R. L. Lux. Correlation Between In Vivo Transmembrane Action Potential Durations and Activation-Recovery Intervals From Electrograms. Circulation 81(1): 281-288, 1990
- 89 van Oosterom, A. The Singular Value Decomposition of the T wave: Its Link with a Biophysical Model of Repolarization. Int. J. Bioelectromagnetism 4: 59-60, 2002
- 90 van Oosterom, A., Ed. Electrocardiography. The Biophysics of Heart and Circulation. Bristol, Inst of Physics Publ.1993
- 91 Marquardt, D. W. An algorithm for least-squares estimation of non-linear parameters. J. Soc. Indust. Appl. Math. 11(2): 431-441, 1963
- 92 Huiskamp, G. J. M. Difference formulas for the surface Laplacian on a triangulated surface. Journal of Computational Physics 95(2): 477-496, 1991
- 93 van Dam, R. T. and M. J. Janse. Activation of the heart. Comprehensive Electrocardiology. P. W. Macfarlane and T. T. V. Lawrie. Oxford, Pergamon Press. 1989.
- 94 Wilson, R. J. Introduction to graph theory. London, Longman, 1975
- 95 van Oosterom, A. and P. M. van Dam. The intra-myocardial distance function as used in the inverse computation of the timing of depolarization and repolarization. Computers in Cardiology Lyon, France, IEEE Computer Society Press, 2005.
- 96 Brody, D. A. A theoretical analysis of intracavitary blood mass influence on the heart-lead relationship. Circulation Research IV: 731-738, 1956
- 97 Sano, T., N. Takayama and T. Shimamoto. Directional Differences of Conduction Velocity in the Cardiac Ventricular Syncytium Studied by Microelectrodes. Circulation Research VII: 262-267, 1959
- 98 Spach, M. S. and P. C. Dolber. Relating extracellular potentials and their derivatives to anisotropic propagation at a microscopic level in human cardiac muscle. Evidence for electrical uncoupling of side-to-side fiber connections with increasing age. Circulation Research 58(3): 356-71, 1986
- 99 van Oosterom, A. and V. Jacquemet. The effect of tissue geometry on the activation recovery interval of atrial myocytes. Physica D: Nonlinear Phenomena 238(11-12): The effect of tissue geometry on the activation recovery interval of atrial myocytes, 2009
- 100 van Oosterom, A. The dominant T wave. Journal of
Electrocardiology 37 Suppl: 193-7, 2004 - 101 Linnenbank, A. C., A. van Oosterom, T. F. Oostendorp, P. van Dessel, A. C. Van Rossum, R. Coronel, H. L. Tan and J. M. De Bakker. Non-invasive imaging of activation times during drug-induced conduction changes. World Congress on Medical Physics and Biomedical Engineering, IFMBE, Seoul, 2006.
- 102 Wolpert, C., C. Echternach, C. Veltmann, C. Antzelevitch, G. P. Thomas, S. Spehl, F. Streitner, J. Kuschyk, R. Schimpf, K. K. Haase, et al. Intravenous drug challenge using flecainide and ajmaline in patients with Brugada syndrome. Heart rhythm 2(3): 254-260, 2005
- 103 Coronel, R., S. Casini, T. T. Koopmann, F. J. G. Wilms-Schopman, A. O. Verkerk, J. R. de Groot, Z. Bhuiyan, C. R. Bezzina, M. W. Veldkamp, A. C. Linnenbank, et al. Right Ventricular Fibrosis and Conduction Delay in a Patient With Clinical Signs of Brugada Syndrome: A Combined Electrophysiological, Genetic, Histopathologic, and Computational Study. Circulation 112(18): 2769-2777, 2005
- 104 van Dam, P., T. Oostendorp and A. van Oosterom. Application of the fastest route algorithm in the interactive simulation of the effect of local ischemia on the ECG. Medical & Biological Engineering & Computing 47(1): 11-20, 2009
- 105 Spach, M. S., W. T. Miller, E. Miller-Jones, R. B. Warren and R. C. Barr. Extracellular potentials related to intracellular action potentials during impulse conduction in anisotropic canine cardiac muscle. Circulation Research 45: 188-204, 1979
- 106 Wang, Y. and Y. Rudy. Action potential propagation in inhomogeneous cardiac tissue: safety factor considerations and ionic mechanism. Am J Physiol Heart Circ Physiol 278: H1019-29, 2000
- 107 Janse, M. J., E. A. Sosunov, R. Coronel, T. Opthof, E. P. Anyukhovsky, J. M. T. de Bakker, A. N. Plotnikov, I. N. Shlapakova, P. Danilo, Jr., J. G. P. Tijssen, et al. Repolarization Gradients in the Canine Left Ventricle Before and After Induction of Short-Term Cardiac Memory. Circulation 112(12): 1711-1718, 2005
- 108 Romero Legarreta, I., S. Bauer, R. Weber dos Santos, H. Koch and M. Bär. Spatial Properties and Effects of Ajmaline for Epicardial Propagation on Isolated Rabbit Hearts: Measurements and a Computer Study. Computers in Cardiology Durham, N.C., USA, 2007.
- 109 van Oosterom, A. The Equivalent Surface Source Model in its Application to the T Wave. Electrocardiology '01, Univ Press São Paolo, 2002.
- 110 Ghanem, R. N., J. E. Burnes, A. L. Waldo and Y. Rudy. Imaging Dispersion of Myocardial Repolarization, II: Noninvasive Reconstruction of Epicardial Measures. Circulation 104(11): 1306-1312, 2001
- 111 Wilde, A. A. M. and C. Antzelevitch. The continuing story: The aetiology of Brugada syndrome: functional or structural basis? European Heart J 24(22): 2073-a-, 2003112
- 112 Barbaro, V., P. Bartolini and M. Fierli. New algorithm for the detection of the ECG fiducial point in the averaging technique. Medical and Biological Engineering and Computing 29(2): 129-135, 1991
Claims (22)
Applications Claiming Priority (4)
| Application Number | Priority Date | Filing Date | Title |
|---|---|---|---|
| EP09163688 | 2009-06-24 | ||
| EP09163688A EP2266459A1 (en) | 2009-06-24 | 2009-06-24 | Inverse imaging of electrical activity of a heart muscle |
| EP09163688.6 | 2009-06-24 | ||
| PCT/NL2010/050397 WO2010151130A1 (en) | 2009-06-24 | 2010-06-24 | Inverse imaging of electrical activity of a heart muscle |
Publications (2)
| Publication Number | Publication Date |
|---|---|
| US20120157822A1 US20120157822A1 (en) | 2012-06-21 |
| US8838203B2 true US8838203B2 (en) | 2014-09-16 |
Family
ID=41281151
Family Applications (1)
| Application Number | Title | Priority Date | Filing Date |
|---|---|---|---|
| US13/380,244 Expired - Fee Related US8838203B2 (en) | 2009-06-24 | 2010-06-24 | Inverse imaging of electrical activity of a heart muscle |
Country Status (6)
| Country | Link |
|---|---|
| US (1) | US8838203B2 (en) |
| EP (2) | EP2266459A1 (en) |
| AU (1) | AU2010263357B2 (en) |
| CA (1) | CA2766478A1 (en) |
| WO (1) | WO2010151130A1 (en) |
| ZA (1) | ZA201200286B (en) |
Cited By (13)
| Publication number | Priority date | Publication date | Assignee | Title |
|---|---|---|---|---|
| US20130131529A1 (en) * | 2011-10-12 | 2013-05-23 | Cardioinsight Technologies, Inc. | Sensing zone for spatially relevant electrical information |
| EP3092943A1 (en) | 2015-05-13 | 2016-11-16 | EP Solutions SA | Systems, components, devices and methods for cardiac mapping using numerical reconstruction of cardiac action potentials |
| US10575746B2 (en) | 2017-12-14 | 2020-03-03 | Biosense Webster (Israel) Ltd. | Epicardial mapping |
| US10617314B1 (en) | 2019-06-10 | 2020-04-14 | Vektor Medical, Inc. | Heart graphic display system |
| US10709347B1 (en) | 2019-06-10 | 2020-07-14 | Vektor Medical, Inc. | Heart graphic display system |
| US10860754B2 (en) | 2018-04-26 | 2020-12-08 | Vektor Medical, Inc. | Calibration of simulated cardiograms |
| US10856816B2 (en) | 2018-04-26 | 2020-12-08 | Vektor Medical, Inc. | Machine learning using simulated cardiograms |
| US10952794B2 (en) | 2018-11-13 | 2021-03-23 | Vektor Medical, Inc. | Augmentation of images with source locations |
| US11259871B2 (en) | 2018-04-26 | 2022-03-01 | Vektor Medical, Inc. | Identify ablation pattern for use in an ablation |
| US11338131B1 (en) | 2021-05-05 | 2022-05-24 | Vektor Medical, Inc. | Guiding implantation of an energy delivery component in a body |
| US11534224B1 (en) | 2021-12-02 | 2022-12-27 | Vektor Medical, Inc. | Interactive ablation workflow system |
| US11896432B2 (en) | 2021-08-09 | 2024-02-13 | Vektor Medical, Inc. | Machine learning for identifying characteristics of a reentrant circuit |
| US11957471B2 (en) | 2023-03-20 | 2024-04-16 | Vektor Medical, Inc. | Heart graphic display system |
Families Citing this family (27)
| Publication number | Priority date | Publication date | Assignee | Title |
|---|---|---|---|---|
| WO2013040546A1 (en) * | 2011-09-16 | 2013-03-21 | University Of Pittsburgh - Of The Commonwealth | Noncontact electrophysiological measurement and imaging of the heart |
| WO2013169914A1 (en) * | 2012-05-08 | 2013-11-14 | Northwestern University | Using intracardiac electrograms to predict location of fibrosis and autonomic nerves in the heart |
| CN105324072B (en) * | 2013-01-17 | 2018-09-04 | 科迪影技术股份有限公司 | Lesion point is identified and is drawn |
| US11172860B2 (en) | 2014-05-06 | 2021-11-16 | Peacs Investments B.V. | Estimating distribution fluctuation and/or movement of electrical activity through a heart tissue |
| US10779743B2 (en) | 2014-05-06 | 2020-09-22 | Peacs B.V. | Estimating distribution, fluctuation and/or movement of electrical activity through a heart tissue |
| US9538930B2 (en) * | 2014-06-05 | 2017-01-10 | Guangren CHEN | Linear multi-domain electrocardiogram |
| US9545203B2 (en) * | 2014-06-05 | 2017-01-17 | Guangren Chen | Systems and methods for cardiomyocyte conduction speed mapping |
| CN106456032B (en) * | 2014-06-05 | 2019-11-05 | 陈光人 | System and method for detecting ECG sub-waveform |
| ES2572142B1 (en) * | 2014-10-30 | 2017-06-21 | Fundación Para La Investigación Biomédica Del Hospital Gregorio Marañón | CARDIAC ARRITMIAS LOCATION DEVICE |
| WO2017001912A1 (en) | 2015-07-02 | 2017-01-05 | Swissnovation Gmbh | System and method for providing a representation of cardiac cell charge state |
| US11289207B2 (en) | 2015-07-09 | 2022-03-29 | Peacs Investments B.V. | System for visualizing heart activation |
| WO2017035522A1 (en) * | 2015-08-27 | 2017-03-02 | Northeastern University | Determining geometric changes, rotations, and/or translations of the heart based on electrocardiogram measurements |
| US11458320B2 (en) | 2016-09-06 | 2022-10-04 | Peacs Investments B.V. | Method of cardiac resynchronization therapy |
| US10471263B2 (en) | 2016-09-06 | 2019-11-12 | Catheter Precision, Inc. | System and method for cardiac resynchronization |
| WO2018190716A1 (en) | 2017-04-12 | 2018-10-18 | Peacs B.V. | Mean tsi feature based determination method and system |
| US10863916B2 (en) | 2017-06-21 | 2020-12-15 | Boston Scientific Scimed Inc | Dynamic repolarization substrate mapping |
| US10713790B2 (en) | 2017-08-01 | 2020-07-14 | Catheter Precision, Inc. | Methods of cardiac mapping and directional guidance |
| US10932863B2 (en) | 2017-08-01 | 2021-03-02 | Catheter Precision, Inc. | Methods of cardiac mapping and directional guidance |
| US11246662B2 (en) | 2017-08-01 | 2022-02-15 | Catheter Precision, Inc. | Methods of cardiac mapping and model merging |
| CN111295225A (en) | 2017-11-02 | 2020-06-16 | 心脏起搏器股份公司 | System for identifying his bundle pacing capture |
| US10665338B2 (en) * | 2018-02-22 | 2020-05-26 | Biosense Webster (Israel) Ltd. | Automatic identification of multiple activation pathways |
| CN109270492B (en) * | 2018-09-27 | 2022-11-25 | 重庆大学 | Regularization parameter selection method for large holographic distance |
| US11607272B2 (en) * | 2019-11-12 | 2023-03-21 | Biosense Webster (Israel) Ltd. | Visual route indication for activation clusters |
| CN110946569B (en) * | 2019-12-24 | 2023-01-06 | 浙江省中医院 | Multichannel body surface electrocardiosignal synchronous real-time acquisition system |
| US11947270B2 (en) * | 2020-02-26 | 2024-04-02 | Fei Company | Metrology of semiconductor devices in electron micrographs using fast marching level sets |
| EP3957247B1 (en) * | 2020-08-21 | 2024-02-14 | Tata Consultancy Services Limited | Method and system for determining myocardial ischemia severity based on hemodynamic parameters estimation |
| US20230020372A1 (en) * | 2021-07-19 | 2023-01-19 | Biosense Webster (Israel) Ltd. | Layered multi-activation local activation times (lat) mapping |
Citations (8)
| Publication number | Priority date | Publication date | Assignee | Title |
|---|---|---|---|---|
| US20050222515A1 (en) * | 2004-02-23 | 2005-10-06 | Biosignetics Corporation | Cardiovascular sound signature: method, process and format |
| US6990370B1 (en) | 1992-09-23 | 2006-01-24 | Endocardial Solutions, Inc. | Method for mapping heart electrophysiology |
| US20070270703A1 (en) * | 2006-05-10 | 2007-11-22 | Regents Of The University Of Minnesota | Methods and apparatus of three dimensional cardiac electrophysiological imaging |
| US20080009758A1 (en) * | 2006-05-17 | 2008-01-10 | Voth Eric J | System and method for mapping electrophysiology information onto complex geometry |
| US20080177192A1 (en) * | 2007-01-18 | 2008-07-24 | General Electric Company | Determination of cellular electrical potentials |
| US20080234564A1 (en) * | 1992-09-23 | 2008-09-25 | Beatty Graydon E | Electrophysiology therapy catheter |
| US20100179421A1 (en) * | 2007-05-24 | 2010-07-15 | Joe Tupin | System and method for non-invasive instantaneous and continuous measurement of cardiac chamber volume. |
| US20120143030A1 (en) * | 2008-10-27 | 2012-06-07 | Rhythmia Medical, Inc. | Tracking system using field mapping |
-
2009
- 2009-06-24 EP EP09163688A patent/EP2266459A1/en not_active Withdrawn
-
2010
- 2010-06-24 WO PCT/NL2010/050397 patent/WO2010151130A1/en active Application Filing
- 2010-06-24 CA CA2766478A patent/CA2766478A1/en not_active Abandoned
- 2010-06-24 US US13/380,244 patent/US8838203B2/en not_active Expired - Fee Related
- 2010-06-24 EP EP10728427A patent/EP2445398A1/en not_active Ceased
- 2010-06-24 AU AU2010263357A patent/AU2010263357B2/en not_active Ceased
-
2012
- 2012-01-13 ZA ZA2012/00286A patent/ZA201200286B/en unknown
Patent Citations (9)
| Publication number | Priority date | Publication date | Assignee | Title |
|---|---|---|---|---|
| US6990370B1 (en) | 1992-09-23 | 2006-01-24 | Endocardial Solutions, Inc. | Method for mapping heart electrophysiology |
| US20080234564A1 (en) * | 1992-09-23 | 2008-09-25 | Beatty Graydon E | Electrophysiology therapy catheter |
| US20050222515A1 (en) * | 2004-02-23 | 2005-10-06 | Biosignetics Corporation | Cardiovascular sound signature: method, process and format |
| US20070270703A1 (en) * | 2006-05-10 | 2007-11-22 | Regents Of The University Of Minnesota | Methods and apparatus of three dimensional cardiac electrophysiological imaging |
| US20080009758A1 (en) * | 2006-05-17 | 2008-01-10 | Voth Eric J | System and method for mapping electrophysiology information onto complex geometry |
| US20100274123A1 (en) * | 2006-05-17 | 2010-10-28 | Eric Jon Voth | System and method for mapping electrophysiology information onto complex geometry |
| US20080177192A1 (en) * | 2007-01-18 | 2008-07-24 | General Electric Company | Determination of cellular electrical potentials |
| US20100179421A1 (en) * | 2007-05-24 | 2010-07-15 | Joe Tupin | System and method for non-invasive instantaneous and continuous measurement of cardiac chamber volume. |
| US20120143030A1 (en) * | 2008-10-27 | 2012-06-07 | Rhythmia Medical, Inc. | Tracking system using field mapping |
Non-Patent Citations (6)
| Title |
|---|
| G. Fischer et al: "Computationally Efficient Noninvasive Cardiac Activation Time Imaging" Methods of Information in Medicine, Jan. 1, 2005 Schattauer GmbH, DE, vol. 44, pp. 674-686, XP002556296. |
| IEEEE Engineering in Medicine and Biology: "The Forward and Inverse Problems of Electrocardiography: Gaining a Better Qualitative and Quantitative Understanding of the Heart's Electrical Activity" Sep./Oct. 1998, pp. 85-122 XP000779560. |
| M. Sermesant et al: "A Fast-Marching Approach to Cardiac Electrophysiology Simulation for MXR Interventional Imaging" MICCAI 2005, LNCS 3750 pp. 507-615 2005 Springer-Verlag Berlin Heidelberg 2005 XP002601160. |
| Peter M. Van Dam et al: "Application of the fastest route algorithm in the interactive simulation of the effect of local ischemia on the ECG" Medical and Biologicl Engineering and Computing Jan. 1, 2009 Springer, Heildelberg, DE, vol. 47, pp. 11-20, XP002556298. |
| Peter M. Van Dam: "Non-Invasive Imaging of Cardiac Activation and Recovery" Annals of Biomedical Engineering, vol. 37, Sep. 2009 No. 9, pp. 1738-1756 XP002556297. |
| Van Dam: "Simulating ECG Changes During Acute Myocardial Ischemia," Computers in Technology, Jan. 1, 2007 IEEE Computer Society, US, FR, vol. 34t, pp. 325-328, XP002556299. |
Cited By (27)
| Publication number | Priority date | Publication date | Assignee | Title |
|---|---|---|---|---|
| US11224374B2 (en) | 2011-10-12 | 2022-01-18 | Cardioinsight Technologies, Inc. | Sensing zone for spatially relevant electrical information |
| US9549683B2 (en) * | 2011-10-12 | 2017-01-24 | Cardioinsight Technologies, Inc. | Sensing zone for spatially relevant electrical information |
| US11826148B2 (en) | 2011-10-12 | 2023-11-28 | Cardioinsight Technologies Inc. | Sensing zone for spatially relevant electrical information |
| US20130131529A1 (en) * | 2011-10-12 | 2013-05-23 | Cardioinsight Technologies, Inc. | Sensing zone for spatially relevant electrical information |
| EP3092943A1 (en) | 2015-05-13 | 2016-11-16 | EP Solutions SA | Systems, components, devices and methods for cardiac mapping using numerical reconstruction of cardiac action potentials |
| US10575746B2 (en) | 2017-12-14 | 2020-03-03 | Biosense Webster (Israel) Ltd. | Epicardial mapping |
| US11259871B2 (en) | 2018-04-26 | 2022-03-01 | Vektor Medical, Inc. | Identify ablation pattern for use in an ablation |
| US11564641B2 (en) | 2018-04-26 | 2023-01-31 | Vektor Medical, Inc. | Generating simulated anatomies of an electromagnetic source |
| US10860754B2 (en) | 2018-04-26 | 2020-12-08 | Vektor Medical, Inc. | Calibration of simulated cardiograms |
| US11253206B2 (en) | 2018-04-26 | 2022-02-22 | Vektor Medical, Inc. | Display of an electrical force generated by an electrical source within a body |
| US11259756B2 (en) | 2018-04-26 | 2022-03-01 | Vektor Medical, Inc. | Machine learning using clinical and simulated data |
| US11806080B2 (en) | 2018-04-26 | 2023-11-07 | Vektor Medical, Inc. | Identify ablation pattern for use in an ablation |
| US10856816B2 (en) | 2018-04-26 | 2020-12-08 | Vektor Medical, Inc. | Machine learning using simulated cardiograms |
| US11344263B2 (en) | 2018-04-26 | 2022-05-31 | Vektor Medical, Inc. | Bootstrapping a simulation-based electromagnetic output of a different anatomy |
| US11622732B2 (en) | 2018-04-26 | 2023-04-11 | Vektor Medical, Inc. | Identifying an attribute of an electromagnetic source configuration by matching simulated and patient data |
| US11504073B2 (en) | 2018-04-26 | 2022-11-22 | Vektor Medical, Inc. | Machine learning using clinical and simulated data |
| US11576624B2 (en) | 2018-04-26 | 2023-02-14 | Vektor Medical, Inc. | Generating approximations of cardiograms from different source configurations |
| US11547369B2 (en) | 2018-04-26 | 2023-01-10 | Vektor Medical, Inc. | Machine learning using clinical and simulated data |
| US10952794B2 (en) | 2018-11-13 | 2021-03-23 | Vektor Medical, Inc. | Augmentation of images with source locations |
| US11638546B2 (en) | 2019-06-10 | 2023-05-02 | Vektor Medical, Inc. | Heart graphic display system |
| US11490845B2 (en) | 2019-06-10 | 2022-11-08 | Vektor Medical, Inc. | Heart graphic display system |
| US10709347B1 (en) | 2019-06-10 | 2020-07-14 | Vektor Medical, Inc. | Heart graphic display system |
| US10617314B1 (en) | 2019-06-10 | 2020-04-14 | Vektor Medical, Inc. | Heart graphic display system |
| US11338131B1 (en) | 2021-05-05 | 2022-05-24 | Vektor Medical, Inc. | Guiding implantation of an energy delivery component in a body |
| US11896432B2 (en) | 2021-08-09 | 2024-02-13 | Vektor Medical, Inc. | Machine learning for identifying characteristics of a reentrant circuit |
| US11534224B1 (en) | 2021-12-02 | 2022-12-27 | Vektor Medical, Inc. | Interactive ablation workflow system |
| US11957471B2 (en) | 2023-03-20 | 2024-04-16 | Vektor Medical, Inc. | Heart graphic display system |
Also Published As
| Publication number | Publication date |
|---|---|
| CA2766478A1 (en) | 2010-12-29 |
| ZA201200286B (en) | 2013-06-26 |
| WO2010151130A1 (en) | 2010-12-29 |
| EP2266459A1 (en) | 2010-12-29 |
| AU2010263357A1 (en) | 2012-02-09 |
| EP2445398A1 (en) | 2012-05-02 |
| AU2010263357B2 (en) | 2015-09-24 |
| US20120157822A1 (en) | 2012-06-21 |
Similar Documents
| Publication | Publication Date | Title |
|---|---|---|
| US8838203B2 (en) | Inverse imaging of electrical activity of a heart muscle | |
| Van Dam et al. | Non-invasive imaging of cardiac activation and recovery | |
| US10582872B2 (en) | System and method for visualizing electrophysiology data | |
| Jamil-Copley et al. | Noninvasive electrocardiographic mapping to guide ablation of outflow tract ventricular arrhythmias | |
| US9474457B2 (en) | Metrics of electrical dyssynchrony and electrical activation patterns from surface ECG electrodes | |
| Wang et al. | Noninvasive epicardial and endocardial electrocardiographic imaging of scar-related ventricular tachycardia | |
| EP3338628A1 (en) | Computer-aided localization of site of origin of cardiac activation with discriminator leads | |
| Santilli et al. | Electrocardiography of the dog and cat.: Diagnosis of arrhythmias | |
| IL281311A (en) | Analyzing and mapping ecg signals and determining ablation points to eliminate brugada syndrome | |
| US10891728B2 (en) | Method and system for identifying an isthmus in a three-dimensional map | |
| Burgess et al. | Determination of transmural location of onset of activation from cardiac surface electrograms. | |
| Buttu | Novel ECG and intracardiac electrograms signal processing schemes for predicting the outcome of atrial fibrillation catheter ablation | |
| Széplaki et al. | Ablation of premature ventricular complexes originating from the left ventricular outflow tract using a novel automated pace-mapping software | |
| Deutsch | Noninvasive Localization of the Focus of Ectopic Ventricular Activation | |
| Ng et al. | Fundamentals of Cardiac Mapping | |
| Nunes | High-Density Mapping Analysis of Electrical Spatiotemporal Behaviour in Atrial Fibrillation | |
| van Dam | The shortest path to cardiac activation. | |
| Orini et al. | Validation of the V-index as a metric of ventricular repolarization dispersion using intracardiac recordings | |
| Solé Galindo | Ventricular Extrasystole Ablation: electrophysiological characterization according to its origin | |
| Seger et al. | ECG mapping and imaging of cardiac electrical function | |
| Pedrón-Torrecilla et al. | Accuracy of inverse solution computation of dominant frequencies and phases during atrial fibrillation | |
| Shannon et al. | Activation patterns during selective pacing of the left ventricle can be characterized using noninvasive electrocardiographic imaging | |
| Tanimoto et al. | How to map and ablate hemodynamically tolerated ventricular tachycardias | |
| Ehnesh | Spatiotemporal behaviour of AF drivers in patients with persistent atrial fibrillation using non-contacting intracardiac atrial electrograms | |
| Graham | Non-Invasive Electrocardiographic Mapping of Arrhythmia and Arrhythmogenic substrate in the Human Ventricle |
Legal Events
| Date | Code | Title | Description |
|---|---|---|---|
| AS | Assignment |
Owner name: CORTIUS HOLDING B.V., NETHERLANDS Free format text: ASSIGNMENT OF ASSIGNORS INTEREST;ASSIGNORS:VAN DAM, PETER MICHAEL;VAN OOSTEROM, ADRIAAN;SIGNING DATES FROM 20120220 TO 20120221;REEL/FRAME:027841/0068 |
|
| FEPP | Fee payment procedure |
Free format text: PAYOR NUMBER ASSIGNED (ORIGINAL EVENT CODE: ASPN); ENTITY STATUS OF PATENT OWNER: SMALL ENTITY |
|
| STCF | Information on status: patent grant |
Free format text: PATENTED CASE |
|
| MAFP | Maintenance fee payment |
Free format text: PAYMENT OF MAINTENANCE FEE, 4TH YR, SMALL ENTITY (ORIGINAL EVENT CODE: M2551) Year of fee payment: 4 |
|
| FEPP | Fee payment procedure |
Free format text: MAINTENANCE FEE REMINDER MAILED (ORIGINAL EVENT CODE: REM.); ENTITY STATUS OF PATENT OWNER: SMALL ENTITY |
|
| LAPS | Lapse for failure to pay maintenance fees |
Free format text: PATENT EXPIRED FOR FAILURE TO PAY MAINTENANCE FEES (ORIGINAL EVENT CODE: EXP.); ENTITY STATUS OF PATENT OWNER: SMALL ENTITY |
|
| STCH | Information on status: patent discontinuation |
Free format text: PATENT EXPIRED DUE TO NONPAYMENT OF MAINTENANCE FEES UNDER 37 CFR 1.362 |
|
| FP | Lapsed due to failure to pay maintenance fee |
Effective date: 20220916 |