US8856018B2 - Methods and systems for optimizing production forecasts using statistically prioritized discrete modeling methodology - Google Patents
Methods and systems for optimizing production forecasts using statistically prioritized discrete modeling methodology Download PDFInfo
- Publication number
- US8856018B2 US8856018B2 US12/210,291 US21029108A US8856018B2 US 8856018 B2 US8856018 B2 US 8856018B2 US 21029108 A US21029108 A US 21029108A US 8856018 B2 US8856018 B2 US 8856018B2
- Authority
- US
- United States
- Prior art keywords
- production
- jobs
- job
- data
- relationships
- Prior art date
- Legal status (The legal status is an assumption and is not a legal conclusion. Google has not performed a legal analysis and makes no representation as to the accuracy of the status listed.)
- Expired - Fee Related, expires
Links
Images


Classifications
-
- G—PHYSICS
- G06—COMPUTING; CALCULATING OR COUNTING
- G06Q—INFORMATION AND COMMUNICATION TECHNOLOGY [ICT] SPECIALLY ADAPTED FOR ADMINISTRATIVE, COMMERCIAL, FINANCIAL, MANAGERIAL OR SUPERVISORY PURPOSES; SYSTEMS OR METHODS SPECIALLY ADAPTED FOR ADMINISTRATIVE, COMMERCIAL, FINANCIAL, MANAGERIAL OR SUPERVISORY PURPOSES, NOT OTHERWISE PROVIDED FOR
- G06Q10/00—Administration; Management
- G06Q10/06—Resources, workflows, human or project management; Enterprise or organisation planning; Enterprise or organisation modelling
- G06Q10/063—Operations research, analysis or management
- G06Q10/0631—Resource planning, allocation, distributing or scheduling for enterprises or organisations
- G06Q10/06312—Adjustment or analysis of established resource schedule, e.g. resource or task levelling, or dynamic rescheduling
-
- G—PHYSICS
- G06—COMPUTING; CALCULATING OR COUNTING
- G06Q—INFORMATION AND COMMUNICATION TECHNOLOGY [ICT] SPECIALLY ADAPTED FOR ADMINISTRATIVE, COMMERCIAL, FINANCIAL, MANAGERIAL OR SUPERVISORY PURPOSES; SYSTEMS OR METHODS SPECIALLY ADAPTED FOR ADMINISTRATIVE, COMMERCIAL, FINANCIAL, MANAGERIAL OR SUPERVISORY PURPOSES, NOT OTHERWISE PROVIDED FOR
- G06Q10/00—Administration; Management
- G06Q10/06—Resources, workflows, human or project management; Enterprise or organisation planning; Enterprise or organisation modelling
- G06Q10/063—Operations research, analysis or management
- G06Q10/0631—Resource planning, allocation, distributing or scheduling for enterprises or organisations
- G06Q10/06311—Scheduling, planning or task assignment for a person or group
- G06Q10/063114—Status monitoring or status determination for a person or group
-
- G—PHYSICS
- G06—COMPUTING; CALCULATING OR COUNTING
- G06Q—INFORMATION AND COMMUNICATION TECHNOLOGY [ICT] SPECIALLY ADAPTED FOR ADMINISTRATIVE, COMMERCIAL, FINANCIAL, MANAGERIAL OR SUPERVISORY PURPOSES; SYSTEMS OR METHODS SPECIALLY ADAPTED FOR ADMINISTRATIVE, COMMERCIAL, FINANCIAL, MANAGERIAL OR SUPERVISORY PURPOSES, NOT OTHERWISE PROVIDED FOR
- G06Q10/00—Administration; Management
- G06Q10/06—Resources, workflows, human or project management; Enterprise or organisation planning; Enterprise or organisation modelling
- G06Q10/063—Operations research, analysis or management
- G06Q10/0631—Resource planning, allocation, distributing or scheduling for enterprises or organisations
- G06Q10/06311—Scheduling, planning or task assignment for a person or group
- G06Q10/063116—Schedule adjustment for a person or group
-
- G—PHYSICS
- G06—COMPUTING; CALCULATING OR COUNTING
- G06Q—INFORMATION AND COMMUNICATION TECHNOLOGY [ICT] SPECIALLY ADAPTED FOR ADMINISTRATIVE, COMMERCIAL, FINANCIAL, MANAGERIAL OR SUPERVISORY PURPOSES; SYSTEMS OR METHODS SPECIALLY ADAPTED FOR ADMINISTRATIVE, COMMERCIAL, FINANCIAL, MANAGERIAL OR SUPERVISORY PURPOSES, NOT OTHERWISE PROVIDED FOR
- G06Q10/00—Administration; Management
- G06Q10/06—Resources, workflows, human or project management; Enterprise or organisation planning; Enterprise or organisation modelling
- G06Q10/063—Operations research, analysis or management
- G06Q10/0639—Performance analysis of employees; Performance analysis of enterprise or organisation operations
- G06Q10/06395—Quality analysis or management
Definitions
- the field of the disclosure relates generally to production forecasting, and more specifically, to methods and systems for optimizing production forecasts using statistically prioritized discrete modeling methodology.
- a computer-based method for dynamic path regeneration in a production environment as a function of stochastic event-driven parameters and constraints includes examining existing status codes, for a plurality of remaining production jobs, to determine a current status for a production unit, applying at least one of predecessor relationships and successor relationships for the remaining production jobs to the existing status codes, analyzing historical job performance statistics for a number of previous production units based on production job performance data associated with the previous production units, and providing a user interface that depicts the remaining production jobs in order of criticality, the order of criticality determined based on the existing status codes, the at least one of predecessor relationships and successor relationships, and the analysis of the historical job performance statistics.
- a system in another aspect, includes at least one computer configured to execute a computer program that includes a simulation model and a database.
- the database contains data relating to active and historical production jobs including predecessor and successor relationships among the active production jobs, production job schedules, production job task durations, and production job task dependencies.
- the simulation model operates to cause the computer to examine the data relating to the active production jobs to determine a current status for at least one production unit, apply the predecessor and successor relationships to the active production jobs for the at least one production unit, analyze the data relating to historical production jobs for a number of previous production units, utilize the current status, the predecessor and successor relationships, and the historical production job data to determine which of the active production jobs are most critical to the overall completion date of the production unit, and present the determination to the user of the computer.
- FIG. 1 is a simplified block diagram of an exemplary server-client system.
- FIG. 2 is an expanded block diagram of a computer network.
- FIG. 3 is a flowchart that illustrates a method for dynamic critical path regeneration as a function of stochastic event-driven parameters and associated constraints.
- FIG. 4 is an overview of the elements involved in efficient data movement.
- FIG. 5 is a flowchart showing how an application uses web services to store data efficiently.
- FIG. 6 is a flowchart illustration of a procedure for refreshing of production related data.
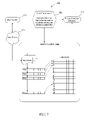
- FIG. 7 is a flowchart illustration of a procedure for inserting multiple rows of data into a database.
- FIG. 8 is a flowchart representing major elements of a production data movement scheme, a simulation method, and an associated algorithm.
- FIG. 9 is a diagram that illustrates the relationships between a data movement method, a status presentation method, and a simulation method.
- FIG. 10 is a computer screen copy relating to an online data querying method.
- FIG. 11 is a data flow diagram illustrating automatic collection of production data associated with one or more serial or line numbers.
- FIG. 12 is diagram providing an overview of a simulation model.
- FIGS. 13 and 14 are a workflow diagrams illustrating that jobs can be processed either in sequence, reverse order, and/or in parallel if the job predecessor and successor relationships are maintained.
- FIG. 15 is a diagram illustrating simulation results.
- FIG. 16 is a depiction of a web browser interface that shows a status of tasks/jobs associated with specific line/serial numbers.
- FIG. 17 is a depiction of a web browser interface that allows managers to view job status per given status type.
- FIG. 18 is a depiction of a web browser interface that allows a user to view the status of various jobs for a given line number.
- FIG. 19 is a second depiction of a web browser interface that allows a user to view the status of various jobs for a given line number.
- FIG. 20 is a depiction of a web browser interface that allows a user to view the details for a specific job upon selection of details for a specific job.
- FIG. 21 is a depiction of a web browser interface that allows a user to view the jobs for a given day as well as upcoming jobs.
- the described embodiments provide a mechanism for generating optimized production schedule forecasts that depict dynamic critical path re-configuration with solutions to meet near term floating deadlines.
- the floating deadlines are typically per given group of jobs, per given resource limits, per line or serial numbers, and among all active line or serial numbers in the final assembly area.
- the embodiments utilize an algorithm to analyze existing production data with considerations of both hard and flexible predecessor and/or successor relationships among all current jobs. Upon completion of the analysis, new priorities of jobs with new critical paths are dynamically presented using efficient data movement and job sequencing algorithms in a large scale production system.
- the embodiments enable people in the final stages of a push type dynamic production environment to have visibility of and quickly take action to statistically re-prioritize jobs based on re-configured critical paths. These re-configured critical paths being generated on the fly based on a current production scenario using the disclosed algorithm and methods in a discrete event simulation. While described in terms of an aircraft production environment, it should be understood that the embodiments described herein are not so limited, and are believed to be applicable to many production applications.
- FIG. 1 is a simplified block diagram of an exemplary system 10 including a server system 12 , and a plurality of client sub-systems, also referred to as client systems 14 , connected to server system 12 .
- Computerized modeling and grouping tools are stored in server 12 , and can be accessed by a requester at any one of computers 14 .
- client systems 14 are computers including a web browser, such that server system 12 is accessible to client systems 14 using the Internet.
- Client systems 14 are interconnected to the Internet, or alternatively to an Intranet, through many interfaces including a network, such as a local area network (LAN) or a wide area network (WAN), dial-in-connections, cable modems, and special high-speed ISDN lines.
- LAN local area network
- WAN wide area network
- dial-in-connections cable modems
- special high-speed ISDN lines special high-speed ISDN lines.
- Client systems 14 could be any device capable of interconnecting to the Internet including a web-based phone, personal digital assistant (PDA), or other web-based connectable equipment.
- a database server 16 is connected to a database 20 containing information on a variety of matters, as described below in greater detail.
- centralized database 20 is stored on server system 12 and can be accessed by potential users at one of client systems 14 by logging onto server system 12 through one of client systems 14 .
- database 20 is stored remotely from server system 12 and may be non-centralized.
- FIG. 2 is an expanded block diagram of an exemplary embodiment of a system 22 .
- System 22 is but one example of a suitable computing environment and is not intended to suggest any limitation as to the scope of use or functionality of the present disclosure. Neither should the system 22 be interpreted as having any dependency or requirement relating to any one or combination of components illustrated herein.
- Components in system 22 identical to components of system 10 (shown in FIG. 1 ), are identified in FIG. 2 using the same reference numerals as used in FIG. 1 .
- System 22 includes server system 12 and client systems 14 .
- Server system 12 further includes database server 16 , an application server 24 , a web server 26 , a fax server 28 , a directory server 30 , and a mail server 32 .
- a disk storage unit 34 (which includes database 20 ) is coupled to database server 16 and directory server 30 .
- Servers 16 , 24 , 26 , 28 , 30 , and 32 are coupled in a local area network (LAN) 36 .
- LAN local area network
- a system administrator's workstation 38 , a user workstation 40 , and a supervisor's workstation 42 are coupled to LAN 36 .
- workstations 38 , 40 , and 42 are coupled to LAN 36 using an Internet link or are connected through an Intranet.
- Each workstation, 38 , 40 , and 42 is a personal computer having a web browser. Although the functions performed at the workstations typically are illustrated as being performed at respective workstations 38 , 40 , and 42 , such functions can be performed at one of many personal computers coupled to LAN 36 . Workstations 38 , 40 , and 42 are illustrated as being associated with separate functions only to facilitate an understanding of the different types of functions that can be performed by individuals having access to LAN 36 .
- Server system 12 is configured to be communicatively coupled to various individuals, including employees 44 and to third parties, e.g., customers/contractors 46 using an internet service provider (ISP) Internet connection 48 .
- ISP internet service provider
- the communication in the exemplary embodiment is illustrated as being performed using the Internet, however, any other wide area network (WAN) type communication can be utilized in other embodiments, i.e., the systems and processes are not limited to being practiced using the Internet.
- WAN wide area network
- local area network 36 could be used in place of WAN 50 .
- any authorized individual having a workstation 54 can access system 22 .
- At least one of the client systems includes a manager workstation 56 located at a remote location.
- Workstations 54 and 56 are personal computers having a web browser.
- workstations 54 and 56 are configured to communicate with server system 12 .
- fax server 28 communicates with remotely located client systems, including a client system 56 using a telephone link. Fax server 28 is configured to communicate with other client systems 38 , 40 , and 42 as well.
- FIG. 3 is a flowchart 100 that illustrates a method for dynamic critical path regeneration as a function of stochastic event-driven parameters and associated constraints that might be run on the systems of FIGS. 1 and 2 .
- all existing job status codes are examined 102 , for example, by collecting all active and historical production jobs into a database with an automatic refreshing mechanism that dynamically updates the database to reflect the current production status.
- Predecessor and/or successor relationships are applied 104 , for example, the dynamically updated data in the database is dynamically accessible to a discrete event simulation model.
- Historical job performance statistics are used 106 , for example, from the previous 50 line or serial numbers to present results that depict which jobs are most critical, as further described below.
- the information is customized to each mechanic/electrician/supervisor without the convoluted traditional paper processes that are currently in place. More generally, customizing the user interface presented to the user based on their production job responsibilities.
- the user front end of the presented finding is independent from the time consuming processes associated with the described event simulation. Speed of the simulation is detached from the data presentation, at least in part due to the database and the production data movement scheme mentioned above with respect to the examination 12 mentioned above.
- the described embodiments transform the tedious, labor intensive, rule-of-thumb rough estimating/job shuffling of the past into an intelligent, rule based process which incorporates historical data and statistical analysis.
- the embodiments involve the use of algorithms to dynamically present which jobs are most critical to the overall completion date of a specific line or serial number, and accomplish this presentation task with more ease and speed than currently available methods.
- the modeling and algorithms are capable of forecasting consequences to the completion date of a specific production unit based on available resources and production job status codes in addition to identifying potential risks to the completion date of a specific production unit in the form of critical production jobs.
- the presentation of the results provides visibility to areas where opportunities for improvements exist in the production system.
- the ability of having a rule based approach to dynamically identify daily efficiency improvement opportunities is more beneficial than today's method of relying on prior knowledge to identify what are the current urgencies.
- FIG. 4 is an illustration that provides an overview of elements involved in efficient data movement.
- a data source element 150 indicates existing production data storage.
- data sources are accessed by users 152 using computers 154 .
- the data is accessed as either XML data 156 , or via manual input 158 into a web application user interface 160 .
- the computers 154 generally access the data source element 150 via an intranet 162 or other network system.
- data can be downloaded automatically from a process simulation database 172 based on a user defined schedule and/or a time interval.
- a web service 174 provides one method to download data from data sources 150 .
- a call to a database 176 that includes stored procedures is used to insert and update production related data.
- the web service 174 call and calls to database 176 are provided through application 178 .
- FIG. 5 is a flowchart 200 illustration showing how application 178 uses web services 174 are used as a method to store data efficiently. The method ensures that all existing production job data within the data sources 150 as well as newly revised data is stored systematically.
- application 178 causes stored procedure one 202 to execute, which is the preparation of a series of line/serial number candidates, and the providing of input parameters for the web services 174 .
- the series of candidates is processed 204 through a work flow loop of input parameters, and a second stored procedure 206 is executed for the insertion of new production data into rows 208 or the update of existing rows 208 of production data.
- FIG. 6 is a flowchart 220 that provides additional illustration of stored procedure one 202 and how to refresh the production related data without getting a whole new set of production related data every time there is an update.
- the maximum line/serial number is looked up 222 and incremented by one for a download candidate. If the new line is equal 224 to the maximum line number plus one, then jobs with an incomplete job status 228 are exclusively selected 226 as new download candidates and stored in the database as the series of line/serial number candidates 230 .
- FIG. 7 is a flowchart 240 that provides additional illustration of stored procedure two 208 and how to insert multiple rows of data into the database 172 . Specifically, only rows that have updated data are inserted into the database of existing data.
- FIGS. 3 through 7 present features including a web service, a SQL database, and a series of automated methods to gather data very efficiently and quickly.
- FIG. 8 is a flowchart 250 that represents major elements of a production data movement scheme and a simulation method and associated algorithm.
- the simulation method does not only process a routine set of tasks based on a given set of fixed flow diagrams it also searches for the shortest total time to process all jobs in the system.
- all active and historical production jobs are collected into a database with an automatic refreshing mechanism that dynamically updates the database to reflect the current production status.
- the simulation algorithm Via the simulation algorithm, the data is dynamically accessible to a discrete event simulation model.
- the algorithm is operable to determine the best next possible groups of jobs to start. For example if one mechanic has started five jobs while five other team members have done the same, then it is possible to have up to 25 jobs open in the system.
- the algorithm identifies which jobs among those 25 are the most important and need to be completed first. A new critical path will then be created on the fly to present higher priority jobs per mechanic per job category and/or per team.
- the most recent group of job status data is input 254 into the above mentioned algorithm.
- Statistics of individual jobs are determined 256 .
- the job status data is sequenced 258 to reflect a current status, and predecessor/successor constraints are considered 260 along with the determined 256 statistics to fulfill acquiring requirements 262 . If the predecessor/successor constraints are met 270 the production jobs are put 272 into a queue. If the predecessor/successor constraints are not met 270 , the next group of production jobs are processed 274 and the production job status is updated 276 and simulation results are output 278 . In addition, after the production jobs are processed 274 , they are processed 280 across different line/serial numbers.
- FIG. 9 is a diagram 300 that illustrates the relationships between the above described processes including the data movement method 302 , the status presentation method 304 , and the simulation method 306 , which are represented at a high level.
- information is customized to each mechanic/electrician/supervisor without the convoluted traditional paper processes that are currently in place.
- Another feature is that the user front end of the presented finding is independent from the data gathering and simulation processes. As a result, the speed of the simulation is detached from the data presentation, due to the production data movement scheme described above.
- the described embodiments elaborate the existing online data querying method through automation, as seen in the computer screen copy 300 of FIG. 10 . More specifically, a user is able to enter a line number or serial number associated with one or more production jobs and determine the status of jobs associated with the production of the entered line or serial number.
- production data 352 is gathered using a web service 354 , for example, and provided to a process simulation database 356 which includes a data download table.
- the production data is analyzed and candidates for update are determined and stored in a download candidates table 358 .
- Differentials 360 between in the production data are determined and stored in the process simulation database 362 in a data table. Users access the current status of production jobs via this data table.
- FIG. 12 shows an overview of the simulation model 400 described herein.
- the simulation model 400 reads from and writes to the model database 402 directly without slowing down the result presentation on the web page represented in FIG. 12 by user interfaces 404 and network diagram 406 .
- the simulation model 400 contains business logic and system attributes, evaluates input schedules, dependencies and resource availability, simulates functional testing, and includes an algorithm that evaluates system status to determine timing and sequencing of tasks.
- the model database 402 includes data and user interfaces relating to predecessor and successor relationships among the active production jobs, production job schedules, production job task durations, and production job task dependencies as well as user interfaces for the reporting of simulation model output.
- FIGS. 13 and 14 are workflow diagrams, 420 and 430 respectively, illustrating that the simulation method performed by the simulation model 400 can break loose of a pre-determined network diagram among jobs to process them either in sequence and/or in parallel given that the job predecessor and successor relationships are maintained.
- diagram 420 while Job A is generally scheduled to be completed before Job B, it is possible that they can be partially overlapped, or Job B may be completed before Job A. As such Job B is not dependent on the completion of Job A.
- FIG. 15 is a diagram 450 that illustrates several simulation results. Specifically, simulation results in showing utilization of key resources 452 such as quantifying which resources are busy at what times, queuing 454 including batch points and line/serial number completion, and a detailed output 456 in the form of spreadsheets and databases.
- key resources 452 such as quantifying which resources are busy at what times
- queuing 454 including batch points and line/serial number completion
- a detailed output 456 in the form of spreadsheets and databases.
- the above described figures describe a production job simulation mode that has the following features, including, but not limited to, an ability to analyze how precedence network is affected if certain production jobs are delayed, an ability to decide how labor should be re-allocated based on delayed job, an option to test various scenarios for placement of traveling jobs, a capability to add more job packages, and an ability to plan ahead when a delay is anticipated.
- the described system incorporates a unique job prioritization algorithm that considers planned rollout schedules, resource availability and job dependencies to recommend a sequence of tasks for each line/serial number being produced in a production facility.
- FIG. 16 is a depiction of a web browser interface 500 that shows which line/serial numbers 502 have how many tasks/jobs 504 that are behind schedule through incorporation of a status light renditions 506 .
- Status light renditions 506 may be presented in multiple colors. For example and in one embodiment, a status light rendition colored green indicates no tasks are behind schedule, a status light rendition colored yellow indicates several tasks are behind schedule, and a status light rendition colored red indicates too many tasks are behind schedule.
- a user is able to select a link 508 to access additional details for a specific line/serial number.
- FIG. 17 is a depiction of a web browser interface 520 that allows managers to view job status per given status type and is sometimes referred to as a manager dashboard. Included in interface 520 are a line serial number 522 , a job number 524 , a task description 526 , a status 528 , an end date 530 , a responsible engineer 532 , dependencies 534 and a user is able to select a link 538 to access additional details for a specific line/serial number.
- FIG. 18 is a depiction of a web browser interface 540 that allows a user to view the status of various jobs for a given line number 542 . Included in interface 540 are a job number 544 , a task description 546 , a status 548 , a start date 550 , an end date 552 , a responsible engineer 554 , and a user is able to select a link 556 to access additional details for a specific job number 544 associated with the given line/serial number 542 .
- FIG. 19 is a second depiction of a web browser interface 558 that allows a user to view the status of various jobs for a given line number 542 . While interface 540 only includes outstanding jobs for the selected line number 542 , interface 558 also includes a listing of the jobs that have been completed for the selected line number.
- FIG. 20 is a depiction of a web browser interface 560 that allows a user to view the details for a specific job upon selection of the details for a specific job as described with respect to FIG. 18 .
- browser interface 560 includes an impact analysis 562 that includes a start date, and end date, a number of days behind for the selected job, any dependencies for the job, the tasks that are delayed by the incompletion of the job, an impact on final delivery, a scheduled delivery date and a projected delivery date.
- Predecessor tasks 564 and dependent tasks 566 for the selected job are also shown in interface 560 .
- a job description panel 568 data associated with the selected job is presented, including the job number for the selected job, a name of the selected job, a start date for the job, an end date for the job, an engineer responsible for the job, an analyst associated with the job, a telephone number (?), during which shift the job is performed, the labor hours associated with the job, and a status for the job.
- FIG. 21 is a depiction of a web browser interface 600 that allows a user to the jobs for a given day 602 and upcoming jobs 604 and is sometimes referred to as an engineer dashboard.
- the data provided includes a sequence number 610 , a line/serial number 612 , a job number 614 , a task description 616 , a priority 618 , a status 620 , a start date 622 , an end date 624 , and a link 626 to access additional details for the specific job.
Abstract
Description
Claims (15)
Priority Applications (1)
| Application Number | Priority Date | Filing Date | Title |
|---|---|---|---|
| US12/210,291 US8856018B2 (en) | 2008-09-15 | 2008-09-15 | Methods and systems for optimizing production forecasts using statistically prioritized discrete modeling methodology |
Applications Claiming Priority (1)
| Application Number | Priority Date | Filing Date | Title |
|---|---|---|---|
| US12/210,291 US8856018B2 (en) | 2008-09-15 | 2008-09-15 | Methods and systems for optimizing production forecasts using statistically prioritized discrete modeling methodology |
Publications (2)
| Publication Number | Publication Date |
|---|---|
| US20100070315A1 US20100070315A1 (en) | 2010-03-18 |
| US8856018B2 true US8856018B2 (en) | 2014-10-07 |
Family
ID=42008026
Family Applications (1)
| Application Number | Title | Priority Date | Filing Date |
|---|---|---|---|
| US12/210,291 Expired - Fee Related US8856018B2 (en) | 2008-09-15 | 2008-09-15 | Methods and systems for optimizing production forecasts using statistically prioritized discrete modeling methodology |
Country Status (1)
| Country | Link |
|---|---|
| US (1) | US8856018B2 (en) |
Cited By (1)
| Publication number | Priority date | Publication date | Assignee | Title |
|---|---|---|---|---|
| US11327877B2 (en) | 2020-05-08 | 2022-05-10 | Microsoft Technology Licensing, Llc | Pipeline performance improvement using stochastic dags |
Families Citing this family (27)
| Publication number | Priority date | Publication date | Assignee | Title |
|---|---|---|---|---|
| US20080294492A1 (en) * | 2007-05-24 | 2008-11-27 | Irina Simpson | Proactively determining potential evidence issues for custodial systems in active litigation |
| US8572043B2 (en) | 2007-12-20 | 2013-10-29 | International Business Machines Corporation | Method and system for storage of unstructured data for electronic discovery in external data stores |
| US8112406B2 (en) | 2007-12-21 | 2012-02-07 | International Business Machines Corporation | Method and apparatus for electronic data discovery |
| US8140494B2 (en) | 2008-01-21 | 2012-03-20 | International Business Machines Corporation | Providing collection transparency information to an end user to achieve a guaranteed quality document search and production in electronic data discovery |
| US8275720B2 (en) | 2008-06-12 | 2012-09-25 | International Business Machines Corporation | External scoping sources to determine affected people, systems, and classes of information in legal matters |
| US9830563B2 (en) | 2008-06-27 | 2017-11-28 | International Business Machines Corporation | System and method for managing legal obligations for data |
| US8484069B2 (en) | 2008-06-30 | 2013-07-09 | International Business Machines Corporation | Forecasting discovery costs based on complex and incomplete facts |
| US8489439B2 (en) | 2008-06-30 | 2013-07-16 | International Business Machines Corporation | Forecasting discovery costs based on complex and incomplete facts |
| US8515924B2 (en) | 2008-06-30 | 2013-08-20 | International Business Machines Corporation | Method and apparatus for handling edge-cases of event-driven disposition |
| US8073729B2 (en) * | 2008-09-30 | 2011-12-06 | International Business Machines Corporation | Forecasting discovery costs based on interpolation of historic event patterns |
| US8327384B2 (en) | 2008-06-30 | 2012-12-04 | International Business Machines Corporation | Event driven disposition |
| US8204869B2 (en) * | 2008-09-30 | 2012-06-19 | International Business Machines Corporation | Method and apparatus to define and justify policy requirements using a legal reference library |
| US20110040600A1 (en) * | 2009-08-17 | 2011-02-17 | Deidre Paknad | E-discovery decision support |
| US8655856B2 (en) | 2009-12-22 | 2014-02-18 | International Business Machines Corporation | Method and apparatus for policy distribution |
| US8250041B2 (en) | 2009-12-22 | 2012-08-21 | International Business Machines Corporation | Method and apparatus for propagation of file plans from enterprise retention management applications to records management systems |
| US8832148B2 (en) | 2010-06-29 | 2014-09-09 | International Business Machines Corporation | Enterprise evidence repository |
| US8566903B2 (en) | 2010-06-29 | 2013-10-22 | International Business Machines Corporation | Enterprise evidence repository providing access control to collected artifacts |
| US8402359B1 (en) | 2010-06-30 | 2013-03-19 | International Business Machines Corporation | Method and apparatus for managing recent activity navigation in web applications |
| US10032136B1 (en) * | 2012-07-30 | 2018-07-24 | Verint Americas Inc. | System and method of scheduling work within a workflow with defined process goals |
| US9606530B2 (en) | 2013-05-17 | 2017-03-28 | International Business Machines Corporation | Decision support system for order prioritization |
| US20140350985A1 (en) * | 2013-05-24 | 2014-11-27 | Construx Solutions Advisory Group Llc | Systems, methods, and computer programs for providing integrated critical path method schedule management & data analytics |
| CN103294800B (en) | 2013-05-27 | 2016-12-28 | 华为技术有限公司 | A kind of information-pushing method and device |
| US9684581B2 (en) * | 2014-05-21 | 2017-06-20 | Nvidia Corporation | Determining overall performance characteristics of a concurrent software application |
| CN105808619B (en) * | 2014-12-31 | 2019-08-06 | 华为技术有限公司 | Method, impact analysis computing device and the key reset apparatus that task based on impact analysis is reformed |
| US11093878B2 (en) * | 2015-07-01 | 2021-08-17 | Oracle International Corporation | System and method for providing temporal dependencies between tasks |
| CN113359648B (en) * | 2021-07-01 | 2022-12-09 | 哈尔滨理工大学 | Comprehensive scheduling method for virtual adjustment duration on same equipment |
| CN113848845B (en) * | 2021-11-26 | 2022-04-15 | 佛山华数机器人有限公司 | Multi-robot polishing scheduling method |
Citations (28)
| Publication number | Priority date | Publication date | Assignee | Title |
|---|---|---|---|---|
| US4852001A (en) | 1986-07-25 | 1989-07-25 | Hitachi, Ltd. | Job scheduling method and system |
| US4896269A (en) | 1988-02-29 | 1990-01-23 | General Electric Company | Job shop scheduling and production method and apparatus |
| US4956784A (en) | 1988-12-14 | 1990-09-11 | Siemens Coporate Research, Inc. | Apparatus and a method for controlling the release of jobs from a pool of pending jobs into a factory |
| US5487144A (en) * | 1992-12-01 | 1996-01-23 | Yokogawa Electric Corporation | Scheduling system |
| US5524077A (en) | 1987-07-24 | 1996-06-04 | Faaland; Bruce H. | Scheduling method and system |
| US5548506A (en) * | 1994-03-17 | 1996-08-20 | Srinivasan; Seshan R. | Automated, electronic network based, project management server system, for managing multiple work-groups |
| US5559710A (en) | 1993-02-05 | 1996-09-24 | Siemens Corporate Research, Inc. | Apparatus for control and evaluation of pending jobs in a factory |
| US5918226A (en) * | 1995-01-11 | 1999-06-29 | Nec Corporation | Workflow system for operating and managing jobs with predicting future progress of workflow job |
| US6473721B1 (en) | 1998-10-26 | 2002-10-29 | Sony Corporation | Factory traffic monitoring and analysis apparatus and method |
| US6546364B1 (en) * | 1998-12-18 | 2003-04-08 | Impresse Corporation | Method and apparatus for creating adaptive workflows |
| US6571391B1 (en) | 1998-07-09 | 2003-05-27 | Lucent Technologies Inc. | System and method for scheduling on-demand broadcasts for heterogeneous workloads |
| US6571215B1 (en) * | 1997-01-21 | 2003-05-27 | Microsoft Corporation | System and method for generating a schedule based on resource assignments |
| US20030216951A1 (en) * | 2002-05-02 | 2003-11-20 | Roman Ginis | Automating resource management for distributed business processes |
| US20050022187A1 (en) * | 2003-07-23 | 2005-01-27 | Lg Electronics Inc. | EDF scheduling method |
| US20050108074A1 (en) * | 2003-11-14 | 2005-05-19 | Bloechl Peter E. | Method and system for prioritization of task items |
| US20060037018A1 (en) | 2004-08-16 | 2006-02-16 | Dell Products L.P. | System, method and software providing an adaptive job dispatch algorithm for large distributed jobs |
| US7117162B1 (en) * | 1997-09-11 | 2006-10-03 | Bellsouth Intellectual Property Corp. | System and Method for Facilitating Managing a Job |
| US20060288346A1 (en) * | 2005-06-16 | 2006-12-21 | Santos Cipriano A | Job scheduling system and method |
| US20070067196A1 (en) * | 2004-09-13 | 2007-03-22 | Hirokazu Usui | Project management system |
| US7233405B2 (en) | 2002-10-30 | 2007-06-19 | Palo Alto Research Center, Incorporated | Planning and scheduling reconfigurable systems with regular and diagnostic jobs |
| US20070143758A1 (en) | 2005-12-15 | 2007-06-21 | International Business Machines Corporation | Facilitating scheduling of jobs by decoupling job scheduling algorithm from recorded resource usage and allowing independent manipulation of recorded resource usage space |
| US20070185754A1 (en) * | 2006-02-07 | 2007-08-09 | Sap Ag | Task responsibility system |
| US7289966B2 (en) | 2001-08-14 | 2007-10-30 | Norman Ken Ouchi | Method and system for adapting the execution of a workflow route |
| US7299244B2 (en) | 2002-12-10 | 2007-11-20 | Hewlett-Packard Development Company, L.P. | System and method for dynamic sequencing of a requirements-based workflow |
| US20080052139A1 (en) * | 2006-08-23 | 2008-02-28 | Long Thomas C | Event driven diagramming method for project planning |
| US20080059967A1 (en) * | 2006-08-31 | 2008-03-06 | Yoshiro Matsui | Workflow management system, workflow management method, workflow management program, and recording medium |
| US20080313024A1 (en) * | 2006-08-31 | 2008-12-18 | Kunichika Yohei | Workflow management system and workflow management method |
| US7506302B2 (en) * | 2002-10-22 | 2009-03-17 | The Boeing Company | System and methods for business process modeling |
-
2008
- 2008-09-15 US US12/210,291 patent/US8856018B2/en not_active Expired - Fee Related
Patent Citations (29)
| Publication number | Priority date | Publication date | Assignee | Title |
|---|---|---|---|---|
| US4852001A (en) | 1986-07-25 | 1989-07-25 | Hitachi, Ltd. | Job scheduling method and system |
| US5524077A (en) | 1987-07-24 | 1996-06-04 | Faaland; Bruce H. | Scheduling method and system |
| US4896269A (en) | 1988-02-29 | 1990-01-23 | General Electric Company | Job shop scheduling and production method and apparatus |
| US4956784A (en) | 1988-12-14 | 1990-09-11 | Siemens Coporate Research, Inc. | Apparatus and a method for controlling the release of jobs from a pool of pending jobs into a factory |
| US5487144A (en) * | 1992-12-01 | 1996-01-23 | Yokogawa Electric Corporation | Scheduling system |
| US5559710A (en) | 1993-02-05 | 1996-09-24 | Siemens Corporate Research, Inc. | Apparatus for control and evaluation of pending jobs in a factory |
| US5721686A (en) | 1993-02-05 | 1998-02-24 | Siemens Corporate Research, Inc. | Method and apparatus for control and evaluation of pending jobs in a factory |
| US5548506A (en) * | 1994-03-17 | 1996-08-20 | Srinivasan; Seshan R. | Automated, electronic network based, project management server system, for managing multiple work-groups |
| US5918226A (en) * | 1995-01-11 | 1999-06-29 | Nec Corporation | Workflow system for operating and managing jobs with predicting future progress of workflow job |
| US6571215B1 (en) * | 1997-01-21 | 2003-05-27 | Microsoft Corporation | System and method for generating a schedule based on resource assignments |
| US7117162B1 (en) * | 1997-09-11 | 2006-10-03 | Bellsouth Intellectual Property Corp. | System and Method for Facilitating Managing a Job |
| US6571391B1 (en) | 1998-07-09 | 2003-05-27 | Lucent Technologies Inc. | System and method for scheduling on-demand broadcasts for heterogeneous workloads |
| US6473721B1 (en) | 1998-10-26 | 2002-10-29 | Sony Corporation | Factory traffic monitoring and analysis apparatus and method |
| US6546364B1 (en) * | 1998-12-18 | 2003-04-08 | Impresse Corporation | Method and apparatus for creating adaptive workflows |
| US7289966B2 (en) | 2001-08-14 | 2007-10-30 | Norman Ken Ouchi | Method and system for adapting the execution of a workflow route |
| US20030216951A1 (en) * | 2002-05-02 | 2003-11-20 | Roman Ginis | Automating resource management for distributed business processes |
| US7506302B2 (en) * | 2002-10-22 | 2009-03-17 | The Boeing Company | System and methods for business process modeling |
| US7233405B2 (en) | 2002-10-30 | 2007-06-19 | Palo Alto Research Center, Incorporated | Planning and scheduling reconfigurable systems with regular and diagnostic jobs |
| US7299244B2 (en) | 2002-12-10 | 2007-11-20 | Hewlett-Packard Development Company, L.P. | System and method for dynamic sequencing of a requirements-based workflow |
| US20050022187A1 (en) * | 2003-07-23 | 2005-01-27 | Lg Electronics Inc. | EDF scheduling method |
| US20050108074A1 (en) * | 2003-11-14 | 2005-05-19 | Bloechl Peter E. | Method and system for prioritization of task items |
| US20060037018A1 (en) | 2004-08-16 | 2006-02-16 | Dell Products L.P. | System, method and software providing an adaptive job dispatch algorithm for large distributed jobs |
| US20070067196A1 (en) * | 2004-09-13 | 2007-03-22 | Hirokazu Usui | Project management system |
| US20060288346A1 (en) * | 2005-06-16 | 2006-12-21 | Santos Cipriano A | Job scheduling system and method |
| US20070143758A1 (en) | 2005-12-15 | 2007-06-21 | International Business Machines Corporation | Facilitating scheduling of jobs by decoupling job scheduling algorithm from recorded resource usage and allowing independent manipulation of recorded resource usage space |
| US20070185754A1 (en) * | 2006-02-07 | 2007-08-09 | Sap Ag | Task responsibility system |
| US20080052139A1 (en) * | 2006-08-23 | 2008-02-28 | Long Thomas C | Event driven diagramming method for project planning |
| US20080059967A1 (en) * | 2006-08-31 | 2008-03-06 | Yoshiro Matsui | Workflow management system, workflow management method, workflow management program, and recording medium |
| US20080313024A1 (en) * | 2006-08-31 | 2008-12-18 | Kunichika Yohei | Workflow management system and workflow management method |
Non-Patent Citations (4)
| Title |
|---|
| Eden, "The Role of Feedback Dynamics in Disruption and Delay on the Nature of Disruption and Delay (D&D) in Major Projects," 2000, The Journal of the Operational Research Society, vol. 51, No. 3, pp. 291-300. * |
| Lu et al, Manufacturing Process Modeling of Boeing 747 Moving Line Concepts, 2002, Proc. of the 2002 Winter Simulation Conference, pp. 1041-1045. * |
| Morris, "The Wiley Guide to Managing Projects," 2004, John Wiley & Sons, pp. 20-22. * |
| Wang, "Applying cluster identification algorithm and simulation to generate probabilistic network schedules for design projects," 2005, Construction Management and Economics, vol. 23, pp. 199-213. * |
Cited By (1)
| Publication number | Priority date | Publication date | Assignee | Title |
|---|---|---|---|---|
| US11327877B2 (en) | 2020-05-08 | 2022-05-10 | Microsoft Technology Licensing, Llc | Pipeline performance improvement using stochastic dags |
Also Published As
| Publication number | Publication date |
|---|---|
| US20100070315A1 (en) | 2010-03-18 |
Similar Documents
| Publication | Publication Date | Title |
|---|---|---|
| US8856018B2 (en) | Methods and systems for optimizing production forecasts using statistically prioritized discrete modeling methodology | |
| Bass et al. | Architecture-based development | |
| US7502747B1 (en) | Automated job scheduling based on resource availability | |
| US8099312B2 (en) | Project management system and method | |
| US7802204B2 (en) | Data visualization for service requests | |
| US6832201B1 (en) | Method and system for optimizing request shipping in workflow management systems | |
| Shpilevoy et al. | Multi-agent system “Smart Factory” for real-time workshop management in aircraft jet engines production | |
| US20060184401A1 (en) | System and method for resource and cost planning of an IT migration | |
| EP2600293A1 (en) | Simulation and visulization for project planning and management | |
| US20100257015A1 (en) | Graphical client interface resource and work management scheduler | |
| US20210174274A1 (en) | Systems and methods for modeling organizational entities | |
| US20160140473A1 (en) | Creating and displaying a work sequence | |
| KR20070113168A (en) | System construction guide system | |
| CN111967766B (en) | Serial task dispatching method and device based on performance index | |
| EP3502872A1 (en) | Pipeline task verification for a data processing platform | |
| Gil et al. | External change in large engineering design projects: the role of the client | |
| US20140310040A1 (en) | Using crowdsourcing for problem determination | |
| US20150134312A1 (en) | Evaluation of Service Delivery Models | |
| KR100751671B1 (en) | Method for management of work-flow finance | |
| US20060167832A1 (en) | System management technique to surface the most critical problems first | |
| WO2020106696A1 (en) | Scheduling tests in a laboratory environment | |
| Meixell et al. | Activity structures in a project-based environment: A coordination theory perspective | |
| Nafkha | The pert method in estimating project duration | |
| Reijers | Case prediction in BPM systems: a research challenge | |
| Isaac et al. | Development of a Model Architecture for Job Scheduling |
Legal Events
| Date | Code | Title | Description |
|---|---|---|---|
| AS | Assignment |
Owner name: THE BOEING COMPANY,ILLINOIS Free format text: ASSIGNMENT OF ASSIGNORS INTEREST;ASSIGNORS:LU, ROBERTO F.;SUNDARAM, SHANKAR;WEI, TSAO-FENG;REEL/FRAME:021528/0262 Effective date: 20080912 Owner name: THE BOEING COMPANY, ILLINOIS Free format text: ASSIGNMENT OF ASSIGNORS INTEREST;ASSIGNORS:LU, ROBERTO F.;SUNDARAM, SHANKAR;WEI, TSAO-FENG;REEL/FRAME:021528/0262 Effective date: 20080912 |
|
| FEPP | Fee payment procedure |
Free format text: PAYOR NUMBER ASSIGNED (ORIGINAL EVENT CODE: ASPN); ENTITY STATUS OF PATENT OWNER: LARGE ENTITY |
|
| STCF | Information on status: patent grant |
Free format text: PATENTED CASE |
|
| MAFP | Maintenance fee payment |
Free format text: PAYMENT OF MAINTENANCE FEE, 4TH YEAR, LARGE ENTITY (ORIGINAL EVENT CODE: M1551) Year of fee payment: 4 |
|
| FEPP | Fee payment procedure |
Free format text: MAINTENANCE FEE REMINDER MAILED (ORIGINAL EVENT CODE: REM.); ENTITY STATUS OF PATENT OWNER: LARGE ENTITY |
|
| LAPS | Lapse for failure to pay maintenance fees |
Free format text: PATENT EXPIRED FOR FAILURE TO PAY MAINTENANCE FEES (ORIGINAL EVENT CODE: EXP.); ENTITY STATUS OF PATENT OWNER: LARGE ENTITY |
|
| STCH | Information on status: patent discontinuation |
Free format text: PATENT EXPIRED DUE TO NONPAYMENT OF MAINTENANCE FEES UNDER 37 CFR 1.362 |
|
| FP | Lapsed due to failure to pay maintenance fee |
Effective date: 20221007 |