US8902249B1 - Measurement and testing system - Google Patents
Measurement and testing system Download PDFInfo
- Publication number
- US8902249B1 US8902249B1 US14/042,332 US201314042332A US8902249B1 US 8902249 B1 US8902249 B1 US 8902249B1 US 201314042332 A US201314042332 A US 201314042332A US 8902249 B1 US8902249 B1 US 8902249B1
- Authority
- US
- United States
- Prior art keywords
- measurement
- measurement assembly
- processing device
- data acquisition
- test
- Prior art date
- Legal status (The legal status is an assumption and is not a legal conclusion. Google has not performed a legal analysis and makes no representation as to the accuracy of the status listed.)
- Active
Links
Images


Classifications
-
- G—PHYSICS
- G01—MEASURING; TESTING
- G01D—MEASURING NOT SPECIALLY ADAPTED FOR A SPECIFIC VARIABLE; ARRANGEMENTS FOR MEASURING TWO OR MORE VARIABLES NOT COVERED IN A SINGLE OTHER SUBCLASS; TARIFF METERING APPARATUS; MEASURING OR TESTING NOT OTHERWISE PROVIDED FOR
- G01D7/00—Indicating measured values
-
- G—PHYSICS
- G06—COMPUTING; CALCULATING OR COUNTING
- G06F—ELECTRIC DIGITAL DATA PROCESSING
- G06F3/00—Input arrangements for transferring data to be processed into a form capable of being handled by the computer; Output arrangements for transferring data from processing unit to output unit, e.g. interface arrangements
- G06F3/01—Input arrangements or combined input and output arrangements for interaction between user and computer
- G06F3/048—Interaction techniques based on graphical user interfaces [GUI]
- G06F3/0481—Interaction techniques based on graphical user interfaces [GUI] based on specific properties of the displayed interaction object or a metaphor-based environment, e.g. interaction with desktop elements like windows or icons, or assisted by a cursor's changing behaviour or appearance
- G06F3/0482—Interaction with lists of selectable items, e.g. menus
-
- G—PHYSICS
- G06—COMPUTING; CALCULATING OR COUNTING
- G06T—IMAGE DATA PROCESSING OR GENERATION, IN GENERAL
- G06T11/00—2D [Two Dimensional] image generation
- G06T11/20—Drawing from basic elements, e.g. lines or circles
- G06T11/206—Drawing of charts or graphs
Definitions
- the invention generally relates to a measurement and testing system. More particularly, the invention relates to a measurement and testing system that includes a measurement assembly, at least one visual display device, and a specially programmed data acquisition and processing device.
- Measurement and testing systems are utilized in various fields to detect and analyze many different measurable quantities. For example, in biomedical applications, measurement and testing systems are used for gait analysis, assessing balance and mobility, evaluating sports performance, and assessing ergonomics. However, conventional measurement and testing systems have numerous limitations and drawbacks.
- the data collected by a typical measurement and testing system is frequently not arranged in an organized and easily accessible manner. For example, data collected on various dates is often only accessible by viewing the individual data records. This individual arrangement of the data makes it very difficult for the user of the system to quickly analyze data that was acquired over a substantial time period and on different dates. The analysis of such data becomes increasingly more difficult when the quantity of the previously acquired data increases.
- some measurement systems are designed to utilize a plurality of different measurement assemblies, and execute a plurality of different tests.
- some of the tests employed by these measurement systems cannot be properly executed by one or more of the measurement assemblies that can be connected to the measurement system.
- a user attempts to run one of these tests using an incompatible measurement assembly, he or she will most likely either acquire inaccurate data from the measurement assembly or be unable to execute the test at all.
- a measurement and testing system including a data acquisition and processing device that employs inventive filtering techniques in order to create a single, easily understandable report from data acquired on a plurality of different dates, thereby facilitating the analysis of the data by a user of the system.
- a measurement and testing system that includes a data acquisition and processing device which is specially programmed to automatically regulate the availability of tests in accordance with the type of measurement assembly or assemblies that is being utilized in the measurement system by filtering the tests that cannot be executed properly on a particular measurement assembly or assemblies.
- the present invention is directed to a measurement and testing system that substantially obviates one or more problems resulting from the limitations and deficiencies of the related art.
- a measurement and testing system that includes: a measurement assembly having at least one measurement device, the at least one measurement device configured to sense one or more measured quantities and output one or more signals that are representative of the one or more measured quantities; at least one visual display device having an output screen, the visual display device configured to display measurement and testing data on the output screen so that it is viewable by a user of the system; and a data acquisition and processing device operatively coupled to the at least one measurement device of the measurement assembly and the visual display device, the data acquisition and processing device configured to receive the one or more signals that are representative of the one or more measured quantities and to convert the one or more signals into output data, wherein the output data is arranged in a plurality of sessions, output data acquired during the performance of a successive series of tests being arranged in a single session of the plurality of sessions, the data acquisition and processing device further configured to generate one or more global reports utilizing the output data acquired during one or more of the plurality of sessions, generate an information icon on the
- each of the one or more global reports is associated with one or more particular test types and, prior to generating the one or more global reports, the data acquisition and processing device is further configured to determine whether output data exists for the one or more particular test types, and only generate the one or more global reports when it is determined that the output data exists for the one or more particular test types.
- the data acquisition and processing device prior to generating the one or more global reports, is further configured to determine whether a predetermined condition is satisfied, and only generate the one or more global reports when it is determined that the predetermined condition is satisfied.
- the one or more global reports generated by the data acquisition and processing device comprise a plurality of global reports, and wherein the data acquisition and processing device is further configured to generate a drop-down menu for the information icon, the drop-down menu including a listing of the plurality of global reports.
- the plurality of global reports in the drop-down menu are vertically spaced apart from one another.
- the data acquisition and processing device is further configured to automatically alert a user of the system when one or more test results displayed in the one or more global reports are outside a predetermined range, below a normal value, or above a baseline value by generating a first visual indicator on the output screen of the visual display device.
- the data acquisition and processing device is further configured to automatically alert the user of the system when one or more test results displayed in the one or more global reports are within a predetermined range, above a normal value, or below a baseline value by generating a second visual indicator on the output screen of the visual display device, the second visual indicator being distinct from the first visual indicator.
- the data acquisition and processing device is further configured to: (i) assemble a list of tests that are capable of being performed utilizing the measurement assembly; (ii) determine, for each of the tests in the list, whether the execution of each particular test in the list requires the use of a specific measurement assembly and/or requires that a predetermined condition be satisfied; (iii) when it is determined that the execution of the particular test in the list requires the use of a specific measurement assembly and/or requires that a predetermined condition be satisfied, determine whether the measurement assembly comprises the specific measurement assembly that is required and/or whether the predetermined condition has been satisfied; and (iv) when it is determined that the measurement assembly is the specific measurement assembly that is required and/or the predetermined condition has been satisfied, add the test name or icon for the particular test to a listing of available test names or icons that are displayed on the at least one visual display device so that a system user is able to select the particular test.
- the one or more global reports comprise at least one global report including output data acquired during at least two of the plurality of sessions, the first of the at least two of the plurality of sessions being performed on a first date, the second of the at least two of the plurality of sessions being performed on a second date, the first date being different from the second date.
- a measurement and testing system that includes: at least one measurement assembly, the at least one measurement assembly configured to output one or more signals; at least one visual display device having an output screen; and a data acquisition and processing device operatively coupled to the at least one measurement assembly and the at least one visual display device, the data acquisition and processing device being configured to: (i) assemble a list of tests that are capable of being performed utilizing the at least one measurement assembly; (ii) determine, for each of the tests in the list, whether the execution of each particular test in the list requires the use of a specific measurement assembly and/or requires that a predetermined condition be satisfied; (iii) when it is determined that the execution of the particular test in the list requires the use of a specific measurement assembly and/or requires that a predetermined condition be satisfied, determine whether the at least one measurement assembly comprises the specific measurement assembly that is required and/or whether the predetermined condition has been satisfied; and (iv) when it is determined that the at least one measurement assembly is the
- the one or more signals outputted by the at least one measurement assembly contain a unique identifier for the at least one measurement assembly; and wherein, when determining whether the at least one measurement assembly comprises the specific measurement assembly that is required, the data acquisition and processing device is further configured to determine whether the unique identifier for the at least one measurement assembly matches a device identifier in a list of one or more device identifiers for the particular test.
- the data acquisition and processing device when a new measurement assembly is connected to the data acquisition and processing device, the data acquisition and processing device is further configured to initially determine whether the new measurement assembly has provided identifying information that enables the data acquisition and processing device to identify the new measurement assembly as a known measurement assembly type, and when identifying information has not been provided that permits the new measurement assembly to be identified as a known measurement assembly type, the data acquisition and processing device is additionally configured to prompt the system user to select a measurement assembly type for the new measurement assembly.
- the data acquisition and processing device is further configured to receive the one or more signals and to convert the one or more signals into output data, wherein the output data is arranged in a plurality of sessions, output data acquired during the performance of a successive series of tests being arranged in a single session of the plurality of sessions, the data acquisition and processing device additionally configured to generate one or more global reports utilizing the output data acquired during one or more of the plurality of sessions, generate an information icon on the output screen of the visual display device, and assign the one or more global reports to the information icon.
- a measurement and testing system that includes: a first measurement assembly having at least one first measurement device, the at least one first measurement device configured to sense one or more first measured quantities and output one or more first signals that are representative of the one or more first measured quantities; a second measurement assembly having at least one second measurement device, the at least one second measurement device configured to sense one or more second measured quantities and output one or more second signals that are representative of the one or more second measured quantities; a data acquisition and processing device operatively coupled to the at least one first measurement device of the first measurement assembly and the at least one second measurement device of the second measurement assembly, the data acquisition and processing device configured to receive the one or more first signals that are representative of the one or more first measured quantities and to convert the one or more first signals into first output data, and to receive the one or more second signals that are representative of the one or more second measured quantities and to convert the one or more second signals into second output data, the data acquisition and processing device further configured to determine whether the first output data is to be combined
- the first output data from the first measurement assembly is defined relative to a first set of coordinate axes
- the second output data from the second measurement assembly is defined relative to a second set of coordinate axes
- one or more coordinate axes of the second set of coordinate axes are disposed at a non-zero angle relative to one or more coordinate axes of the first set of coordinate axes
- the data acquisition and processing device is further configured to compute corrected output values for the second output data as a function of the non-zero angle.
- the data acquisition and processing device is further configured to compute the corrected output values for the second output data by utilizing a rotation matrix, the data acquisition and processing device being configured to compute the rotation matrix as function of the non-zero angle.
- the first output data comprises one or more first force components and the second output data comprises one or more second force components; and wherein, when the data acquisition and processing device determines that the first output data is to be combined with the second output data to create the single virtual measurement assembly, the data acquisition and processing device is further configured to mathematically combine the one or more first force components with the one or more second force components so as to determine one or more overall force components for the single virtual measurement assembly.
- the first output data comprises one or more first moment components and the second output data comprises one or more second moment components; and wherein, when the data acquisition and processing device determines that the first output data is to be combined with the second output data to create the single virtual measurement assembly, the data acquisition and processing device is further configured to mathematically combine the one or more first moment components with the one or more second moment components so as to determine one or more overall moment components for the single virtual measurement assembly.
- the data acquisition and processing device is further configured to determine at least one of the one or more overall moment components by computing the at least one of the one or more overall moment components as a function of one or more distance values, the one or more distance values based upon a dimension of the first measurement assembly or the second measurement assembly.
- the data acquisition and processing device is further configured to generate a pop-up window for prompting a system user to choose a selected measurement assembly from one of the first measurement assembly and the second measurement assembly by applying a load thereto.
- selection criteria for the selected measurement assembly comprises a distance that the selected measurement assembly is disposed from the data acquisition and processing device.
- the data acquisition and processing device is further configured to compute corrected output values for the selected measurement assembly, the corrected output values being computed as a function of a non-zero angle at which the selected measurement assembly is disposed relative to the other of the first measurement assembly and the second measurement assembly.
- the first and second output data is arranged in a plurality of sessions, output data acquired during the performance of a successive series of tests being arranged in a single session of the plurality of sessions, and wherein the data acquisition and processing device is further configured to generate one or more global reports utilizing the first and second output data acquired during one or more of the plurality of sessions, generate an information icon on the output screen of the visual display device, and assign the one or more global reports to the information icon.
- FIG. 1 is a diagrammatic perspective view of a measurement and testing system according to an embodiment of the invention
- FIG. 2 is a block diagram of constituent components of the measurement and testing system, according to an embodiment of the invention.
- FIG. 3 is a block diagram illustrating data manipulation operations carried out by the measurement and testing system, according to an embodiment of the invention
- FIG. 4 is a diagrammatic perspective view of one measurement assembly used in the measurement and testing system, according to an embodiment of the invention, wherein the measurement assembly is in the form of a dual force plate;
- FIG. 5 is a diagrammatic top view of one measurement assembly used in the measurement and testing system with exemplary coordinate axes superimposed thereon, according to an embodiment of the invention, wherein the measurement assembly is in the form of a dual force plate;
- FIG. 6 is a diagrammatic perspective view of another measurement assembly used in the measurement and testing system, according to an embodiment of the invention, wherein the measurement assembly is in the form of a single force plate;
- FIG. 7 is a diagrammatic top view of another measurement assembly used in the measurement and testing system with exemplary coordinate axes superimposed thereon, according to an embodiment of the invention, wherein the measurement assembly is in the form of a single force plate;
- FIG. 8 is a first screenshot displayed on the operator visual display device of the measurement and testing system illustrating the timeline bar feature, according to an embodiment of the invention
- FIG. 9 is a second screenshot displayed on the operator visual display device of the measurement and testing system illustrating the timeline bar feature, according to an embodiment of the invention.
- FIG. 10 is a partial flowchart illustrating a manner in which the timeline bar is generated by the measurement and testing system, according to an embodiment of the invention.
- FIG. 11 is a continuation of the flowchart of FIG. 10 , which illustrates additional steps of the timeline bar generation procedure, according to an embodiment of the invention.
- FIG. 12 is a continuation of the flowchart of FIG. 11 , which illustrates additional steps of the timeline bar generation procedure, according to an embodiment of the invention.
- FIG. 13 is a continuation of the flowchart of FIG. 12 , which illustrates additional steps of the timeline bar generation procedure, according to an embodiment of the invention.
- FIG. 14 depicts an exemplary portion of software program code and exemplary tabular data for illustrating the manner in which session records are sorted during the timeline bar generation procedure
- FIG. 15 is a first screenshot displayed on the operator visual display device of the measurement and testing system illustrating the mode change notification feature, according to an embodiment of the invention
- FIG. 16 is a second screenshot displayed on the operator visual display device of the measurement and testing system illustrating the mode change notification feature, according to an embodiment of the invention.
- FIG. 17 is a flowchart illustrating the procedure by which the dynamic population feature of the measurement and testing system is carried out, according to an embodiment of the invention.
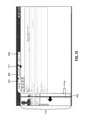
- FIG. 18 is a screenshot displayed on the operator visual display device of the measurement and testing system illustrating the signal loss alert feature, according to an embodiment of the invention.
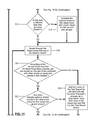
- FIG. 19 is a flowchart illustrating the procedure by which the signal loss alert feature of the measurement and testing system is carried out, according to an embodiment of the invention.
- FIG. 20 is a continuation of the flowchart of FIG. 19 , which illustrates additional steps of the procedure by which the signal loss alert feature of the measurement and testing system is carried out, according to an embodiment of the invention
- FIG. 21 is a partial screenshot displayed on the operator visual display device of the measurement and testing system illustrating a first plurality of global/progress reports that a system user is able to select, according to an embodiment of the invention
- FIG. 22 is a partial screenshot displayed on the operator visual display device of the measurement and testing system illustrating a second plurality of global/progress reports that a system user is able to select, according to an embodiment of the invention
- FIG. 23 is a screenshot displayed on the operator visual display device of the measurement and testing system illustrating an exemplary global/progress report generated by the measurement and testing system, according to an embodiment of the invention
- FIG. 24 is a partial flowchart illustrating a manner in which global/progress reports are generated by the measurement and testing system, according to an embodiment of the invention.
- FIG. 25 is a continuation of the flowchart of FIG. 24 , which illustrates additional steps of the global/progress report generation procedure, according to an embodiment of the invention.
- FIG. 26 is a partial screenshot displayed on the operator visual display device of the measurement and testing system illustrating a group of tests that are available when a first type of measurement assembly is connected to the data acquisition and processing device, according to an embodiment of the invention
- FIG. 27 is a partial screenshot displayed on the operator visual display device of the measurement and testing system illustrating a group of tests that are available when a second type of measurement assembly is connected to the data acquisition and processing device, according to an embodiment of the invention
- FIG. 28 is a partial screenshot displayed on the operator visual display device of the measurement and testing system illustrating a group of tests that are available when a third type of measurement assembly is connected to the data acquisition and processing device, according to an embodiment of the invention
- FIG. 29 is a partial screenshot displayed on the operator visual display device of the measurement and testing system illustrating a group of tests that are available when both the second and third types of measurement assemblies are connected to the data acquisition and processing device, according to an embodiment of the invention
- FIG. 30 is a partial screenshot displayed on the operator visual display device of the measurement and testing system illustrating a pop-up window that allows a system user to manually select the type of measurement assembly is connected to the data acquisition and processing device, according to an embodiment of the invention
- FIG. 31 is a partial screenshot displayed on the operator visual display device of the measurement and testing system illustrating a pop-up window that allows a system user to manually select the type of measurement assembly that he or she wants to utilize for performing a particular test, according to an embodiment of the invention
- FIG. 32 is a partial flowchart illustrating a manner in which the availability of tests are determined based on the type of measurement assembly that is connected to the data acquisition and processing device, according to an embodiment of the invention
- FIG. 33 is a continuation of the flowchart of FIG. 32 , which illustrates additional steps of the procedure by which the availability of tests are determined based on the type of measurement assembly that is connected to the data acquisition and processing device, according to an embodiment of the invention
- FIG. 34 is a flowchart illustrating the procedure by which output data from two measurement assemblies is combined by the data acquisition and processing device, according to an embodiment of the invention.
- FIG. 35 is a partial screenshot displayed on the operator visual display device of the measurement and testing system illustrating a pop-up window that is used to determine the arrangement of a plurality of measurement assemblies that are connected to the data acquisition and processing device, according to an embodiment of the invention
- FIG. 36 is a perspective view of a plurality of measurement assemblies used in the measurement and testing system, according to an embodiment of the invention, wherein the measurement assemblies are combined as a single virtual measurement assembly with two measurement surfaces, and wherein a plurality of local and absolute coordinate axes are superimposed on each of the two measurement surfaces; and
- FIG. 37 is a perspective view of a plurality of measurement assemblies used in the measurement and testing system, according to an embodiment of the invention, wherein the measurement assemblies are combined as a single virtual measurement assembly with a single measurement surface, and wherein a plurality of local and absolute coordinate axes are superimposed on the single measurement surface.
- the computer program instructions may be embodied in a combination of both the hardware and the software.
- a computing device that is “configured to”, “arranged to” and/or “configured and arranged to” perform a specific function
- this means that the computing device is specially programmed to carry out the particular function (e.g., the data acquisition/data processing device 104 being specially programmed to perform a specific function).
- the measurement and testing system 100 generally comprises a measurement assembly 102 (e.g., a force measurement assembly) that is operatively coupled to a data acquisition/data processing device 104 (i.e., a data acquisition and processing device or computing device that is capable of collecting, storing, and processing data), which in turn, is operatively coupled to a subject visual display device 106 and an operator visual display device 130 .
- a measurement assembly 102 e.g., a force measurement assembly
- a data acquisition/data processing device 104 i.e., a data acquisition and processing device or computing device that is capable of collecting, storing, and processing data
- the force measurement assembly 102 is configured to receive a subject 108 thereon, and is capable of measuring the forces and/or moments applied to its measurement surfaces 114 , 116 by the subject 108 .
- the data acquisition/data processing device 104 includes a plurality of user input devices 132 , 134 connected thereto.
- the user input devices 132 , 134 comprise a keyboard 132 and a mouse 134 .
- the operator visual display device 130 may also serve as a user input device if it is provided with touch screen capabilities.
- a desktop type computing system is depicted in FIG. 1 , one of ordinary of skill in the art will appreciate that another type of data acquisition/data processing device 104 can be substituted for the desktop computing system such as, but not limited to, a laptop or a palmtop computing device (i.e., a PDA).
- a data acquisition/data processing device 104 it is to be understood that only a data acquisition device could be provided without departing from the spirit and the scope of the claimed invention.
- force measurement assembly 102 is operatively coupled to the data acquisition/data processing device 104 by virtue of an electrical cable 118 .
- the electrical cable 118 is used for data transmission, as well as for providing power to the force measurement assembly 102 .
- Various types of data transmission cables can be used for cable 118 .
- the cable 118 can be a Universal Serial Bus (USB) cable or an Ethernet cable.
- the electrical cable 118 contains a plurality of electrical wires bundled together, with at least one wire being used for power and at least another wire being used for transmitting data. The bundling of the power and data transmission wires into a single electrical cable 118 advantageously creates a simpler and more efficient design.
- the force measurement assembly 102 can be operatively coupled to the data acquisition/data processing device 104 using other signal transmission means, such as a wireless data transmission system. If a wireless data transmission system is employed, it is preferable to provide the force measurement assembly 102 with a separate power supply in the form of an internal power supply or a dedicated external power supply.
- the force measurement assembly 102 of the illustrated embodiment is in the form of a dual force plate assembly.
- the dual force plate assembly includes a first plate component 110 , a second plate component 112 , at least one measurement device (e.g., force transducer) associated with the first plate component 110 , and at least one measurement device (e.g., force transducer) associated with the second plate component 112 .
- a subject 108 stands in an upright position on the force measurement assembly 102 and each foot of the subject 108 is placed on the top surfaces 114 , 116 of a respective plate component 110 , 112 (i.e., one foot on the top surface 114 of the first plate component 110 and the other foot on the top surface 116 of the second plate component 112 ).
- the at least one force transducer associated with the first plate component 110 is configured to sense one or more measured quantities and output one or more first signals that are representative of forces and/or moments being applied to its measurement surface 114 by the left foot/leg 108 a of the subject 108
- the at least one force transducer associated with the second plate component 112 is configured to sense one or more measured quantities and output one or more second signals that are representative of forces and/or moments being applied to its measurement surface 116 by the right foot/leg 108 b of subject 108 .
- the at least one force transducer associated with the first and second plate components 110 , 112 comprises four (4) pylon-type force transducers 154 (or pylon-type load cells) that are disposed underneath, and near each of the four corners (4) of the first plate component 110 and the second plate component 112 (see FIG. 4 ).
- Each of the eight (8) illustrated pylon-type force transducers has a plurality of strain gages adhered to the outer periphery of a cylindrically-shaped force transducer sensing element for detecting the mechanical strain of the force transducer sensing element imparted thereon by the force(s) applied to the surfaces of the force measurement assembly 102 .
- force transducers in the form of transducer beams could be provided under each plate component 110 , 112 .
- the first plate component 110 could comprise two transducer beams that are disposed underneath, and on generally opposite sides of the first plate component 110 .
- the second plate component 112 could comprise two transducer beams that are disposed underneath, and on generally opposite sides of the second plate component 112 .
- the force transducer beams could have a plurality of strain gages attached to one or more surfaces thereof for sensing the mechanical strain imparted on the beam by the force(s) applied to the surfaces of the force measurement assembly 102 .
- the force measurement assembly 102 can also utilize the force transducer technology described in pending, commonly-owned U.S. patent application Ser. No. 13/348,506, the entire disclosure of which is incorporated herein by reference.
- a force measurement assembly 102 ′ in the form of a single force plate may be employed (see FIG. 6 ).
- the single force plate comprises a single measurement surface on which both of a subject's feet are placed during testing.
- the illustrated single force plate 102 ′ comprises four (4) pylon-type force transducers 154 (or pylon-type load cells) that are disposed underneath, and near each of the four corners (4) thereof for sensing the load applied to the surface of the force measurement assembly 102 ′.
- the force measurement assembly 102 is provided with a plurality of support feet 126 disposed thereunder.
- each of the four (4) corners of the force measurement assembly 102 is provided with a support foot 126 (e.g., mounted on the bottom of each pylon-type force transducer or on the bottom of a base).
- each support foot 126 is attached to a bottom surface of a force transducer.
- one or more of the force transducers could function as support feet (e.g., if pylon-type force transducers are used, the first and second plate components 110 , 112 could be supported on the force transducers).
- at least one of the support feet 126 is adjustable so as to facilitate the leveling of the force measurement assembly 102 on an uneven floor surface.
- the data acquisition/data processing device 104 i.e., the local computing device of the measurement and testing system 100 comprises a microprocessor 104 a for processing data, memory 104 b (e.g., random access memory or RAM) for storing data during the processing thereof, and data storage device(s) 104 c , such as one or more hard drives, compact disk drives, floppy disk drives, flash drives, or any combination thereof.
- a microprocessor 104 a for processing data
- memory 104 b e.g., random access memory or RAM
- data storage device(s) 104 c such as one or more hard drives, compact disk drives, floppy disk drives, flash drives, or any combination thereof.
- the force measurement assembly 102 , the subject visual display device 106 , and the operator visual display device 130 are operatively coupled to the data acquisition/data processing device 104 such that data is capable of being transferred between these devices 102 , 104 , 106 , and 130 .
- a plurality of data input devices 132 , 134 such as the keyboard 132 and mouse 134 shown in FIG. 1 , are operatively coupled to the data acquisition/data processing device 104 so that a user is able to enter data into the data acquisition/data processing device 104 .
- the data acquisition/data processing device 104 can be in the form of a desktop computer, while in other embodiments, the data acquisition/data processing device 104 can be embodied as a laptop computer.
- the measurement and testing system 100 can also include a remote computing device 136 .
- the remote computing device 136 also comprises a microprocessor for processing data, memory (e.g., random access memory or RAM) for storing data during the processing thereof, and data storage device(s), such as one or more hard drives, compact disk drives, floppy disk drives, flash drives, or any combination thereof.
- the remote computing device 136 can be operatively coupled to the data acquisition/data processing device 104 (i.e., the local computing device) by means of a network connection 138 .
- the network connection 138 is an encrypted network connection so that data can be securely transferred between the local computing device 104 and the remote computing device 136 .
- the network connection 138 between the computing devices 104 , 136 can be a conventional hard-wired connection (e.g., utilizing an Ethernet cable or any other type of suitable data transmission cable), or alternatively, can utilize wireless data transmission technology (e.g., a wireless local area network, commonly referred to as Wi-Fi technology).
- the network connection 138 between the computing devices 104 , 136 can be an Internet-based connection.
- the local computing device 104 is disposed at a first location, while the remote computing device 136 is disposed at a second location.
- the first location is geographically remote from the second location, and the first and second locations are separated from one another by a predetermined distance (e.g., by at least one mile).
- each visual display device 106 , 130 of the measurement and testing system 100 will be described in more detail.
- each visual display device 106 , 130 is in the form of a flat panel monitor.
- flat panel monitors having various types of data transmission cables 120 , 140 may be used to operatively couple the visual display devices 106 , 130 to the data acquisition/data processing device 104 .
- the flat panel monitors employed may utilize a video graphics array (VGA) cable, a digital visual interface (DVI or DVI-D) cable, a high-definition multimedia interface (HDMI or Mini-HDMI) cable, or a DisplayPort digital display interface cable to connect to the data acquisition/data processing device 104 .
- VGA video graphics array
- DVI or DVI-D digital visual interface
- HDMI or Mini-HDMI high-definition multimedia interface
- DisplayPort digital display interface cable to connect to the data acquisition/data processing device 104 .
- the visual display devices 106 , 130 can be operatively coupled to the data acquisition/data processing device 104 using wireless data transmission means. Electrical power is supplied to the visual display devices 106 , 130 using a separate power cord that connects to a building wall receptacle.
- the visual display devices 106 , 130 can be embodied in various forms.
- the visual display devices 106 , 130 may comprise a liquid crystal display (i.e., an LCD display), a light-emitting diode display (i.e., an LED display), a plasma display, a projection-type display, or a rear projection-type display.
- the subject visual display device 106 may take other forms as well, such as a head-mounted display, a heads-up display, or a 3-dimensional display.
- Each of the visual display devices 106 , 130 may also be in the form of a touch pad display.
- the visual display devices 106 , 130 may comprise multi-touch technology which recognizes two or more contact points simultaneously on the surface of the screen so as to enable users of the device to use two fingers for zooming in/out, rotation, and a two finger tap.
- FIG. 3 graphically illustrates the acquisition and processing of the load data carried out by the exemplary measurement and testing system 100 .
- a load L is applied to the force measurement assembly 102 by a subject disposed thereon.
- the load is transmitted from the first and second plate components 110 , 112 to its respective set of pylon-type force transducers or force transducer beams.
- each plate component 110 , 112 comprises four (4) pylon-type force transducers 154 disposed thereunder.
- these pylon-type force transducers are disposed near respective corners of each plate component 110 , 112 .
- each of the pylon-type force transducers includes a plurality of strain gages wired in one or more Wheatstone bridge configurations, wherein the electrical resistance of each strain gage is altered when the associated portion of the associated pylon-type force transducer undergoes deformation resulting from the load (i.e., forces and/or moments) acting on the first and second plate components 110 , 112 .
- the load i.e., forces and/or moments
- the four (4) pylon-type force transducers 154 disposed under each plate component 110 , 112 output a total of four (4) analog output voltages (signals).
- the four (4) analog output voltages from each plate component 110 , 112 are then transmitted to a preamplifier board (not shown) for preconditioning.
- the preamplifier board is used to increase the magnitudes of the transducer analog voltages, and preferably, to convert the analog voltage signals into digital voltage signals as well.
- the force measurement assembly 102 transmits the force plate output signals S FPO1 -S FPO8 to a main signal amplifier/converter 144 .
- the force plate output signals S FPO1 -S FPO8 could be either in the form of analog signals or digital signals.
- the main signal amplifier/converter 144 further magnifies the force plate output signals S FPO1 -S FPO8 , and if the signals S FPO1 -S FPO8 are of the analog-type (for a case where the preamplifier board did not include an analog-to-digital (A/D) converter), it may also convert the analog signals to digital signals.
- the signal amplifier/converter 144 transmits either the digital or analog signals S ACO1 -S ACO8 to the data acquisition/data processing device 104 (computer 104 ) so that the forces and/or moments that are being applied to the surfaces of the force measurement assembly 102 can be transformed into output load values OL.
- the data acquisition/data processing device 104 may further comprise an analog-to-digital (A/D) converter if the signals S ACO1 -S ACO8 are in the form of analog signals. In such a case, the analog-to-digital converter will convert the analog signals into digital signals for processing by the microprocessor 104 a.
- the data acquisition/data processing device 104 When the data acquisition/data processing device 104 receives the voltage signals S ACO1 -S ACO8 , it initially transforms the signals into output forces and/or moments by multiplying the voltage signals S ACO1 -S ACO8 by a calibration matrix. After which, the force F L exerted on the surface of the first force plate by the left foot of the subject, the force F R exerted on the surface of the second force plate by the right foot of the subject, and the center of pressure for each foot of the subject (i.e., the x and y coordinates of the point of application of the force applied to the measurement surface by each foot) are determined by the data acquisition/data processing device 104 . Referring to FIG.
- a force measurement assembly 102 ′ in the form of a single force plate may be employed (see FIGS. 6 and 7 , which illustrate a single force plate).
- the single force plate comprises a single measurement surface on which both of a subject's feet are placed during testing.
- the embodiments employing the single force plate compute a single set of overall center of pressure coordinates (x P , y P ) in accordance with x and y coordinate axes 150 , 152 .
- the data acquisition/data processing device 104 determines the vertical forces F Lz , F Rz exerted on the surface of the first and second force plates by the feet of the subject and the center of pressure for each foot of the subject, while in another exemplary embodiment, the output forces of the data acquisition/data processing device 104 include all three (3) orthogonal components of the resultant forces acting on the two plate components 110 , 112 (i.e., F Lx , F Ly , F Lz , F Rx , F Ry , F Rz ). In yet other embodiments of the invention, the output forces and moments of the data acquisition/data processing device 104 can be in the form of other forces and moments as well.
- the aforedescribed functionality of the measurement and testing system 100 can be carried out by the data acquisition/data processing device 104 (i.e., the local computing device) utilizing software, hardware, or a combination of both hardware and software.
- the data acquisition/data processing device 104 can be specially programmed to carry out the functionality described hereinafter.
- the computer program instructions necessary to carry out this functionality may be loaded directly onto an internal data storage device 104 c of the data acquisition/data processing device 104 (e.g., on a hard drive thereof) and subsequently executed by the microprocessor 104 a of the data acquisition/data processing device 104 .
- these computer program instructions could be stored on a portable computer-readable medium (e.g., a flash drive, a floppy disk, a compact disk, etc.), and then subsequently loaded onto the data acquisition/data processing device 104 such that the instructions can be executed thereby.
- these computer program instructions are embodied in the form of a measurement and testing software program executed by the data acquisition/data processing device 104 .
- these computer program instructions could be embodied in the hardware of the data acquisition/data processing device 104 , rather than in the software thereof. It is also possible for the computer program instructions to be embodied in a combination of both the hardware and the software.
- the data acquisition/data processing device 104 of the measurement and testing system 100 is configured and arranged to generate a screen image 200 that includes a timeline bar 202 disposed proximate to a top of the output screen of the operator visual display device 130 .
- the illustrated timeline bar 202 includes a plurality date icons 204 , 206 , 208 for accessing subject testing output data.
- the data acquisition/data processing device 104 is additionally configured to assign the subject testing output data to a selected one of the plurality of date icons 204 , 206 , 208 in accordance with the date on which the subject testing output data was generated.
- the data acquisition/processing device 104 is further configured to generate a subject (patient) information icon 210 in the timeline bar 202 that includes information about a particular test subject for which output data was generated by the measurement and testing system 100 .
- the data acquisition/processing device 104 is further configured to generate a drop-down menu 212 for at least one of the plurality of date icons (e.g., date icon 204 ), wherein the drop-down menu 212 comprises output data collected at a plurality of different times on the date (e.g., Jun. 18, 2009) displayed on the associated date icon 204 .
- the drop-down menu 212 comprises output data collected at a plurality of different times on the date (e.g., Jun. 18, 2009) displayed on the associated date icon 204 .
- the data acquisition/processing device 104 is preferably configured to arrange the output data listed in the drop-down menu 212 in accordance with the time at which the output data was collected.
- the output data collected at the plurality of different times is arranged by the data acquisition/processing device 104 in one of ascending or descending order based upon the time at which it was collected ( FIG. 9 illustrates an example of arrangement in ascending order, i.e., listing morning (AM) times before afternoon (PM) times).
- AM listing morning
- PM afternoon
- the data acquisition/processing device 104 is configured to generate a visual indicator 214 (e.g., a small triangle) in a lower corner of the date icon 204 containing the drop-down menu 212 .
- the other date icons 206 , 208 which also contain drop down menus, are provided with visual indicators (e.g., small triangles) in the lower corners thereof.
- the subject (patient) information icon 210 also contains a drop-down menu 216 .
- the patient or subject drop-down menu 216 includes several different items that may be selected by the user of the system 100 , such as general patent information, patient progress reports, and data exporting options.
- the subject (patient) information icon 210 has a visual indicator 218 (e.g., a small triangle) in a lower corner thereof in order to inform users of the system 100 that the subject (patient) information icon 210 contains a drop-down menu 216 .
- the specific attributes of the timeline bar 202 which can be embodied in a measurement and testing software program(s), will be described in more detail.
- the items (e.g., subject testing results) in the timeline bar 202 are organized by date, and additionally sorted by time.
- the measurement and testing software program executed by the data acquisition/data processing device 104 also groups tests performed during a particular session together.
- a session is defined as a series of tests that are performed in succession without exiting the test series.
- test results which are a form of output data generated from the measurement device signals of the measurement assembly 102 , are grouped into session records (i.e.
- session records can comprise a collection of output data from the measurement assembly 102 , as well as other types of data).
- a session could be defined in a different manner in other embodiments of the invention.
- a session could be determined in accordance with predetermined window of time (e.g., 10 minutes) as set by a user, or a session could be defined as a specific block of tests that are specified by the user to comprise a session.
- predetermined window of time e.g. 10 minutes
- a session could be defined as a specific block of tests that are specified by the user to comprise a session.
- separating line 220 separates the two distinct sessions from one another.
- the dynamic population feature of the measurement and testing software program drives the content of the timeline bar 202 . For example, suppose three Standing Stability tests are performed in the same session. The measurement and testing software will combine these into a single report when the testing data is entered into the program.
- FIGS. 10-13 a flowchart illustrating the functionality of the timeline bar feature of the measurement and testing system 100 is set forth in FIGS. 10-13 . All of the steps described below with reference to the flowcharts of FIGS. 10-13 are carried out by the data acquisition/processing device 104 .
- the flowcharts graphically illustrate the manner in which the data acquisition/processing device 104 generates the timeline bar, as well as the manner in which output data is assigned to elements of the timeline bar. Referring initially to FIG.
- the procedure commences at 300 when a patient record is selected on the screen by a system user, and in step 302 , the timeline bar 202 is emptied and reset to the initial condition by the data acquisition/processing device 104 in response to the user input (i.e., the contents of the timeline bar 202 are deleted).
- a database e.g., a patient database
- the patient database can be searched for all records containing the same patient globally unique identifier (GUID), which identifies a particular patient.
- GUID globally unique identifier
- the resulting record set is sorted by date (see e.g., table 340 in FIG. 14 ). Depending on the particular configuration that is desired, this sorting order can be oldest-to-newest or newest-to-oldest.
- the “WHERE” clause in the query string 338 only returns results for a matching patient identifier (i.e., patent GUID “4f6 . . . a5d”—the middle characters of the GUID have been omitted to facilitate the explanation thereof, as indicated by the use of the ellipses), while the “ORDER” clause will order the result set by the StartTime, which is a field in the TestResults table.
- the “SELECT DISTINCT Sessions.*” clause only returns fields from the Sessions table (otherwise, columns would be obtained from both tables, which is not desirable). Using the “DISTINCT” keyword ensures that only distinct results are returned (i.e., duplicate rows are filtered out).
- the use of “Sessions.*”, rather than just “*”, ensures that only unique rows from the Sessions table are returned, rather unique rows from both the Sessions table and the TestResults table.
- the main benefit of executing the “INNER JOIN” command in the query string 338 of FIG. 14 is that any sessions, which contain no data (i.e., sessions that are empty), are removed from the record lists. As a result, the timeline bar is not populated with sessions having no data.
- each session record is read and then, in decision block 308 , it is determined whether the date field in the session record exists in the existing timeline bar 202 for that particular patient.
- the session record may have a “start time” field associated therewith (see FIG. 14 ) that contains the time and date on which the test was performed. If the date field does not exist in the timeline bar 202 , then a new session group is created as a visual icon (e.g., 204 , 206 , 208 , 222 ) in the timeline bar 202 (step 310 ).
- step 11 it is determined if the date field contains a year that is different from those presently included in the timeline bar 202 . If the year in the date field is different from those presently included in the timeline bar 202 (e.g., the year 2008, which is not included in the timeline bar 202 of FIGS. 8 and 9 ), the spacing between the existing date icons and the added date icon(s) is increased (i.e., a noticeable gap is created by year groupings—see step 314 of FIG. 11 ). Also, in step 314 , a visual border is created around date icon(s) from the same year. For example, see the added date icon 222 in FIG. 9 (Dec.
- an existing session group visual icon is used (e.g., icon 204 ), and a visual line (e.g., dashed separating line 226 in FIG. 9 ) is created in the drop-down menu 212 to indicate multiple sessions on this same date (in step 316 ).
- mCTSIB test the added session test 224 in FIG. 9 (i.e., mCTSIB test), which has been outlined with dashed lines in order to signify that it has been added to the drop-down menu 212 .
- decision block 312 of FIG. 11 if it is determined that the date field contains a year that is the same as one of those presently included in the timeline bar 202 (e.g., the year 2009, which is included in the timeline bar 202 of FIGS. 8 and 9 ), then an iteration through the test results in the session record is performed in step 318 .
- each test result is identified using a unique GUID as the record identifier, which is used to identify and locate record (sessions and records of other types are also identified using unique GUIDs as well).
- decision block 320 of FIG. 11 it is determined whether, in accordance with the report rules from the dynamic population process, if the results for the particular test are to be combined with other similar or same test results in the session. For example, suppose the report rules comprise the following lines of code:
- test reports comprise test results presented in a form that is readily ascertainable to a user (e.g., in graphical form).
- the results for the particular test are to be combined with other similar or the same test results in the session, then in decision block 322 , it is further determined if the same or similar test results already exist in the drop-down menu (e.g., 212 ) for the visual icon (e.g., date icon 204 ) as described above. If the same or similar test results do not exist in the drop-down menu 212 , then the name of the test report for this test from the dynamic population process will be added as a drop-down menu item entry (e.g., “mCTSIB” test 224 in drop-down menu 212 ) in the visual icon (e.g., date icon 204 ) and it will be linked to this test result record (step 324 ).
- mCTSIB “mCTSIB” test 224 in drop-down menu 212
- test report for this test also will be added as a drop-down menu item entry if, in decision block 320 , it is determined that, according to the report rules from dynamic population process, the results for the particular test are not to be combined with other similar or same test results in the session (refer to FIG. 11 ).
- decision block 322 if it is determined that the same or similar test results already exist in the drop-down menu (e.g., 212 ) for the visual icon (e.g., date icon 204 ), then additional internal data is added to an existing entry in the drop-down menu item (see step 326 in FIG. 12 ).
- the text of the menu item can be changed per the dynamic population template rules (e.g., a parenthetical number may be placed next to the entry in the drop-down menu 212 —see FIG. 9 ).
- decision block 328 of FIG. 12 it is determined whether there are any additional test results for this session record. If there are any additional test results for this session record, then the process reverts back to step 318 in FIG.
- decision block 330 it is determined if there are any additional session records that are to be processed. If it is determined in decision block 330 that there are additional session records that require processing, then the process reverts back to step 306 in FIG. 10 , wherein each session record is read. However, if it is determined at decision block 330 that there are not any additional session records that need to be processed, then the process proceeds to decision block 332 .
- step 334 of FIG. 13 those global report(s) are gathered and placed in the first timeline visual icon (e.g., patient information icon 210 ) as a set of drop-down menu icons with a unique representational symbol in the timeline item, and the process ends at 336 .
- the process ends at step 336 in FIG. 13 .
- the data acquisition/data processing device 104 of the measurement and testing system 100 is configured and arranged to generate a screen image 400 with a plurality of mode selection tabs 402 , 406 , 408 and a side bar menu 410 on the operator visual display device 130 .
- the data acquisition/data processing device 104 is configured to automatically displace the side bar menu 410 to an edge of the screen image 400 .
- the displacement of the side bar menu 410 is a visual indicator of a system or process state change that is used to draw attention that a significant mode of operation has changed for the user that may otherwise happen without the user noticing it.
- a current mode of operation e.g., patient data entry mode
- another mode of operation e.g., assessment mode
- the data acquisition/data processing device 104 is configured to automatically displace the side bar menu 410 to an edge of the screen image 400 .
- the displacement of the side bar menu 410 is a visual indicator of a system or process state change that is used to draw attention that a significant mode of operation has changed for the user that may otherwise happen without the user noticing it.
- the plurality of mode selection tabs 402 , 406 , 408 is disposed proximate to a top of the screen image 400 and the side bar menu 410 is disposed proximate to a lateral side of the screen image 400 .
- the side bar menu 410 is replaced by a new sidebar menu 412 (see FIG. 16 ) associated with the another mode (e.g., the assessment mode).
- the data acquisition/processing device 104 automatically displaces the side bar menu 410 to the edge of the operator visual display device 130 , an inner edge 410 a (see FIG.
- the displacement of the side bar menu 410 off the output screen alerts the user of the measurement and testing system 100 that he or she is switching operational modes (i.e., switching the functional content of the software program). Otherwise, without the notification effect created by the displacement of the side bar menu 410 , a user of the system 100 may not be readily unaware that he or she is switching modes.
- the data acquisition/data processing device 104 is programmed to take a graphical snapshot (e.g., a bitmap grab) of the screen image (e.g., screen image 400 ) on the operator visual display device 130 that is changing or switching contexts (i.e., when a user selects one of the tabs 402 , 406 , 408 ).
- the bitmap image is then placed into a top-level window container as the entire surface to be used.
- This top-level container i.e., top-level meaning that it is above everything else
- the operation mode is then changed, which results in the area that was made into a visual bitmap being erased and replaced with something else.
- the system notifies the animation routine to begin moving the bitmap image off the screen.
- the graphical snapshot is animated so that it appears as if the side bar menu 410 is sliding off the output screen. For example, every 30 frames per second, the measurement and testing software program executed by the data acquisition/data processing device 104 moves the bitmap image across the output screen of the operator visual display device 130 and forces the area to redraw. After the animation has been completed (i.e., by the bitmap image moving completely off the screen), the bitmap and the top-level container are both discarded.
- the remote computing device 136 which is disposed at a first location, is specially programmed to generate one or more testing routines based upon input by a first system user.
- the data acquisition/data processing device 104 is configured to read the one or more testing routines generated by the remote computing device 136 and to integrate the one or more testing routines into the measurement and testing software program loaded thereon and executed thereby (i.e., dynamically populate the software program with new tests that are remotely generated).
- the one or more testing routines generated by the remote computing device 136 operate as an automatic plug-in to the measurement and testing software program (e.g., like a macro).
- the data acquisition/data processing device 104 of the measurement and testing system 100 is further configured to enable a second system user to utilize the one or more testing routines in the measurement and testing software program while data is acquired from a subject undergoing testing on the measurement assembly.
- this dynamic population feature of the measurement and testing software program allows the tests performed by the measurement and testing system 100 to be created and/or updated easily off-site, thereby obviating the need for the system end user to develop his or his own tests. Because the testing routines are typically written in a specific program code (e.g., HTML), and system end users are rarely trained software programmers, the dynamic population feature enables the measurement and testing software to be regularly updated without the need for system end users trained in software programming.
- end users of the measurement and testing software need to make only minor changes to the testing routines, they are able to change cosmetic features of test report output by utilizing a basic text editor, such as Microsoft® Notepad, for making changes to data labeling, and the like, in the program code.
- a basic text editor such as Microsoft® Notepad
- the dynamic population feature of the measurement and testing software program reads a specific set of directories, and looks for a specific pattern of filenames (e.g., the software looks for HTML files under a specific set of directories). After which, the measurement and testing software program reads the content of the specific identified files, and looks for specific patterns of text. The patterns of text in the specific identified files inform the measurement and testing software program on the data acquisition/data processing device 104 how to organize the tests, the test reports, and the test outputs.
- the first line of text in an exemplary HTML file may contain the following information: (i) the name of the test (e.g., Forward Lunge), (ii) the tab under which the test is to be located in the measurement and testing software program (e.g., Assessment), (iii) the grouping within the tab, if applicable (e.g., the “Training” tab includes groups, such as “Closed Chain”, “Mobility”, “Quick Training”, “Seated”, and “Weight Shifting”), and any predefined or custom options.
- the name of the test e.g., Forward Lunge
- the tab under which the test is to be located in the measurement and testing software program e.g., Assessment
- the grouping within the tab if applicable
- the “Training” tab includes groups, such as “Closed Chain”, “Mobility”, “Quick Training”, “Seated”, and “Weight Shifting”
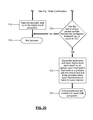
- a flowchart illustrating the functionality of the dynamic population feature of the measurement and testing system 100 is set forth in FIG. 17 . All of the steps described below with reference to the flowchart of FIG. 17 are carried out by the data acquisition/processing device 104 .
- the procedure commences at 500 , and in step 502 , a list of files from a defined set of folders is gathered.
- the testing software program looks for a specific file pattern (e.g., a specific extension) in a particular directory (e.g. a “Reports” directory) using a regular expression search routine (regex).
- each file is read and, at decision block 506 , it is determined if the particular file contains report rules or a matching template definition pattern (e.g., with one or more key pairs). If the file does not contain a definition matching template pattern, the process proceeds to step 512 , wherein it is determined if there are any more files. If the file does contain a definition matching template, the template information is processed from the file in step 508 , which includes matching any key fields with stored database objects and caching off file identifiers for later matching and organization.
- the file identifiers (i.e., file names) are stored internally in the cache memory of the data acquisition/data processing device 104 so that the file identifiers do not have to be repeatedly read from a directory, thereby resulting in a performance advantage.
- file names i.e., file names
- the file identifiers are stored internally in the cache memory of the data acquisition/data processing device 104 so that the file identifiers do not have to be repeatedly read from a directory, thereby resulting in a performance advantage.
- any tests that existed before in the database, but do not presently have any matching files, are marked as inactive (because the system can no longer process the tests or show reports for them, but this could be a transient problem that reinstalling the test will fix, so nothing is deleted). For example, the tests or reports could have been inadvertently deleted by a system user.
- each template result is sorted into an appropriate list (e.g., global reports, focused testing, test result reports, etc.).
- a global report may contain general patient information that is not associated with any particular test. If the report type is “global”, then there is no test object assigned to this report, and it will be placed in the patient information icon (i.e., icon 210 in FIGS. 8 and 9 ).
- decision block 512 it is determined if there are any more files. If it is determined at step 512 that there are more files, then the process reverts back to step 504 . If it is determined that there are no more files in step 512 , the process ends at 514 .
- the data acquisition/data processing device 104 of the measurement and testing system 100 is configured and arranged to alert the user of the system when the one or more signals from the at least one transducer of the measurement assembly 102 are no longer detected by generating a quasi-instantaneous visual indicator on the operator visual display device 130 .
- a specially programmed timing routine is incorporated in the force plate driver. If the specially programmed timing mechanism does not receive data from the force measurement assembly 102 in a predetermined amount of time, it will signal to the primary application program (i.e., a higher level software program) that the force measurement assembly 102 has been disconnected or has failed.
- the predetermined amount of time ranges from approximately 100 milliseconds to approximately 3 seconds (or from 100 milliseconds to 3 seconds).
- the specially programmed timing routine is embodied in steps 704 , 714 , and 720 described below with respect to the flowchart of FIGS. 19 and 20 .
- the high end of the range is intended to give a user of the measurement and testing system 100 enough time to reconnect the force measurement assembly 102 to the data acquisition/data processing device 104 (i.e., enough time to reconnect electrical cable 118 ).
- the visual indicator displayed on the operator visual display device 130 comprises a change in a background color of a screen image 600 .
- the change in the background color of the screen image 600 comprises changing the top border 602 and the bottom border 604 of the screen image 600 from a first color to a second color.
- the change in the color of the top and bottom border 602 , 604 is indicated through the use of a hatching pattern (i.e., a diagonal hatching pattern).
- the first color of the top and bottom border 602 , 604 is dark blue, while the second color of the top and bottom border 602 , 604 is bright red.
- Bright red is chosen for the second color because it readily attracts the attention of the user so that corrective measures may be immediately taken thereby.
- FIGS. 19 and 20 a flowchart illustrating the functionality of the measurement assembly disconnect/failure alert feature of the measurement and testing system 100 is set forth in FIGS. 19 and 20 .
- the process described herein assumes that the USB communication system has already been established with the measurement assembly 102 (i.e., force plate), in accordance with the hardware chipset provider's specifications. In general, this requires the opening of a USB connection and looking for specific device signatures. All of the steps described below with reference to the flowcharts of FIGS. 19 and 20 are carried out by the data acquisition/processing device 104 .
- the procedure commences at 700 , and in step 702 , an attempt is made to read a block of data (i.e., transmitted in one or more signals) from the one or more measurement devices (i.e., one or more force transducers) of the force measurement assembly 102 .
- a predetermined amount of time e.g., a predetermined timeout of 100 milliseconds. If the data is able to be read in a predetermined amount of time, then, in step 706 , the received data is decoded and a checksum analysis is performed. The checksum analysis is performed in order to ensure the integrity of the raw data from the force measurement assembly 102 .
- the checksum analysis may utilize a particular cyclic redundancy check (CRC), such as a CRC-16.
- CRC cyclic redundancy check
- the bad or empty packet counter is incremented in step 714 .
- a bad packet is indicative of a bad checksum, whereas an empty packet counter signifies the receipt of empty data.
- step 708 it is determined whether the decoded checksum is valid. If the decoded checksum is determined to be valid, the bad or empty packet counter is reset in step 710 . Then, in step 712 of FIG. 20 , the decoded data is passed up to the higher level processor (i.e., a high level software program, such as the measurement and testing software program, which is a type of data collection and analysis software program), and the process ends at step 718 . However, if the decoded checksum is determined to be invalid in step 708 , the data block is discarded and the bad or empty packet counter is incremented in step 716 .
- the higher level processor i.e., a high level software program, such as the measurement and testing software program, which is a type of data collection and analysis software program
- the bad or empty packet counter has been incremented in either step 714 or 716 , it is determined, in decision block 720 of FIG. 20 , whether or not the bad or empty packet counter has reached the configured threshold (e.g., a predetermined number of packets of data).
- the predetermined number of packets of data can be set based upon the amount of noise that is tolerable in the system 100 .
- the predetermined number of packets of data may also set in accordance with the type of measurement assembly (e.g., force measurement assembly 102 ) that is operatively coupled to the data acquisition/data processing device 104 .
- a complex force measurement assembly 102 e.g., having a large number of separate plates or measurement surfaces
- a small predetermined number of packets may be set (e.g., 2 packets).
- a simpler force measurement assembly 102 is coupled to the data acquisition/data processing device 104
- a larger predetermined number of packets may be tolerable (e.g., 15 packets). If the bad or empty packet counter has not reached the configured threshold, the process ends at step 718 .
- step 720 the application and the other high-level processors (e.g., the measurement and testing software program) are signaled by an agreed-upon mechanism in step 722 , which indicates that there is a problem with the force measurement assembly 102 and that it has probably either been disconnected or failed in some manner.
- step 722 the process ends, and a condition is set to reset the USB subsystem at 725 .
- the data acquisition/data processing device 104 of the measurement and testing system 100 is configured and arranged to generate one or more subject global or progress reports (see e.g., the Forward Lunge Progress Report in FIG. 23 ) utilizing the output data acquired during one or more of the plurality of sessions, generate a subject information icon on the output screen of the visual display device, and assign the one or more subject global reports to the subject information icon.
- the output data is arranged in a plurality of sessions, and output data that is acquired during the performance of a successive series of tests is arranged in a single session of the plurality of sessions.
- the global/progress reports collect information (e.g., output data) from individual sessions and display the aggregate results in one overall report (e.g., the exemplary report illustrated in FIG. 23 ).
- information contained in a typical global/progress report is based upon output data collected on a plurality of different dates (i.e., the typical global/progress report spans across multiple days).
- the global/progress reports may contain less detailed information than that which is available by accessing the reports for individual sessions themselves (i.e., by using the date icons of the timeline bar)
- the global/progress reports enable a system user to get an overall look at a particular subject's test performance over a period of time (e.g., over several days) without the need to laboriously click on each and every individual session in the date icons of the timeline bar.
- the global/progress reports advantageously allow a system user to more quickly ascertain a subject's overall performance during a certain test by simply clicking on a single entry in a drop-down menu.
- the data acquisition/data processing device 104 of the measurement and testing system 100 is configured and arranged to generate a screen image 800 that includes a timeline bar 802 with a subject (patient) information icon 804 having a plurality of entries 808 - 816 arranged in a drop-down menu 806 .
- a screen image 800 that includes a timeline bar 802 with a subject (patient) information icon 804 having a plurality of entries 808 - 816 arranged in a drop-down menu 806 .
- the entries in the drop-down menu 806 include: (i) patient information 808 (e.g., background information regarding the patient, such as height, weight, home address, contact information, name of physician, etc.), (ii) a first global/progress report 810 for a mCTSIB test (i.e., mCTSIB Progress Report), (iii) a second global/progress report 812 for a rhythmic weight shift test (i.e., Rhythmic Weight Shift Progress), (iv) a third global/progress report 814 for a unilateral stance test (i.e., Unilateral Stance Progress), and (v) a fourth global/progress report 816 for a weight bearing squat test (i.e., Weight Bearing Squat Progress).
- patient information 808 e.g., background information regarding the patient, such as height, weight, home address, contact information, name of physician, etc.
- FIG. 22 Another exemplary screenshot 800 ′ is depicted in FIG. 22 . Similar to the screenshot 800 illustrated in FIG. 21 , the screenshot 800 ′ of FIG. 22 includes a timeline bar 802 ′ with a subject (patient) information icon 804 having a plurality of entries 808 ′ and 818 - 832 arranged in a drop-down menu 806 ′.
- the drop-down menu 806 ′ in the screenshot 800 ′ contains significantly more global/progress report entries 818 - 832 than that illustrated in the screenshot 800 of FIG. 21 .
- the drop-down menu 806 ′ includes the following entries: (i) a first global/progress report 818 for a forward lunge test (i.e., Forward Lunge Progress), (ii) a second global/progress report 820 for a mCTSIB test (i.e., mCTSIB Progress Report), (iii) a third global/progress report 822 for a rhythmic weight shift test (i.e., Rhythmic Weight Shift Progress), (iv) a fourth global/progress report 824 for a sit to stand test (i.e., Sit to Stand Progress), (v) a fifth global/progress report 826 for a step, quick turn test (i.e., Step, Quick Turn Progress), (vi) a sixth global/progress report 828 for a step up, over test (i.e., Step Up, Over Progress), (vii) a seventh global/progress report 830 for a tandem walk test
- the content of an exemplary global/progress report will be described.
- the exemplary report 834 i.e., the Forward Lunge Progress Report
- contains a plurality of graphs 836 - 850 i.e., eight (8) graphs arranged in four (4) rows and two (2) columns).
- Each of these graphs 836 - 850 includes output data that was acquired during a plurality of sessions on a plurality of days (e.g., February 26th, April 4th, April 11th, and April 12th).
- February 26th and April 4th are only listed once along the x-axis, while April 11th is listed twice, and April 12th is listed three times. This is because only a single session of the forward lunge test was performed on both February 26th and April 4th, while two sessions of the test were performed on April 11th, and three sessions of the test were performed on April 12th.
- the graphs disposed in the left-hand column of FIG. 23 include results for both the right and left legs of the subject or patient. The results for the right leg of the subject are differentiated from the results for the left leg of the subject by placement of a small circle 852 at the top of the bars pertaining to the right leg output results.
- the data acquisition/data processing device 104 is further configured and arranged to automatically alert a system user when one or more test results displayed in the one or more subject global reports are outside a predetermined range, below a normal value (e.g., below an average value for healthy subjects within a particular age group), or above a baseline value by generating a first visual indicator on the output screen of the visual display device.
- a normal value e.g., below an average value for healthy subjects within a particular age group
- a baseline value e.g., below a baseline value by generating a first visual indicator on the output screen of the visual display device.
- the measurement and testing system 100 indicates that test results are outside a predetermined range, below a normal value, or above a baseline value by using a red color to display those results on the output screen of the visual display device.
- FIG. 23 is a black-and-white image, test results that are outside a predetermined range, below a normal value, or above a baseline value are indicated through the use of a first hatching pattern (i.e., a diagonal hatching pattern, to indicate those results that would appear in “red” on the output screen).
- a first hatching pattern i.e., a diagonal hatching pattern, to indicate those results that would appear in “red” on the output screen.
- the results displayed in the graph 836 indicate that the patient or subject performing the forward lunge test did not lunge forward the normal percentage distance for a person his or her age during any of the testing sessions.
- the 40% value i.e., lunge distance as a percentage of body height
- threshold line 856 represents the normal value for a person who is approximately the subject's same age (e.g., based on an average value for healthy subjects).
- the graphs 836 - 842 on the left-hand side of the report 834 are concerned with whether or not the patient or subject is above or below a single normal value, while the graphs 844 - 850 on the right-hand side of the report 834 are concerned with whether or not the patient or subject is within a normal percentage band of difference between the right and left legs. That is, each of the graphs 844 - 850 on the right-hand side of the report 834 focuses on the percentage difference between the two legs of the subject.
- the data acquisition/data processing device 104 is additionally configured and arranged to automatically alert the user of the system when one or more test results displayed in the one or more subject global reports are within a predetermined range, above a normal value (e.g., above an average value for healthy subjects within a particular age group), or below a baseline value by generating a second visual indicator on the output screen of the visual display device, which is distinct from the first visual indicator.
- the measurement and testing system 100 indicates that test results are within a predetermined range, above a normal value, or below a baseline value by using a green color to display those results on the output screen of the visual display device.
- FIG. 23 is a black-and-white image, test results that are within a predetermined range, above a normal value, or below a baseline value are indicated through the use of second and third hatching patterns (i.e., a criss-cross and horizontal line style hatching patterns, to indicate those results that would appear in “green” on the output screen).
- second and third hatching patterns i.e., a criss-cross and horizontal line style hatching patterns, to indicate those results that would appear in “green” on the output screen.
- results displayed in the graph 838 indicate that, on both February 26th and April 4th, the patient or subject performing the forward lunge test had an impact index that exceeded the normal value for a person who is approximately the subject's same age.
- the results displayed in the graph 840 indicate that, on both February 26th and April 4th, the patient or subject performing the forward lunge test had a contact time that was below the baseline value for a person who is approximately the subject's same age.
- graph 846 in FIG. 23 (entitled Impact Index (% Difference))
- the bars in this graph for the sessions occurring on February 26th and April 4th are denoted with the criss-cross style hatching pattern 862 to indicate that they are both within a predetermined range or band (i.e., as indicated by the bounding lines 868 , 870 extending generally horizontally across the graph 846 ).
- the results displayed in the graph 846 indicate that the patient or subject performing the forward lunge test had a normal percent difference in the impact index achieved by his or her right leg as compared to his or her left leg for the testing sessions performed on February 26th and April 4th. On these two days, the impact index, expressed as a percent difference between the two legs, fell within the normal band bounded by lines 868 , 870 for results in a normal range.
- FIGS. 24 and 25 a flowchart illustrating the functionality of the global/progress reports feature of the measurement and testing system 100 is set forth in FIGS. 24 and 25 . All of the steps described below with reference to the flowcharts of FIGS. 24 and 25 are carried out by the data acquisition/processing device 104 .
- the procedure commences at 900 , and in step 902 , reports of a “Global” type are selected from a master list.
- step 902 a list of files is dynamically built by the measurement and testing software program (e.g., when the program is started by a user).
- each report from the list is processed by the data acquisition/processing device 104 .
- decision block 906 it is determined whether the particular report that is being processed requires a specific test result type or condition. If the particular report being processed does not require a specific test result type or condition, then, in step 912 , the report is added to the subject (patient) information icon 804 in FIGS. 21 and 22 .
- the Patient Information report 808 , 808 ′ is always generated by the measurement and testing software program, and displayed under the subject (patient) information icon 804 .
- an exemplary Patient Information report 808 , 808 ′ comprises background information regarding the patient, such as height, weight, home address, contact information, name of physician, etc. Because the Patient Information report 808 , 808 ′ contains general information about the subject or patient that is not specific to any particular test, there is no need to apply a filter to this report. Conversely, if it is determined in decision block 906 that the particular report being processed does require a specific test result type to be present or a condition to be satisfied, then, in step 908 , the requisite specific test type(s) or condition(s) are checked (i.e., conditions such as the data range, etc.).
- a data range condition may stipulate that a particular report may only be displayed when test results exist for a predetermined date range (e.g., from May 4th to May 11th).
- a predetermined date range e.g., from May 4th to May 11th.
- the use of conditions allows the measurement and testing software program to filter the reports that are displayed under subject (patient) information icon 804 .
- each report file informs the system 100 of what it wants or needs.
- This starts out with a list of test GUIDs e.g., BESS assessment test
- test GUIDs e.g., BESS assessment test
- the report is shown only if all of test GUIDs contained in this list exist in the overall list of test results that the subject or patient has performed. For example, suppose the report file comprises the following lines of code:
- the measurement and testing software program preferably has the following additional flags that determine how the above lists (i.e., conditions) are used: (i) tests must be in the same session, and (ii) tests must be in the same day. If it is true that the tests must be in the same session, then the abovedescribed three filtering lists (i.e., filtering conditions) are applied only to groups of test results that occur within the same session (a collection of test results that were performed logically together). For example, suppose that the above three rules state that both BESS and LOS are required (i.e., must-haves), then the report is only shown if both the Balance Error Scoring System (BESS) and Limits of Stability (LOS) test results are available in the same session.
- BESS Balance Error Scoring System
- LOS Limits of Stability
- the report is not available. If it is true that the tests must be in the same day, then the abovedescribed three filtering lists are applied only to groups of test results that occur within the same calendar day—this implies same session, but can be separate sessions in the same day. For example, suppose that the above three rules state that both BESS and LOS are required (i.e., must-haves), then the report is only shown if both BESS and LOS results are available in the same day. If BESS was done on one day, and LOS on another day, then the report is not available.
- the reports could be filtered in accordance with numerical values that are contained within the test results themselves.
- a particular report could be displayed only when a subject's score for a particular test exceeds a certain predetermined value (e.g., when a subject's score is 50 or greater).
- one or more reports could require two or more sessions of test results to exist before being displayed (e.g., results from BESS tests performed in two or more sessions).
- the conditions described above could be combined with another (e.g., a particular report could only be displayed if test results for both a BESS test and Tandem Walk test exist but not those for a mCTSIB test.
- step 910 it is determined whether the condition is satisfied (i.e., one of the conditions described above). If the condition is satisfied, then, in step 912 , the report is added to the subject (patient) information icon 804 in FIGS. 21 and 22 . However, if the condition is not satisfied, then the process proceeds to step 914 , wherein it is determined if there are additional reports from the list to process. If there are not additional reports from the list to process, the process ends at step 918 (see FIG. 25 ). However, if there are additional reports from the list to process, the process proceeds to step 916 , wherein the data acquisition/processing device 104 continues to the next report from the list. As shown in FIGS.
- step 916 the process reverts back to step 904 in which the next report from the list is processed. It is to be understood that the procedure illustrated in FIGS. 24 and 25 will continue in the manner described above until all of the reports from the list have been processed.
- the measurement and testing software program does not generate any empty global/progress reports (i.e., global/progress reports that do not contain any numerical test results).
- the data acquisition/data processing device 104 of the measurement and testing system 100 is configured and arranged to automatically filter the tests that are available in accordance with the type of measurement assembly or assemblies 102 that are connected to the data acquisition/data processing device 104 .
- the data acquisition and processing device 104 is configured and arranged to (i) assemble a list of tests that are capable of being performed utilizing the at least one measurement assembly 102 ; (ii) determine, for each of the tests in the list, whether the execution of each particular test in the list requires the use of a specific measurement assembly and/or requires that a predetermined condition be satisfied (i.e., requires the use of a specific measurement assembly, or that a predetermined condition be satisfied, or both the use of a specific measurement assembly and that a predetermined condition be satisfied); (iii) when it is determined that the execution of the particular test in the list requires the use of a specific measurement assembly and/or requires that a predetermined condition be satisfied, determine whether the at least one measurement assembly 102 comprises the specific measurement assembly that is required and/or whether the predetermined condition has been satisfied; and (iv) when it is determined that the at least one measurement assembly is the specific measurement assembly that is required and/or the predetermined condition has been satisfied
- the data acquisition/data processing device 104 of the measurement and testing system 100 is configured and arranged to generate a screen image 1000 that includes a plurality of mode selection tabs 1002 , 1004 , and 1006 .
- a plurality of test icons 1008 - 1016 are displayed on the visual display device 130 . As shown in the screenshot of FIG.
- these test icons include a first icon 1008 for a Limits of Stability (LOS) test, a second icon 1010 for a Rhythmic Weight Shift test, a third icon 1012 for a Unilateral Stance test, a fourth icon 1014 for a Weight Bearing Squat test, and a fifth icon 1016 for a mCTSIB test.
- LOS Limits of Stability
- a user merely selects the appropriate test icon (e.g., by clicking on one of the icons 1008 - 1016 ).
- this group of tests is displayed.
- the first type of measurement assembly 102 may comprise a dual force plate assembly having a particular footprint (e.g., a static dual force plate having a 18′′ ⁇ 20′′ overall footprint).
- the test icons 1008 - 1016 in FIG. 26 represent the tests that are capable of being effectively performed using the first type of measurement assembly 102 .
- the tests that are not capable of being performed using the first type of measurement assembly 102 are filtered out by the measurement and testing software program so they are not displayed on the visual display device 130 , and thus, are not available for selection by a system user when the first type of measurement assembly 102 is connected.
- a particular test may require a measurement assembly 102 that has a minimum footprint size (i.e., dimensional area).
- a measurement assembly 102 having a footprint size that is smaller than the minimum footprint size is the only one connected to the data acquisition/data processing device 104 , the tests requiring the minimum footprint size would not be displayed on the visual display device 130 .
- a particular test may require the measurement assembly to have dynamic functionality (e.g., the measurement assembly 102 comprises a force plate that is rotated, or translated, or both rotated and translated). Consequently, if a measurement assembly 102 which does not have the requisite dynamic functionality is the only one connected to the data acquisition/data processing device 104 , the tests requiring the dynamic functionality would not be displayed on the visual display device 130 .
- FIG. 27 Another exemplary screenshot 1000 ′ is depicted in FIG. 27 . Similar to the screenshot 1000 illustrated in FIG. 26 , the screenshot 1000 ′ of FIG. 27 includes a plurality of mode selection tabs 1002 , 1004 , and 1006 . However, when a user selects the Assessments tab 1004 , a greater number of test icons 1008 - 1028 are displayed on the visual display device 130 , as compared to that displayed in the screenshot of FIG. 26 . As shown in the screenshot of FIG.
- the test icons include an icon 1008 for a Limits of Stability (LOS) test, an icon 1010 for a Rhythmic Weight Shift test, an icon 1012 for a Unilateral Stance test, an icon 1014 for a Weight Bearing Squat test, an icon 1016 for a mCTSIB test, an icon 1018 for a Forward Lunge test, an icon 1020 for a Sit to Stand test, an icon 1022 for a Step, Quick Turn test, an icon 1024 for a Step Up, Over test, an icon 1026 for a Tandem Walk test, and an icon 1028 for a Walk Across test.
- LOS Limits of Stability
- 1010 for a Rhythmic Weight Shift test
- an icon 1012 for a Unilateral Stance test
- an icon 1014 for a Weight Bearing Squat test an icon 1016 for a mCTSIB test
- an icon 1018 for a Forward Lunge test an icon 1020 for a Sit to Stand test
- the second type of measurement assembly 1402 , 1404 may comprise a dual force plate assembly having an overall footprint that is larger than the first type of measurement assembly (e.g., a static dual force plate having 20′′ ⁇ 60′′ overall footprint).
- the tests that are capable of being effectively performed using the second type of measurement assembly 1402 , 1404 are filtered out by the measurement and testing software program so they are not displayed on the visual display device 130 , and thus, are not available for selection by a system user when the second type of measurement assembly 1402 , 1404 is connected.
- FIG. 28 yet another exemplary screenshot 1000 ′′ is shown Like the screenshots 1000 , 1000 ′ illustrated in FIGS. 26 and 27 , the screenshot 1000 ′′ of FIG. 28 includes a plurality of mode selection tabs 1002 , 1004 , and 1006 . However, when a user selects the Assessments tab 1004 , a different group of test icons 1008 - 1016 and 1030 - 1034 are displayed on the visual display device 130 , as compared to that displayed in the screenshots of FIGS. 26 and 27 . As shown in the screenshot of FIG.
- the test icons include an icon 1008 for a Limits of Stability (LOS) test, an icon 1010 for a Rhythmic Weight Shift test, an icon 1012 for a Unilateral Stance test, an icon 1014 for a Weight Bearing Squat test, an icon 1016 for a mCTSIB test, an icon 1030 for an Adaption Test, an icon 1032 for a Motor Control Test, and an icon 1034 for a Sensory Organization Test (SOT).
- LOS Limits of Stability
- 1010 for a Rhythmic Weight Shift test
- an icon 1012 for a Unilateral Stance test
- an icon 1014 for a Weight Bearing Squat test an icon 1016 for a mCTSIB test
- an icon 1030 for an Adaption Test an icon 1032 for a Motor Control Test
- an icon 1034 for a Sensory Organization Test SOT
- the third type of measurement assembly may comprise a dynamic force plate assembly, wherein a dual force plate is capable of being rotated, translated, or both rotated and translated while a subject or patient is disposed thereon.
- the dynamic force plate assembly may have a dual force plate that has a footprint similar to the first type of measurement assembly 102 (e.g., a dual force plate having a 18′′ ⁇ 20′′ overall footprint).
- the tests that are capable of being effectively performed using the third type of measurement assembly i.e., the dynamic force measurement assembly.
- the tests that are not capable of being performed using the third type of measurement assembly are filtered out by the measurement and testing software program so they are not displayed on the visual display device 130 , and thus, are not available for selection by a system user when the third type of measurement assembly is connected.
- FIG. 29 still another exemplary screenshot 1000 ′′′ is illustrated.
- the screenshot 1000 ′′′ of FIG. 29 includes a plurality of mode selection tabs 1002 , 1004 , and 1006 .
- a larger group of test icons 1008 - 1034 are displayed on the visual display device 130 , as compared to that displayed in the screenshots of FIGS. 26-28 .
- the screenshot of FIG. 29 shows that a user selects the Assessments tab 1004 .
- the test icons include an icon 1008 for a Limits of Stability (LOS) test, an icon 1010 for a Rhythmic Weight Shift test, an icon 1012 for a Unilateral Stance test, an icon 1014 for a Weight Bearing Squat test, an icon 1016 for a mCTSIB test, an icon 1018 for a Forward Lunge test, an icon 1020 for a Sit to Stand test, an icon 1022 for a Step, Quick Turn test, an icon 1024 for a Step Up, Over test, an icon 1026 for a Tandem Walk test, and an icon 1028 for a Walk Across test, an icon 1030 for an Adaption Test, an icon 1032 for a Motor Control Test, and an icon 1034 for a Sensory Organization Test (SOT).
- LOS Limits of Stability
- 1010 for a Rhythmic Weight Shift test
- an icon 1012 for a Unilateral Stance test
- an icon 1014 for a Weight Bearing Squat test an icon 1016 for
- test icons 1008 - 1034 depicted in the screenshot of FIG. 29 are representative of the combined set of tests that are available when both the static dual force plate with a 20′′ ⁇ 60′′ overall footprint, and the dynamic force plate assembly, are both operatively coupled to the data acquisition/data processing device 104 .
- the test icons 1008 - 1034 in FIG. 29 are representative of the combined set of tests that are available when both the static dual force plate with a 20′′ ⁇ 60′′ overall footprint, and the dynamic force plate assembly, are both operatively coupled to the data acquisition/data processing device 104 .
- the tests that are capable of being effectively performed using at least one of the second and third types of measurement assemblies i.e., at least one of the 20′′ ⁇ 60′′ static dual force plate 1402 , 1404 and the dynamic force measurement assembly.
- the tests that are not capable of being performed using one of these two types of measurement assemblies are filtered out by the measurement and testing software program so they are not displayed on the visual display device 130 , and thus, are not available for selection by a system user when these measurement assemblies are connected.
- the data acquisition/data processing device 104 When a measurement assembly (e.g., 102 ) is initially connected to the data acquisition/data processing device 104 , the data acquisition/data processing device 104 reads the serial number from the firmware installed on the measurement assembly 102 . If the serial number from the measurement assembly 102 is recognized by the data acquisition/data processing device 104 , the measurement and testing software program automatically filters the tests that are displayed on the visual display device 130 in accordance with the type of device that is connected (e.g., if a particular serial number is already is associated with a 20′′ ⁇ 60′′ static dual force plate, and this is the only plate in the system 100 , then the measurement and testing software program automatically filters out all of the tests that cannot be performed on this plate).
- the type of device e.g., if a particular serial number is already is associated with a 20′′ ⁇ 60′′ static dual force plate, and this is the only plate in the system 100 , then the measurement and testing software program automatically filters out all of the tests that cannot be performed on this plate).
- the data acquisition/data processing device 104 generates the pop-up window 1036 illustrated in FIG. 30 .
- the pop-up window 1036 prompts the system user to manually select the type of measurement assembly 102 that is connected to the data acquisition/data processing device 104 by clicking on the appropriate one of the plate icons 1038 , 1040 , or 1042 , and then, by pressing the “OK” button 1044 to complete his or her selection.
- the data acquisition/data processing device 104 equates the serial number of the connected device to the type of measurement assembly 102 that is operatively coupled to the data acquisition/data processing device 104 (e.g., Serial No. 67899882 is a 18′′ ⁇ 20′′ Essential force plate assembly because a user selected the Essential force plate icon 1040 in the pop-up window 1036 ).
- the pop-up window 1036 will not be subsequently displayed to the system user. Rather, after reading the recognized serial number from the firmware installed on the measurement assembly 102 , the measurement and testing software program automatically filters the tests that are available for the connected device.
- the data acquisition/data processing device 104 is specially programmed to automatically determine the type of the device by reading the force plate dimensional data from the firmware installed on the measurement assembly 102 (e.g., an 18′′ ⁇ 20′′ footprint of the force plate assembly is embedded in the firmware).
- the data acquisition/data processing device 104 is further configured to equate the dimensional data with a particular plate type (e.g., the data acquisition/data processing device 104 references tabular data that equates this dimensional data with an Essential-type force plate).
- the data acquisition/data processing device 104 references tabular data that equates this dimensional data with an Essential-type force plate.
- the data acquisition/data processing device 104 is configured and arranged to generate the pop-up window 1048 illustrated in FIG. 31 , which requires a user to select the type of device (i.e., force plate) that he or she wishes to use for the test.
- the user selects the radio button that is next to the desired device (e.g., radio button 1050 for a Dynamic force plate assembly with a displaceable force plate or radio button 1052 for a Functional static force plate with a 20′′ ⁇ 60′′ overall footprint).
- the desired device e.g., radio button 1050 for a Dynamic force plate assembly with a displaceable force plate or radio button 1052 for a Functional static force plate with a 20′′ ⁇ 60′′ overall footprint.
- the user presses the “OK” button 1054 to complete his or her selection.
- the user inadvertently selected the incorrect radio button 1050 or 1052 , he or she can always revise the selection by pressing the “Cancel” button 1056 .
- the user can then proceed with performing the desired test.
- FIGS. 32 and 33 a flowchart illustrating the functionality of the device test filter feature of the measurement and testing system 100 is set forth in FIGS. 32 and 33 . All of the steps described below with reference to the flowcharts of FIGS. 32 and 33 are carried out by the data acquisition/processing device 104 .
- the procedure commences at 1100 , and in step 1102 , device (i.e., measurement assembly 102 ) attachment or removal is detected during the startup of the measurement and testing software program. That is, the data acquisition/processing device 104 reads the serial number of the device (e.g., a known or recognized measurement assembly 102 ) that is connected from the firmware of the device.
- step 1104 a list of the available tests are assembled by the data acquisition/processing device 104 (e.g., by reading a database list or a list of test files). Beginning with step 1106 in FIG. 32 , each test from the list is processed by the data acquisition/processing device 104 . Initially, at decision block 1108 , it is determined whether the particular test that is being processed requires a specific type of device (i.e., type of measurement assembly 102 ) and/or whether it requires a certain condition to be satisfied.
- a specific type of device i.e., type of measurement assembly 102
- the test icon is added to the visual display of available tests that the user may select (e.g., as illustrated under the Assessments tab 1004 in FIGS. 26-29 ).
- the Limits of Stability (LOS) test the Rhythmic Weight Shift test, the Unilateral Stance test, and the Weight Bearing Squat test are always available regardless of the type of device that is connected to the data acquisition/processing device 104 , and thus, are always displayed under the Assessments tab 1004 in FIGS. 26-29 . As such, these tests do not require any type of filtering.
- the requisite device type is evaluated or the requisite condition(s) is checked (i.e., conditions such as the size of the force plate, device capabilities, etc.).
- a particular test may require a force plate with a minimum footprint (i.e., a minimum plate surface area) so that the subject or patient has adequate room to perform the test protocol (e.g., Forward Lunge test or Step Up, Over test).
- a certain test may require that the device is capable of displacing the force plate surface with the patient or subject disposed thereon while the test is being executed (e.g., Adaption Test, Motor Control Test, or Sensory Organization Test (SOT)).
- SOT Sensory Organization Test
- the use of conditions allows the measurement and testing software program to automatically filter the tests that cannot be effectively performed with the device or devices (i.e., measurement assembly or assemblies 102 ) that are connected to the data acquisition/processing device 104 .
- step 1112 it is determined whether the condition is satisfied (e.g., one of the exemplary conditions described above). If the condition is satisfied, then, in step 1114 , the test icon is added to the visual display of available tests that the user may select (e.g., as illustrated under the Assessments tab 1004 in FIGS. 26-29 ). However, if the condition is not satisfied, then the process proceeds to step 1116 , wherein it is determined if there are additional tests from the list to process. If there are not additional tests from the list to process, the process ends at step 1120 .
- the condition e.g., one of the exemplary conditions described above.
- step 1118 the data acquisition/processing device 104 continues to the next test from the list.
- step 1118 the process reverts back to step 1106 in which the next test from the list is processed. It is to be understood that the procedure illustrated in FIGS. 32 and 33 will continue in the manner described above until all of the tests from the list have been processed.
- the measurement and testing software program only permits a system user to select tests that can be effectively performed with the type of device (i.e., measurement assembly 102 ) that is connected to the data acquisition/processing device 104 (all other tests are filtered out by the abovedescribed process).
- the measurement and testing system 100 only permits a system user to select tests that can be effectively performed with the type of device (i.e., measurement assembly 102 ) that is connected to the data acquisition/processing device 104 (all other tests are filtered out by the abovedescribed process).
- inaccurate test results resulting from the use of an improper device are thereby automatically prevented by the measurement and testing system 100 .
- the data acquisition/data processing device 104 is configured and arranged to mathematically combine the output for a plurality of measurement assemblies 1402 , 1404 —see FIGS. 36 and 37 (e.g., for a plurality of force plates) so as to create a virtual measurement assembly (e.g., a virtual force plate).
- the data acquisition/data processing device 104 is configured and arranged to automatically correct the local coordinate system of one of the measurement assemblies 102 (e.g., one of the plurality of force plates) in order to account for the actual orientation of the measurement assembly 102 (e.g., force plate) relative to the other measurement assembly 102 (e.g., force plate).
- two measurement assemblies 102 e.g., force plates
- two measurement assemblies 102 are placed in an end-to-end arrangement, wherein one of the two force plates is rotated 180 degrees relative to the other of the two force plates.
- FIG. 34 a flowchart illustrating the functionality of the virtual measurement assembly feature of the measurement and testing system 100 is set forth in FIG. 34 . All of the steps described below with reference to the flowchart of FIG. 34 are carried out by the data acquisition/processing device 104 .
- the procedure commences at 1200 , and in step 1202 , collected data from a plurality of measurement assemblies or devices 102 (e.g., a plurality of force plates) is processed by the data acquisition/processing device 104 .
- two measurement assemblies 102 e.g., force plates
- the data acquisition/data processing device 104 receives a plurality of voltage signals (i.e., a plurality of channels of data) from the two measurement assemblies 102 , it initially transforms the signals into output force and moment components by multiplying the voltage signals by a calibration matrix.
- a plurality of voltage signals i.e., a plurality of channels of data
- the voltage output signals received from the first force plate assembly are transformed into the vertical force component F ZL1 exerted on the left plate of the assembly by the left foot of the subject, the vertical force component F ZR1 exerted on the right plate of the assembly by the right foot of the subject, the moment component about the x axis M XL1 exerted on the left plate of the assembly by the left foot of the subject, the moment component about the x axis M XR1 exerted on the right plate of the assembly by the right foot of the subject, the moment component about the y axis M YL1 exerted on the left plate of the assembly by the left foot of the subject, and the moment component about the y axis M YR1 exerted on the right plate of the assembly by the right foot of the subject.
- the voltage output signals received from the second force plate assembly are transformed into the vertical force component F ZL2 exerted on the left plate of the assembly by the left foot of the subject, the vertical force component F ZR2 exerted on the right plate of the assembly by the right foot of the subject, the moment component about the x axis M XL2 exerted on the left plate of the assembly by the left foot of the subject, the moment component about the x axis M XR2 exerted on the right plate of the assembly by the right foot of the subject, the moment component about the y axis M YL2 exerted on the left plate of the assembly by the left foot of the subject, and the moment component about the y axis M YR2 exerted on the right plate of the assembly by the right foot of the subject.
- the current subject or patient test wants or requires the two measurement assemblies 102 (e.g., force plates) to be combined as one virtual measurement assembly (e.g., one virtual force plate). If the particular test that is being performed does not want or require the two measurement assemblies 102 (e.g., force plates) to be combined as one virtual measurement assembly, the resultant separate force and moment components (F ZL1 , F ZR1 , M XL1 , M XR1 , M YL1 , M YR1 , F ZL2 , F ZR2 , M XL2 , M XR2 , M YL2 , M YR2 ) are returned in step 1210 .
- the resultant separate force and moment components F ZL1 , F ZR1 , M XL1 , M XR1 , M YL1 , M YR1 , F ZL2 , F ZR2 , M XL2 , M XR2 , M
- the separate force and moment components (F ZL1 , F ZR2 , M XL2 , M XR2 , M YL2 , M YR2 ) for the second, rotated measurement assembly 102 are corrected in order to account for the actual orientation of the measurement assembly 102 (e.g., force plate) relative to the other measurement assembly 102 (e.g., force plate), as described hereinafter.
- the output signals are summed from both of the measurement assemblies 1402 , 1404 (e.g., force plates) into a synthetic channel in step 1206 , using matrix rotation to correct for the actual orientation of the second, rotated measurement assembly 1404 (e.g., force plate).
- the first force plate 1402 which is typically the force plate disposed closest to the data acquisition/processing device 104 and the operator visual display device 130 , is disposed in a standard, non-rotated position.
- the second force plate 1404 which is typically the force plate disposed furthest from the data acquisition/processing device 104 and the operator visual display device 130 , is disposed in a non-standard, rotated position (i.e., the second force plate 1404 is rotated 180 degrees relative to the first force plate 1402 ).
- the left and right vertical force components F ZL2 , F ZR2 must be swapped, the left and right moment components about the x axis M XL2 , M XR2 must be swapped, and the left and right moment components about the y axis M YL2 , M YR2 must be swapped.
- the sign of the left and right moment components about the x axis M XL2 , M XR2 must be flipped (e.g., ⁇ 1 becomes +1), and the sign of the left and right moment components about the y axis M YL2 , M YR2 must be flipped (e.g., ⁇ 1 becomes +1).
- This sign change in the moment components M XL1 , M XR2 , M YL2 , M YR2 for the second force plate 1404 can be generally explained with reference to the following rotation matrix:
- the manner in which the output signals from the individual force plates 1402 , 1404 are summed in order to obtain the overall output values for the single virtual force plate 1400 with left and right measurement surfaces 1406 , 1408 will be described (see FIG. 36 ).
- the origin of the absolute coordinates axes 1412 , 1414 , 1416 for the left measurement surface 1406 is disposed between the two force plates 1402 , 1404 , and is centered in a lateral direction on the virtual left plate surface.
- FIG. 36 the origin of the absolute coordinates axes 1412 , 1414 , 1416 for the left measurement surface 1406 is disposed between the two force plates 1402 , 1404 , and is centered in a lateral direction on the virtual left plate surface.
- the origin of the absolute coordinates axes 1418 , 1420 , 1422 for the right measurement surface 1408 is disposed between the two force plates 1402 , 1404 , and is centered in a lateral direction on the virtual right plate surface.
- M XL — VP M XL1 +( F ZL1 ⁇ d )+( M XR2 )+( F ZR2 ⁇ d ) (6)
- M XR — VP M XR1 +( F ZR1 ⁇ d )+( ⁇ M XL2 )+( F ZL2 ⁇ d ) (7)
- the parenthetical terms containing the distance value d are required in order to correct for the shifted position of the coordinate axes of the virtual force plate surfaces. Because the virtual plate coordinate axes (i.e., left surface coordinates axes 1412 , 1414 , 1416 and right surface coordinate axes 1418 , 1420 , 1422 —see FIG. 36 ) are located between the first and second plates, rather than in the middle of the respective first and second plates, the computed values for the moment components about the x-axis must adjusted accordingly. In particular, as shown in FIG.
- the origin of the local coordinate axes 1424 , 1426 , 1428 for the left plate surface of the first force plate 1402 is disposed in the center thereof, while the origin of the local coordinate axes 1430 , 1432 , 1434 for the right plate surface of the first force plate 1402 is disposed in the center thereof.
- the second force plate 1404 is rotated 180 degrees relative to the first force plate 1402 . Consequently, the physical left and right measurement surfaces of the second force plate 1404 are flipped relative to the first force plate 1402 .
- the origin of the local coordinate axes 1436 , 1438 , 1440 for the left plate surface of the second force plate 1404 is disposed in the center thereof, while the origin of the local origin of the coordinate axes 1442 , 1444 , 1446 for the right plate surface of the second force plate 1404 is disposed in the center thereof.
- the x and y axes ( 1436 , 1438 and 1442 , 1444 ) of the left and right measurement surfaces, respectively must be rotated by the angle ⁇ (i.e., 180 degrees) such that respective corrected x′ and y′ axes ( 1437 , 1439 and 1443 , 1445 ) are obtained.
- the parenthetical terms containing the distance value d in equations (6) and (7) transform the plate output values measured in accordance with the local coordinate systems of the left and right plate surfaces of each force plate 1402 , 1404 into output values based upon the absolute left and right coordinate systems disposed between the two forces plates 1402 , 1404 (see FIG. 36 ).
- the overall moment component about the x-axis M X — VP in equation (8) is defined relative to the absolute coordinate axes 1450 , 1452 , 1454 in FIG. 37 .
- the moments acting thereon are defined relative to the local coordinate axes 1456 , 1458 , 1460 in FIG. 37 .
- the moments acting thereon are defined relative to the local coordinate axes 1462 , 1464 , 1466 in FIG. 37 (with the corrected, rotated coordinate axes 1463 , 1465 shown using dashed lines).
- M YL — VP M YL1 +( M YR2 ) (9)
- M YR — VP M YR1 +( M YL2 ) (10)
- the center of pressure of the vertical force can be computed as follows:
- step 1206 after the output signals (i.e., channels) from both measurement assemblies 1402 , 1404 (e.g., force plates) are summed in step 1206 , the number of recorded channels from multiple devices (e.g., multiple measurement assemblies 1402 , 1404 in the form of force plates) are reduced to a single device (e.g., a single measurement assembly in the form of a virtual force plate) in step 1208 .
- the final computed result e.g., the overall vertical force and moment components F Z — VP , M X — VP , M Y — Vp
- the process ends at step 1212 .
- the data acquisition/data processing device 104 In order to execute the calculations described above in equations (1)-(13), the data acquisition/data processing device 104 must be able to identify each of the two measurement assemblies 1402 , 1404 that are connected thereto (i.e., the data acquisition/data processing device 104 must be able to distinguish the first force plate from the second force plate). If the data acquisition/data processing device 104 is not able to differentiate between the first and second force plates (e.g., because this is the first time that the first and second force plates have ever been connected to the data acquisition/data processing device 104 ), the data acquisition/data processing device 104 generates the pop-up window 1300 illustrated in FIG. 35 .
- the pop-up window 1300 prompts the system user to manually select the force plate 1304 that is located furthest away from the operator computer system 1306 by standing on the surface of the force plate 1304 .
- the data acquisition/data processing device 104 detects a positive weight in excess of a set value (e.g., 1 Newton) for a predetermined number of seconds (e.g., 2 seconds).
- a positive weight in excess of a set value e.g., 1 Newton
- a predetermined number of seconds e.g. 2 seconds
- the data acquisition/data processing device 104 designates the force plates 1302 , 1304 as the first and second force plates, respectively, for the purpose of the calculations described above in equations (1)-(13).
- the matrix rotation calculations explained above are performed on the output values from the second force plate 1304 in order to compensate for its rotated position.
- the furthest force plate 1304 has been configured as the second force plate 1304 by the data acquisition/data processing device 104 (e.g., by equating its serial number with the second force plate designation)
- the pop-up window 1300 will not be subsequently displayed to the system user when the system user utilizes the measurement and testing software program at a later date or time.
- the embodiments of the measurement and testing system 100 described above offer numerous advantages and benefits.
- the measurement and testing system 100 discussed herein employs inventive filtering techniques in order to create a single, easily understandable report from data acquired on a plurality of different dates, thereby facilitating the analysis of the data by a user of the system.
- the measurement and testing system 100 includes a data acquisition and processing device which is specially programmed to automatically regulate the availability of tests in accordance with the type of measurement assembly or assemblies that is being utilized in the measurement system by filtering the tests that cannot be executed properly on a particular measurement assembly or assemblies.
- the measurement and testing system 100 has a data acquisition and processing device which is specially programmed to create one or more virtual measurement assemblies from a plurality of physical measurement assemblies that are operatively coupled thereto in different orientations, such that the system is capable of having a large measurement surface area, while still being readily portable.
Abstract
Description
-
- <!REPORTXML name=“Standing Stability Report” type=“TestReport”
- testobject=“BalanceTests.NSEO”
- testobject=“BalanceTests.NSEC”
- testobject=“BalanceTests.PSEO”
- testobject=“BalanceTests.PSEC”
- reportcombines=“*testobject*” reportcombinedtitle=“Standing Stability”>
-
- file #1: the test file:
- <!TESTXML name=“Limits of Stability” type=“Assessment” testobject=“#LimitsOfStability”>
- file #2: the report file:
- <!REPORTXML name=“Limits of Stability” type=“Assessment”
- testobject=“#LimitsOfStability” reportcombines=“*testobject*” reportcombinedtitle=“Limits of Stability”>
- file #3: the patient screen file:
- <!PATIENTTESTXML name=“Limits of Stability” type=“Assessment” testobject=“#LimitsOfStability”>
In the above example, the “test file” (i.e., file #1) determines the content on the operatorvisual display device 130, the “report file” (i.e., file #2) determines how the results of the tests are presented to a user, while the “patient screen file” (i.e., file #3) determines the content on the subjectvisual display device 106. The entries ‘testobject=“#LimitsOfStability” ’ in the above files call up a subroutine for performing additional functionality (e.g., acting as a plug-in). In this example, a record with an associated record identifier (e.g., a number) is placed in a master database listing of tests, wherein the record indicates that the LimitsOfStability test is called “Limits of Stability” and is an “Assessment” type of test (as opposed to, for example, a “Training” or “Diagnostic” test. In other words, the “Limits of Stability” test would be entered under the “Assessments”tab 406 inFIG. 16 . The record identifier in the master database listing of tests will then be used to locate the test file and test result processing code, as needed later on. The fields above, e.g., the name, type, test object, report title, and what the report combines, etc., are all stored in an internal object in the database. The end result being that there are three collections of data, which include: (i) a report collection, (ii) a test collection, and (iii) an optional patient screen collection. If the test does not have a matching patient screen, then it will default to using the existing test file (i.e., the patient screen will match the test screen on the operator visual display device 130). In addition, certain keywords such as “grouping” can be used to organize the tests into a visual collection of similar items, whereas keywords such as “package” and “series” can be used to define a predetermined series of tests that can be called up by the user by name. Also, tests that contain options, which may be set by a user, can additionally have an “option” keyword with additional text fields that determine the content of the options. Moreover, any other keywords can be processed by thesystem 100 as expansion needs arise.
-
- list=report:: mustHaveTheseGuids( )
- if (list is not empty)
- then
- if (resultsTestGuids contains all values in list)
- then
- return true # this will indicate do show report
- else
- return false # this will indicate do not show report
In the above example, if the file, entitled resultsTestGuids, contains all of the GUID values in the list, then the report will be shown. However, if the file, entitled resultsTestGuids, does not contain all of the GUID values in the list, then the report will not be shown. For example, for a particular report to be displayed, it may be required that results from both a Limits of Stability (LOS) test and a Forward Lunge test are available. In the Must Not Have List, the report is not shown if one or more of these test GUIDs contained in this list exist in the overall list of test results that the subject or patient has performed. For example, suppose the report file comprises the following lines of code:
- return false # this will indicate do not show report
- list=report::mustNOThaveTheseGuids( )
- if (list is not empty)
- then
- if (resultsTestGuids contains any value in list)
- then
- return false # this will indicate do not show report
In the above example, if the file, entitled resultsTestGuids, contains any of the GUID values in the list, then the report will not be shown. However, if the file, entitled resultsTestGuids, does not contain any of the GUID values in the list, then the report will be shown. For example, for a particular report to be displayed, it may be required that results for a Limits of Stability (LOS) test are not contained within the same session as results for a Forward Lunge test. In the Can Have List, the report is shown only if one or more of these Test GUIDs exist in the list of test results that the subject or patient has performed. For example, suppose the report file comprises the following lines of code:
- return false # this will indicate do not show report
- list=report::canHaveTheseGuids( )
- if (list is not empty)
- then
- if (resultsTestGuids contains any values in list)
- then
- return true # this will indicate do show report
- else
- return false # this will indicate do not show report
- return true # no list of anything, the report is always shown
In the above example, if the file, entitled resultsTestGuids, contains any of the GUID values in the list, then the report will be shown. However, if the file, entitled resultsTestGuids, does not contain any of the GUID values in the list, then the report will not be shown. If the file does not contain a list of anything, then the report is always shown (e.g., the Patient Information report). As one example, the results from a Limits of Stability (LOS) test could be combined with the results from a Standing Stability test in a single report. Considering the three exemplary conditions described above, the Must Not Have List trumps the other two conditions.
In equation (1), when the angle θ is equal to 180 degrees, then the rotation matrix R is equal to:
Thus, when the original values of the moment components MXL2, MXR2, MYL2, MYR2 are multiplied by a similar rotation matrix, wherein angle θ is equal to 180 degrees, the sign of the moment component values must be flipped.
F ZL
F ZR
-
- FZL1: vertical force component exerted on the surface of the first force plate by the left foot of the subject;
- FZR1: vertical force component exerted on the surface of the first force plate by the right foot of the subject;
- FZL2: vertical force component exerted on the surface of the second force plate by the right foot of the subject (left and right force component values are switched for the second plate, i.e., plate signal for FZL2 actually measures FZR2); and
- FZR2: vertical force component exerted on the surface of the second force plate by the left foot of the subject (left and right force component values are switched for the second plate, i.e., plate signal for FZR2 actually measures FZL2).
The overall vertical force FZ— VP for thevirtual force plate 1400 can be obtained from the following summation equation:
F Z— VP =F ZL—VP +F ZR— VP (5)
When the left and right vertical force components FZL— VP, FZR— VP are summed in equation (5), thevirtual force plate 1400 is considered to have a single measurement surface 1410 (seeFIG. 37 ), without distinguishing between the vertical forces exerted by left and right legs of the subject or patient.
M XL
M XR
-
- MZL1: moment component about the x-axis exerted on the surface of the first force plate by the left foot of the subject;
- MXR1: moment component about the x-axis exerted on the surface of the first force plate by the right foot of the subject;
- MXL2: moment component about the x-axis exerted on the surface of the second force plate by the right foot of the subject (left and right moment component values are switched for the second plate, i.e., plate signal for MXL2 actually measures MXR2);
- MXR2: moment component about the x-axis exerted on the surface of the second force plate by the left foot of the subject (left and right moment component values are switched for the second plate, i.e., plate signal for MXR2 actually measures MXL2); and
- d: distance (e.g., in meters) equal to one-half the length of the first force plate or one-half the length of the second force plate (illustrated
force plates FIG. 37 ).
M X
The overall moment component about the x-axis MX
M YL
M YR
-
- MYL1: moment component about the y-axis exerted on the surface of the first force plate by the left foot of the subject;
- MYR1: moment component about the y-axis exerted on the surface of the first force plate by the right foot of the subject;
- MYL2: moment component about the y-axis exerted on the surface of the second force plate by the right foot of the subject (left and right moment component values are switched for the second plate, i.e., plate signal for MYL2 actually measures MYR2); and
- MYR2: moment component about the y-axis exerted on the surface of the second force plate by the left foot of the subject (left and right moment component values are switched for the second plate, i.e., plate signal for MYR2 actually measures MYL2).
The overall moment component about the y-axis MY— VP for thevirtual force plate 1400 can be obtained from the following summation equation:
M Y— VP =M YL— VP +M YR— VP (11)
Similar to that described above for equation (8), the overall moment component about the y-axis MY— VP in equation (11) is defined relative to the absolute coordinateaxes FIG. 37 .
-
- xP
— VP, yP— VP: coordinates of the point of application for the vertical force (i.e., center of pressure) on the virtual force plate.
In addition, the data acquisition/data processing device 104 may also determine x and y values for the center-of-gravity (COG) of the subject or patient using the computed center of pressure (COP) values from equations (12) and (13). In one embodiment, the data acquisition/data processing device 104 converts the computed center of pressure (COP) to a center of gravity (COG) for the subject using a Butterworth filter. For example, in this embodiment, a second-order Butterworth filter with a 0.75 Hz cutoff frequency is used. In another embodiment, the center-of-gravity (COG) can be computed in the manner described in pending, commonly-owned U.S. patent application Ser. No. 14/015,535, the entire disclosure of which is incorporated herein by reference.
- xP
Claims (23)
Priority Applications (7)
| Application Number | Priority Date | Filing Date | Title |
|---|---|---|---|
| US14/042,332 US8902249B1 (en) | 2012-12-22 | 2013-09-30 | Measurement and testing system |
| US14/556,656 US9200897B1 (en) | 2012-12-22 | 2014-12-01 | Measurement and testing system |
| US14/953,505 US9829311B1 (en) | 2012-12-22 | 2015-11-30 | Force measurement system |
| US15/822,135 US10331324B1 (en) | 2012-12-22 | 2017-11-25 | Measurement and testing system |
| US16/450,377 US10803990B1 (en) | 2012-12-22 | 2019-06-24 | Measurement and testing system that includes a data processing device configured to synchronize a first plurality of data values with a second plurality of data values by determining which first timestamps correspond to which second timestamps and to interpolate values missing from the second values |
| US17/068,181 US11158422B1 (en) | 2012-12-22 | 2020-10-12 | Measurement and testing system that includes a data processing device configured to synchronize first and second signals by using time-delayed values or reconstructed values occurring coincident with a transition of a digital time reference signal |
| US17/509,838 US11705244B1 (en) | 2012-12-22 | 2021-10-25 | Force and/or motion measurement system that includes at least one camera and at least one data processing device configured to execute computer executable instructions for determining a position and/or movement |
Applications Claiming Priority (2)
| Application Number | Priority Date | Filing Date | Title |
|---|---|---|---|
| US13/726,065 US8643669B1 (en) | 2012-12-22 | 2012-12-22 | Measurement and testing system |
| US14/042,332 US8902249B1 (en) | 2012-12-22 | 2013-09-30 | Measurement and testing system |
Related Parent Applications (1)
| Application Number | Title | Priority Date | Filing Date |
|---|---|---|---|
| US13/726,065 Continuation-In-Part US8643669B1 (en) | 2012-12-22 | 2012-12-22 | Measurement and testing system |
Related Child Applications (1)
| Application Number | Title | Priority Date | Filing Date |
|---|---|---|---|
| US14/556,656 Continuation-In-Part US9200897B1 (en) | 2012-12-22 | 2014-12-01 | Measurement and testing system |
Publications (1)
| Publication Number | Publication Date |
|---|---|
| US8902249B1 true US8902249B1 (en) | 2014-12-02 |
Family
ID=51948403
Family Applications (1)
| Application Number | Title | Priority Date | Filing Date |
|---|---|---|---|
| US14/042,332 Active US8902249B1 (en) | 2012-12-22 | 2013-09-30 | Measurement and testing system |
Country Status (1)
| Country | Link |
|---|---|
| US (1) | US8902249B1 (en) |
Cited By (74)
| Publication number | Priority date | Publication date | Assignee | Title |
|---|---|---|---|---|
| US20140267296A1 (en) * | 2013-03-15 | 2014-09-18 | Fluke Corporation | Automated Combined Display of Measurement Data |
| US9066667B1 (en) | 2014-11-06 | 2015-06-30 | Bertec Corporation | System and method for testing dynamic visual acuity and/or gaze stabilization |
| US9168420B1 (en) | 2012-01-11 | 2015-10-27 | Bertec Corporation | Force measurement system |
| US9200897B1 (en) | 2012-12-22 | 2015-12-01 | Bertec Corporation | Measurement and testing system |
| US9277857B1 (en) | 2014-11-06 | 2016-03-08 | Bertec Corporation | System for testing and/or training the vision of a subject |
| USD755067S1 (en) | 2015-10-20 | 2016-05-03 | Bertec Corporation | Visual display device for a force and/or motion measurement system |
| US9404823B1 (en) | 2013-10-05 | 2016-08-02 | Bertec Limited | Load transducer and force measurement assembly using the same |
| US9414784B1 (en) | 2014-06-28 | 2016-08-16 | Bertec Limited | Movement assessment apparatus and a method for providing biofeedback using the same |
| US9517008B1 (en) | 2014-11-06 | 2016-12-13 | Bertec Corporation | System and method for testing the vision of a subject |
| US9526443B1 (en) | 2013-01-19 | 2016-12-27 | Bertec Corporation | Force and/or motion measurement system and a method of testing a subject |
| US9526451B1 (en) | 2012-01-11 | 2016-12-27 | Bertec Corporation | Force measurement system |
| US9568382B1 (en) | 2015-09-26 | 2017-02-14 | Bertec Corporation | Force measurement assembly with damping and force measurement system including the same |
| US9622686B1 (en) | 2016-04-09 | 2017-04-18 | Bertec Corporation | Gait perturbation system and a method for testing and/or training a subject using the same |
| US9763604B1 (en) | 2016-04-09 | 2017-09-19 | Bertec Corporation | Gait perturbation system and a method for testing and/or training a subject using the same |
| US9770203B1 (en) | 2013-01-19 | 2017-09-26 | Bertec Corporation | Force measurement system and a method of testing a subject |
| US9778119B2 (en) | 2013-10-05 | 2017-10-03 | Bertec Limited | Load transducer and force measurement assembly using the same |
| US9814430B1 (en) | 2015-04-17 | 2017-11-14 | Bertec Corporation | System and method for measuring eye movement and/or eye position and postural sway of a subject |
| US9829311B1 (en) | 2012-12-22 | 2017-11-28 | Bertec Corporation | Force measurement system |
| US9854997B1 (en) | 2015-11-07 | 2018-01-02 | Bertec Corporation | Force measurement system |
| US9916011B1 (en) | 2015-08-22 | 2018-03-13 | Bertec Corporation | Force measurement system that includes a force measurement assembly, a visual display device, and one or more data processing devices |
| US9927312B1 (en) | 2017-03-03 | 2018-03-27 | Bertec Corporation | Motion base for displacing a force measurement assembly |
| US10010286B1 (en) | 2013-01-19 | 2018-07-03 | Bertec Corporation | Force measurement system |
| US10085676B1 (en) | 2015-11-07 | 2018-10-02 | Bertec Corporation | Force measurement system |
| GB2561335A (en) * | 2017-02-26 | 2018-10-17 | Nmp Forcedecks Ltd | Force platform and method of operating |
| US10117602B1 (en) | 2016-04-09 | 2018-11-06 | Bertec Corporation | Balance and/or gait perturbation system and a method for testing and/or training a subject using the same |
| US10126186B2 (en) | 2013-10-05 | 2018-11-13 | Bertec Limited | Load transducer system configured to correct for measurement errors in the output forces and/or moments of the system |
| US10216262B1 (en) | 2015-08-22 | 2019-02-26 | Bertec Corporation | Force management system that includes a force measurement assembly, a visual display device, and one or more data processing devices |
| US10231662B1 (en) | 2013-01-19 | 2019-03-19 | Bertec Corporation | Force measurement system |
| US10264964B1 (en) | 2017-06-28 | 2019-04-23 | Bertec Corporation | Eye movement measurement device |
| US10331324B1 (en) | 2012-12-22 | 2019-06-25 | Bertec Corporation | Measurement and testing system |
| US10342473B1 (en) | 2015-04-17 | 2019-07-09 | Bertec Corporation | System and method for measuring eye movement and/or eye position and postural sway of a subject |
| US10390736B1 (en) | 2015-08-22 | 2019-08-27 | Bertec Corporation | Force measurement system that includes a force measurement assembly, at least one visual display device, and one or more data processing devices |
| US10413230B1 (en) | 2013-01-19 | 2019-09-17 | Bertec Corporation | Force measurement system |
| US10463250B1 (en) | 2017-06-28 | 2019-11-05 | Bertec Corporation | System and method for vision testing |
| US10527508B2 (en) | 2013-10-05 | 2020-01-07 | Bertec Limited | Force measurement system and a method of calibrating the same |
| US10555688B1 (en) | 2015-08-22 | 2020-02-11 | Bertec Corporation | Measurement system that includes at least one measurement assembly, a head-mounted visual display device, and a data processing device |
| US10646153B1 (en) | 2013-01-19 | 2020-05-12 | Bertec Corporation | Force measurement system |
| US10722114B1 (en) | 2017-06-28 | 2020-07-28 | Bertec Corporation | System and method for vision testing and/or training |
| US10736545B1 (en) | 2018-06-21 | 2020-08-11 | Bertec Corporation | Portable system for vestibular testing and/or training of a user |
| US10765936B2 (en) | 2013-10-05 | 2020-09-08 | Bertec Limited | Force measurement system |
| US10803990B1 (en) | 2012-12-22 | 2020-10-13 | Bertec Corporation | Measurement and testing system that includes a data processing device configured to synchronize a first plurality of data values with a second plurality of data values by determining which first timestamps correspond to which second timestamps and to interpolate values missing from the second values |
| US10853970B1 (en) | 2019-03-22 | 2020-12-01 | Bartec Corporation | System for estimating a three dimensional pose of one or more persons in a scene |
| US10856796B1 (en) | 2013-01-19 | 2020-12-08 | Bertec Corporation | Force measurement system |
| US10860843B1 (en) | 2015-08-22 | 2020-12-08 | Bertec Corporation | Measurement system that includes at least one measurement assembly, a head-mounted visual display device, and a data processing device |
| US10945599B1 (en) | 2017-06-28 | 2021-03-16 | Bertec Corporation | System and method for vision testing and/or training |
| CN112526418A (en) * | 2020-11-24 | 2021-03-19 | 上海辰光医疗科技股份有限公司 | Data recording and processing method for magnetic field homogeneity measurement of magnetic resonance imaging |
| US10966606B1 (en) | 2015-04-17 | 2021-04-06 | Bertec Corporation | System and method for measuring the head position and postural sway of a subject |
| US11033453B1 (en) | 2017-06-28 | 2021-06-15 | Bertec Corporation | Neurocognitive training system for improving visual motor responses |
| US11052288B1 (en) | 2013-01-19 | 2021-07-06 | Bertec Corporation | Force measurement system |
| US11054325B2 (en) | 2013-10-05 | 2021-07-06 | Bertec Limited | Force measurement system |
| US11074711B1 (en) | 2018-06-15 | 2021-07-27 | Bertec Corporation | System for estimating a pose of one or more persons in a scene |
| US11097154B1 (en) | 2019-10-11 | 2021-08-24 | Bertec Corporation | Swing analysis system |
| US11182924B1 (en) | 2019-03-22 | 2021-11-23 | Bertec Corporation | System for estimating a three dimensional pose of one or more persons in a scene |
| US11262231B1 (en) | 2020-05-29 | 2022-03-01 | Bertec Corporation | Swivel foot assembly for a force plate or balance plate |
| US11262258B2 (en) | 2013-10-05 | 2022-03-01 | Bertec Limited | Force measurement system |
| US11301045B1 (en) | 2015-08-22 | 2022-04-12 | Bertec Corporation | Measurement system that includes at least one measurement assembly, a visual display device, and at least one data processing device |
| US11311209B1 (en) | 2013-01-19 | 2022-04-26 | Bertec Corporation | Force measurement system and a motion base used therein |
| US11337606B1 (en) | 2017-06-28 | 2022-05-24 | Bertec Corporation | System for testing and/or training the vision of a user |
| US11348279B1 (en) | 2019-03-22 | 2022-05-31 | Bertec Corporation | System for estimating a three dimensional pose of one or more persons in a scene |
| US11458362B1 (en) | 2019-10-11 | 2022-10-04 | Bertec Corporation | Swing analysis system |
| US11521373B1 (en) | 2019-03-22 | 2022-12-06 | Bertec Corporation | System for estimating a three dimensional pose of one or more persons in a scene |
| US11604106B2 (en) | 2013-10-05 | 2023-03-14 | Bertec Limited | Force measurement assembly |
| US11631193B1 (en) | 2018-06-15 | 2023-04-18 | Bertec Corporation | System for estimating a pose of one or more persons in a scene |
| US11688139B1 (en) | 2019-03-22 | 2023-06-27 | Bertec Corporation | System for estimating a three dimensional pose of one or more persons in a scene |
| US11705244B1 (en) | 2012-12-22 | 2023-07-18 | Bertec Corporation | Force and/or motion measurement system that includes at least one camera and at least one data processing device configured to execute computer executable instructions for determining a position and/or movement |
| US11712162B1 (en) | 2017-06-28 | 2023-08-01 | Bertec Corporation | System for testing and/or training the vision of a user |
| US11790536B1 (en) | 2019-10-11 | 2023-10-17 | Bertec Corporation | Swing analysis system |
| US11798182B1 (en) | 2022-06-22 | 2023-10-24 | Bertec Corporation | System for training neural networks that predict the parameters of a human mesh model using dense depth and part-based UV map annotations |
| US11816258B1 (en) | 2022-10-13 | 2023-11-14 | Bertec Corporation | Head-mounted display system |
| US11826601B1 (en) | 2020-01-25 | 2023-11-28 | Bertec Corporation | Cable actuation system |
| US11850078B1 (en) | 2020-01-04 | 2023-12-26 | Bertec Corporation | Force measurement system |
| US11857331B1 (en) | 2013-01-19 | 2024-01-02 | Bertec Corporation | Force measurement system |
| US11865407B1 (en) | 2022-08-18 | 2024-01-09 | Bertec Corporation | Measurement and testing system |
| US11911147B1 (en) | 2020-01-04 | 2024-02-27 | Bertec Corporation | Body sway measurement system |
Citations (23)
| Publication number | Priority date | Publication date | Assignee | Title |
|---|---|---|---|---|
| US6038488A (en) | 1997-02-27 | 2000-03-14 | Bertec Corporation | Catheter simulation device |
| US6113237A (en) | 1999-12-06 | 2000-09-05 | Ober; Jan Krzysztof | Adaptable eye movement measurement device |
| US6152564A (en) | 1999-12-06 | 2000-11-28 | Bertec Corporation | Infrared eye movement measurement device |
| US6295878B1 (en) | 1999-12-13 | 2001-10-02 | Bertec Corporation | Particular strain gage orientation for a six component load measurement device |
| US6354155B1 (en) | 1999-06-02 | 2002-03-12 | Bertec Corporation | Multi-component force and moment measuring platform and load transducer |
| US20020057380A1 (en) | 2000-06-28 | 2002-05-16 | Pace Micro Technology Plc | Broadcast data receiver with dual tuning capability |
| US6389883B1 (en) | 1999-10-19 | 2002-05-21 | Bertec Corporation | Device, system, and method for measurement of balance, stability, and tremor |
| US20020178008A1 (en) | 2001-04-24 | 2002-11-28 | Microsoft Corporation | Method and system for applying input mode bias |
| US20030216656A1 (en) | 2002-05-17 | 2003-11-20 | Necip Berme | Method for analysis of abnormal body tremors |
| US20040127337A1 (en) | 1997-03-12 | 2004-07-01 | Nashner Lewis M. | Reducing errors in screening-test administration |
| US20040260427A1 (en) | 2003-04-08 | 2004-12-23 | William Wimsatt | Home automation contextual user interface |
| US20060265249A1 (en) | 2005-05-18 | 2006-11-23 | Howard Follis | Method, system, and computer-readable medium for providing a patient electronic medical record with an improved timeline |
| US7389144B1 (en) | 2003-11-07 | 2008-06-17 | Flint Hills Scientific Llc | Medical device failure detection and warning system |
| US20080183981A1 (en) | 2006-10-24 | 2008-07-31 | Pentax Corporation | Electronic endoscope |
| US20080228110A1 (en) | 2007-03-15 | 2008-09-18 | Necip Berme | Device for computerized dynamic posturography and a method for balance assessment |
| US20090251130A1 (en) | 2008-04-04 | 2009-10-08 | John Lund | Multimeter having communications via measurement terminals and communication system for same |
| US20110277562A1 (en) | 2010-05-14 | 2011-11-17 | Necip Berme | Low profile transducer with high moment capacity |
| US20120266648A1 (en) | 2011-04-20 | 2012-10-25 | Bertec Corporation | Force and/or Motion Measurement System Having Inertial Compensation and Method Thereof |
| US20120271565A1 (en) | 2011-04-20 | 2012-10-25 | Bertec Corporation | Force Measurement System Having Inertial Compensation |
| USD689389S1 (en) | 2013-04-12 | 2013-09-10 | Bertec Corporation | Dual force plate |
| USD689388S1 (en) | 2013-04-12 | 2013-09-10 | Bertec Corporation | Dual force plate |
| US8543540B1 (en) | 2012-05-09 | 2013-09-24 | Bertec Corporation | System and method for the merging of databases |
| US8544347B1 (en) | 2012-01-11 | 2013-10-01 | Bertec Corporation | Force measurement system having a plurality of measurement surfaces |
-
2013
- 2013-09-30 US US14/042,332 patent/US8902249B1/en active Active
Patent Citations (27)
| Publication number | Priority date | Publication date | Assignee | Title |
|---|---|---|---|---|
| US6038488A (en) | 1997-02-27 | 2000-03-14 | Bertec Corporation | Catheter simulation device |
| US20040127337A1 (en) | 1997-03-12 | 2004-07-01 | Nashner Lewis M. | Reducing errors in screening-test administration |
| US6354155B1 (en) | 1999-06-02 | 2002-03-12 | Bertec Corporation | Multi-component force and moment measuring platform and load transducer |
| US6389883B1 (en) | 1999-10-19 | 2002-05-21 | Bertec Corporation | Device, system, and method for measurement of balance, stability, and tremor |
| US6152564A (en) | 1999-12-06 | 2000-11-28 | Bertec Corporation | Infrared eye movement measurement device |
| US6113237A (en) | 1999-12-06 | 2000-09-05 | Ober; Jan Krzysztof | Adaptable eye movement measurement device |
| US6295878B1 (en) | 1999-12-13 | 2001-10-02 | Bertec Corporation | Particular strain gage orientation for a six component load measurement device |
| US20020057380A1 (en) | 2000-06-28 | 2002-05-16 | Pace Micro Technology Plc | Broadcast data receiver with dual tuning capability |
| US20020178008A1 (en) | 2001-04-24 | 2002-11-28 | Microsoft Corporation | Method and system for applying input mode bias |
| US20030216656A1 (en) | 2002-05-17 | 2003-11-20 | Necip Berme | Method for analysis of abnormal body tremors |
| US6936016B2 (en) | 2002-05-17 | 2005-08-30 | Bertec Corporation | Method for analysis of abnormal body tremors |
| US20040260427A1 (en) | 2003-04-08 | 2004-12-23 | William Wimsatt | Home automation contextual user interface |
| US7389144B1 (en) | 2003-11-07 | 2008-06-17 | Flint Hills Scientific Llc | Medical device failure detection and warning system |
| US20060265249A1 (en) | 2005-05-18 | 2006-11-23 | Howard Follis | Method, system, and computer-readable medium for providing a patient electronic medical record with an improved timeline |
| US20080183981A1 (en) | 2006-10-24 | 2008-07-31 | Pentax Corporation | Electronic endoscope |
| US20080228110A1 (en) | 2007-03-15 | 2008-09-18 | Necip Berme | Device for computerized dynamic posturography and a method for balance assessment |
| US20090251130A1 (en) | 2008-04-04 | 2009-10-08 | John Lund | Multimeter having communications via measurement terminals and communication system for same |
| US20110277562A1 (en) | 2010-05-14 | 2011-11-17 | Necip Berme | Low profile transducer with high moment capacity |
| US8181541B2 (en) | 2010-05-14 | 2012-05-22 | Bertec Corporation | Low profile transducer with high moment capacity |
| US20120271565A1 (en) | 2011-04-20 | 2012-10-25 | Bertec Corporation | Force Measurement System Having Inertial Compensation |
| US20120266648A1 (en) | 2011-04-20 | 2012-10-25 | Bertec Corporation | Force and/or Motion Measurement System Having Inertial Compensation and Method Thereof |
| US8315823B2 (en) | 2011-04-20 | 2012-11-20 | Bertec Corporation | Force and/or motion measurement system having inertial compensation and method thereof |
| US8315822B2 (en) | 2011-04-20 | 2012-11-20 | Bertec Corporation | Force measurement system having inertial compensation |
| US8544347B1 (en) | 2012-01-11 | 2013-10-01 | Bertec Corporation | Force measurement system having a plurality of measurement surfaces |
| US8543540B1 (en) | 2012-05-09 | 2013-09-24 | Bertec Corporation | System and method for the merging of databases |
| USD689389S1 (en) | 2013-04-12 | 2013-09-10 | Bertec Corporation | Dual force plate |
| USD689388S1 (en) | 2013-04-12 | 2013-09-10 | Bertec Corporation | Dual force plate |
Non-Patent Citations (12)
| Title |
|---|
| Author: Todd Wilson, Bertec Workbook: Program Documentation, Version 1.0.0, Feb. 2010, pp. 47 Source: http://web.archive.org/web20110918144039/http://bertec.com/uploads/pdfs/manuals/Bertec%20Workbook.pdf. |
| BalanceCheck Screener-Protocol Guide, Bertec Corporation, Version 1.1.0, last updated Mar. 2012. |
| BalanceCheck Screener—Protocol Guide, Bertec Corporation, Version 1.1.0, last updated Mar. 2012. |
| BalanceCheck Trainer-Protocol Guide, Bertec Corporation, Version 1.1.0, last updated Mar. 2012. |
| BalanceCheck Trainer—Protocol Guide, Bertec Corporation, Version 1.1.0, last updated Mar. 2012. |
| Bertec Force Plates, Bertec Corporation, Version 1.0.0, last updated Mar. 2012. |
| Bertec Workbook-Program Documentation, Bertec Corporation, Version 1.1.0, last updated Mar. 2012. |
| Bertec Workbook—Program Documentation, Bertec Corporation, Version 1.1.0, last updated Mar. 2012. |
| Digital Acquire 4-Program Documentation, Bertec Corporation, Version 4.0.11, last updated Jul. 2012. |
| Digital Acquire 4—Program Documentation, Bertec Corporation, Version 4.0.11, last updated Jul. 2012. |
| First office action on the merits (Non-Final Rejection) in U.S. Appl. No. 13/726,065, mailed on Mar. 25, 2013. |
| Notice of Allowance in U.S. Appl. No. 13/726,065, mailed on Jul. 1, 2013. |
Cited By (79)
| Publication number | Priority date | Publication date | Assignee | Title |
|---|---|---|---|---|
| US9168420B1 (en) | 2012-01-11 | 2015-10-27 | Bertec Corporation | Force measurement system |
| US9526451B1 (en) | 2012-01-11 | 2016-12-27 | Bertec Corporation | Force measurement system |
| US10803990B1 (en) | 2012-12-22 | 2020-10-13 | Bertec Corporation | Measurement and testing system that includes a data processing device configured to synchronize a first plurality of data values with a second plurality of data values by determining which first timestamps correspond to which second timestamps and to interpolate values missing from the second values |
| US11158422B1 (en) | 2012-12-22 | 2021-10-26 | Bertec Corporation | Measurement and testing system that includes a data processing device configured to synchronize first and second signals by using time-delayed values or reconstructed values occurring coincident with a transition of a digital time reference signal |
| US11705244B1 (en) | 2012-12-22 | 2023-07-18 | Bertec Corporation | Force and/or motion measurement system that includes at least one camera and at least one data processing device configured to execute computer executable instructions for determining a position and/or movement |
| US9829311B1 (en) | 2012-12-22 | 2017-11-28 | Bertec Corporation | Force measurement system |
| US10331324B1 (en) | 2012-12-22 | 2019-06-25 | Bertec Corporation | Measurement and testing system |
| US9200897B1 (en) | 2012-12-22 | 2015-12-01 | Bertec Corporation | Measurement and testing system |
| US10646153B1 (en) | 2013-01-19 | 2020-05-12 | Bertec Corporation | Force measurement system |
| US9526443B1 (en) | 2013-01-19 | 2016-12-27 | Bertec Corporation | Force and/or motion measurement system and a method of testing a subject |
| US10856796B1 (en) | 2013-01-19 | 2020-12-08 | Bertec Corporation | Force measurement system |
| US10413230B1 (en) | 2013-01-19 | 2019-09-17 | Bertec Corporation | Force measurement system |
| US11857331B1 (en) | 2013-01-19 | 2024-01-02 | Bertec Corporation | Force measurement system |
| US9770203B1 (en) | 2013-01-19 | 2017-09-26 | Bertec Corporation | Force measurement system and a method of testing a subject |
| US11052288B1 (en) | 2013-01-19 | 2021-07-06 | Bertec Corporation | Force measurement system |
| US10231662B1 (en) | 2013-01-19 | 2019-03-19 | Bertec Corporation | Force measurement system |
| US10010286B1 (en) | 2013-01-19 | 2018-07-03 | Bertec Corporation | Force measurement system |
| US11311209B1 (en) | 2013-01-19 | 2022-04-26 | Bertec Corporation | Force measurement system and a motion base used therein |
| US11843904B2 (en) | 2013-03-15 | 2023-12-12 | Fluke Corporation | Automated combined display of measurement data |
| US20140267296A1 (en) * | 2013-03-15 | 2014-09-18 | Fluke Corporation | Automated Combined Display of Measurement Data |
| US10809159B2 (en) * | 2013-03-15 | 2020-10-20 | Fluke Corporation | Automated combined display of measurement data |
| US11604106B2 (en) | 2013-10-05 | 2023-03-14 | Bertec Limited | Force measurement assembly |
| US10126186B2 (en) | 2013-10-05 | 2018-11-13 | Bertec Limited | Load transducer system configured to correct for measurement errors in the output forces and/or moments of the system |
| US10765936B2 (en) | 2013-10-05 | 2020-09-08 | Bertec Limited | Force measurement system |
| US9404823B1 (en) | 2013-10-05 | 2016-08-02 | Bertec Limited | Load transducer and force measurement assembly using the same |
| US11262258B2 (en) | 2013-10-05 | 2022-03-01 | Bertec Limited | Force measurement system |
| US9778119B2 (en) | 2013-10-05 | 2017-10-03 | Bertec Limited | Load transducer and force measurement assembly using the same |
| US11054325B2 (en) | 2013-10-05 | 2021-07-06 | Bertec Limited | Force measurement system |
| US10527508B2 (en) | 2013-10-05 | 2020-01-07 | Bertec Limited | Force measurement system and a method of calibrating the same |
| US9414784B1 (en) | 2014-06-28 | 2016-08-16 | Bertec Limited | Movement assessment apparatus and a method for providing biofeedback using the same |
| US9517008B1 (en) | 2014-11-06 | 2016-12-13 | Bertec Corporation | System and method for testing the vision of a subject |
| US9066667B1 (en) | 2014-11-06 | 2015-06-30 | Bertec Corporation | System and method for testing dynamic visual acuity and/or gaze stabilization |
| US9277857B1 (en) | 2014-11-06 | 2016-03-08 | Bertec Corporation | System for testing and/or training the vision of a subject |
| US9814430B1 (en) | 2015-04-17 | 2017-11-14 | Bertec Corporation | System and method for measuring eye movement and/or eye position and postural sway of a subject |
| US10342473B1 (en) | 2015-04-17 | 2019-07-09 | Bertec Corporation | System and method for measuring eye movement and/or eye position and postural sway of a subject |
| US10966606B1 (en) | 2015-04-17 | 2021-04-06 | Bertec Corporation | System and method for measuring the head position and postural sway of a subject |
| US10555688B1 (en) | 2015-08-22 | 2020-02-11 | Bertec Corporation | Measurement system that includes at least one measurement assembly, a head-mounted visual display device, and a data processing device |
| US10390736B1 (en) | 2015-08-22 | 2019-08-27 | Bertec Corporation | Force measurement system that includes a force measurement assembly, at least one visual display device, and one or more data processing devices |
| US10860843B1 (en) | 2015-08-22 | 2020-12-08 | Bertec Corporation | Measurement system that includes at least one measurement assembly, a head-mounted visual display device, and a data processing device |
| US10216262B1 (en) | 2015-08-22 | 2019-02-26 | Bertec Corporation | Force management system that includes a force measurement assembly, a visual display device, and one or more data processing devices |
| US11301045B1 (en) | 2015-08-22 | 2022-04-12 | Bertec Corporation | Measurement system that includes at least one measurement assembly, a visual display device, and at least one data processing device |
| US9916011B1 (en) | 2015-08-22 | 2018-03-13 | Bertec Corporation | Force measurement system that includes a force measurement assembly, a visual display device, and one or more data processing devices |
| US9568382B1 (en) | 2015-09-26 | 2017-02-14 | Bertec Corporation | Force measurement assembly with damping and force measurement system including the same |
| USD755067S1 (en) | 2015-10-20 | 2016-05-03 | Bertec Corporation | Visual display device for a force and/or motion measurement system |
| US9854997B1 (en) | 2015-11-07 | 2018-01-02 | Bertec Corporation | Force measurement system |
| US10085676B1 (en) | 2015-11-07 | 2018-10-02 | Bertec Corporation | Force measurement system |
| US10117602B1 (en) | 2016-04-09 | 2018-11-06 | Bertec Corporation | Balance and/or gait perturbation system and a method for testing and/or training a subject using the same |
| US9622686B1 (en) | 2016-04-09 | 2017-04-18 | Bertec Corporation | Gait perturbation system and a method for testing and/or training a subject using the same |
| US9763604B1 (en) | 2016-04-09 | 2017-09-19 | Bertec Corporation | Gait perturbation system and a method for testing and/or training a subject using the same |
| GB2561335B (en) * | 2017-02-26 | 2022-09-14 | Vald Operations Ltd | Force platform and method of operating |
| GB2561335A (en) * | 2017-02-26 | 2018-10-17 | Nmp Forcedecks Ltd | Force platform and method of operating |
| US9927312B1 (en) | 2017-03-03 | 2018-03-27 | Bertec Corporation | Motion base for displacing a force measurement assembly |
| US11712162B1 (en) | 2017-06-28 | 2023-08-01 | Bertec Corporation | System for testing and/or training the vision of a user |
| US10722114B1 (en) | 2017-06-28 | 2020-07-28 | Bertec Corporation | System and method for vision testing and/or training |
| US10945599B1 (en) | 2017-06-28 | 2021-03-16 | Bertec Corporation | System and method for vision testing and/or training |
| US11033453B1 (en) | 2017-06-28 | 2021-06-15 | Bertec Corporation | Neurocognitive training system for improving visual motor responses |
| US10264964B1 (en) | 2017-06-28 | 2019-04-23 | Bertec Corporation | Eye movement measurement device |
| US11337606B1 (en) | 2017-06-28 | 2022-05-24 | Bertec Corporation | System for testing and/or training the vision of a user |
| US10463250B1 (en) | 2017-06-28 | 2019-11-05 | Bertec Corporation | System and method for vision testing |
| US11631193B1 (en) | 2018-06-15 | 2023-04-18 | Bertec Corporation | System for estimating a pose of one or more persons in a scene |
| US11074711B1 (en) | 2018-06-15 | 2021-07-27 | Bertec Corporation | System for estimating a pose of one or more persons in a scene |
| US11321868B1 (en) | 2018-06-15 | 2022-05-03 | Bertec Corporation | System for estimating a pose of one or more persons in a scene |
| US10736545B1 (en) | 2018-06-21 | 2020-08-11 | Bertec Corporation | Portable system for vestibular testing and/or training of a user |
| US10853970B1 (en) | 2019-03-22 | 2020-12-01 | Bartec Corporation | System for estimating a three dimensional pose of one or more persons in a scene |
| US11521373B1 (en) | 2019-03-22 | 2022-12-06 | Bertec Corporation | System for estimating a three dimensional pose of one or more persons in a scene |
| US11348279B1 (en) | 2019-03-22 | 2022-05-31 | Bertec Corporation | System for estimating a three dimensional pose of one or more persons in a scene |
| US11688139B1 (en) | 2019-03-22 | 2023-06-27 | Bertec Corporation | System for estimating a three dimensional pose of one or more persons in a scene |
| US11182924B1 (en) | 2019-03-22 | 2021-11-23 | Bertec Corporation | System for estimating a three dimensional pose of one or more persons in a scene |
| US11097154B1 (en) | 2019-10-11 | 2021-08-24 | Bertec Corporation | Swing analysis system |
| US11458362B1 (en) | 2019-10-11 | 2022-10-04 | Bertec Corporation | Swing analysis system |
| US11790536B1 (en) | 2019-10-11 | 2023-10-17 | Bertec Corporation | Swing analysis system |
| US11850078B1 (en) | 2020-01-04 | 2023-12-26 | Bertec Corporation | Force measurement system |
| US11911147B1 (en) | 2020-01-04 | 2024-02-27 | Bertec Corporation | Body sway measurement system |
| US11826601B1 (en) | 2020-01-25 | 2023-11-28 | Bertec Corporation | Cable actuation system |
| US11262231B1 (en) | 2020-05-29 | 2022-03-01 | Bertec Corporation | Swivel foot assembly for a force plate or balance plate |
| CN112526418A (en) * | 2020-11-24 | 2021-03-19 | 上海辰光医疗科技股份有限公司 | Data recording and processing method for magnetic field homogeneity measurement of magnetic resonance imaging |
| US11798182B1 (en) | 2022-06-22 | 2023-10-24 | Bertec Corporation | System for training neural networks that predict the parameters of a human mesh model using dense depth and part-based UV map annotations |
| US11865407B1 (en) | 2022-08-18 | 2024-01-09 | Bertec Corporation | Measurement and testing system |
| US11816258B1 (en) | 2022-10-13 | 2023-11-14 | Bertec Corporation | Head-mounted display system |
Similar Documents
| Publication | Publication Date | Title |
|---|---|---|
| US8902249B1 (en) | Measurement and testing system | |
| US10331324B1 (en) | Measurement and testing system | |
| US8643669B1 (en) | Measurement and testing system | |
| US9200897B1 (en) | Measurement and testing system | |
| US11158422B1 (en) | Measurement and testing system that includes a data processing device configured to synchronize first and second signals by using time-delayed values or reconstructed values occurring coincident with a transition of a digital time reference signal | |
| US9829311B1 (en) | Force measurement system | |
| Hägglund et al. | Patient-centred home-based management of heart failure: findings from a randomised clinical trial evaluating a tablet computer for self-care, quality of life and effects on knowledge | |
| Mor | A comprehensive clinical assessment tool to inform policy and practice: applications of the minimum data set | |
| Ramsey et al. | Cost-effectiveness analysis alongside clinical trials II—an ISPOR Good Research Practices Task Force report | |
| US8196104B2 (en) | Systems and methods for testing application accessibility | |
| TWI700665B (en) | Method, apparatus,computer program and computer program product for collecting test data from use of a disposable test kit | |
| EP1369688A2 (en) | Analyte testing device | |
| Orso et al. | Visualization of program-execution data for deployed software | |
| EP2715502A1 (en) | Web browser with quick site access user interface | |
| CN104798074A (en) | System and method of generating a user interface display of patient parameter data | |
| US20160299632A1 (en) | Method and device for implementing a touch interface | |
| WO2009071191A1 (en) | Method of magnifying a portion of a customizable graph | |
| CN102681748B (en) | Information processing equipment and information processing method | |
| JP2012220991A (en) | Intention confirming system and method | |
| US9348876B1 (en) | Organizing analytically relevant information contextually for efficient presentation | |
| US20110154293A1 (en) | System and method to identify product usability | |
| US9761027B2 (en) | Methods and systems for integrated plot training | |
| US11705244B1 (en) | Force and/or motion measurement system that includes at least one camera and at least one data processing device configured to execute computer executable instructions for determining a position and/or movement | |
| WO2003032149A1 (en) | Inputing data into form cells | |
| CN113113134A (en) | Clinical etiology prejudgment device and system |
Legal Events
| Date | Code | Title | Description |
|---|---|---|---|
| AS | Assignment |
Owner name: BERTEC CORPORATION, OHIO Free format text: ASSIGNMENT OF ASSIGNORS INTEREST;ASSIGNORS:WILSON, TODD CHRISTOPHER, MR.;BERME, NECIP, DR.;REEL/FRAME:031312/0859 Effective date: 20130925 |
|
| FEPP | Fee payment procedure |
Free format text: PAYOR NUMBER ASSIGNED (ORIGINAL EVENT CODE: ASPN); ENTITY STATUS OF PATENT OWNER: SMALL ENTITY |
|
| STCF | Information on status: patent grant |
Free format text: PATENTED CASE |
|
| MAFP | Maintenance fee payment |
Free format text: PAYMENT OF MAINTENANCE FEE, 4TH YR, SMALL ENTITY (ORIGINAL EVENT CODE: M2551) Year of fee payment: 4 |
|
| MAFP | Maintenance fee payment |
Free format text: PAYMENT OF MAINTENANCE FEE, 8TH YR, SMALL ENTITY (ORIGINAL EVENT CODE: M2552); ENTITY STATUS OF PATENT OWNER: SMALL ENTITY Year of fee payment: 8 |