US9170154B2 - Data validation and classification in optical analysis systems - Google Patents
Data validation and classification in optical analysis systems Download PDFInfo
- Publication number
- US9170154B2 US9170154B2 US12/295,631 US29563107A US9170154B2 US 9170154 B2 US9170154 B2 US 9170154B2 US 29563107 A US29563107 A US 29563107A US 9170154 B2 US9170154 B2 US 9170154B2
- Authority
- US
- United States
- Prior art keywords
- data
- signal
- light
- illumination light
- sample
- Prior art date
- Legal status (The legal status is an assumption and is not a legal conclusion. Google has not performed a legal analysis and makes no representation as to the accuracy of the status listed.)
- Active, expires
Links
- 230000003287 optical effect Effects 0.000 title claims abstract description 105
- 238000004458 analytical method Methods 0.000 title abstract description 46
- 238000013502 data validation Methods 0.000 title 1
- 238000005259 measurement Methods 0.000 claims abstract description 91
- 239000000463 material Substances 0.000 claims abstract description 64
- 238000000034 method Methods 0.000 claims abstract description 61
- 238000010200 validation analysis Methods 0.000 claims abstract description 59
- 238000005286 illumination Methods 0.000 claims description 48
- 230000003595 spectral effect Effects 0.000 claims description 45
- 239000013598 vector Substances 0.000 claims description 39
- TVMXDCGIABBOFY-UHFFFAOYSA-N octane Chemical compound CCCCCCCC TVMXDCGIABBOFY-UHFFFAOYSA-N 0.000 claims description 23
- 238000001228 spectrum Methods 0.000 claims description 19
- XLYOFNOQVPJJNP-UHFFFAOYSA-N water Substances O XLYOFNOQVPJJNP-UHFFFAOYSA-N 0.000 claims description 14
- 238000005070 sampling Methods 0.000 abstract description 6
- 239000000523 sample Substances 0.000 description 74
- 230000008569 process Effects 0.000 description 24
- 230000005540 biological transmission Effects 0.000 description 16
- 239000000126 substance Substances 0.000 description 12
- 241000282326 Felis catus Species 0.000 description 8
- VGGSQFUCUMXWEO-UHFFFAOYSA-N Ethene Chemical compound C=C VGGSQFUCUMXWEO-UHFFFAOYSA-N 0.000 description 7
- 239000005977 Ethylene Substances 0.000 description 7
- 238000001514 detection method Methods 0.000 description 7
- 238000011156 evaluation Methods 0.000 description 7
- 238000002156 mixing Methods 0.000 description 7
- 239000007789 gas Substances 0.000 description 6
- 229920000642 polymer Polymers 0.000 description 6
- 239000012491 analyte Substances 0.000 description 5
- 238000004364 calculation method Methods 0.000 description 5
- 239000012530 fluid Substances 0.000 description 5
- 239000000203 mixture Substances 0.000 description 5
- 238000012986 modification Methods 0.000 description 5
- 230000004048 modification Effects 0.000 description 5
- 238000012544 monitoring process Methods 0.000 description 5
- 239000000843 powder Substances 0.000 description 5
- 238000000513 principal component analysis Methods 0.000 description 5
- 239000007787 solid Substances 0.000 description 5
- WCUXLLCKKVVCTQ-UHFFFAOYSA-M Potassium chloride Chemical compound [Cl-].[K+] WCUXLLCKKVVCTQ-UHFFFAOYSA-M 0.000 description 4
- VYPSYNLAJGMNEJ-UHFFFAOYSA-N Silicium dioxide Chemical compound O=[Si]=O VYPSYNLAJGMNEJ-UHFFFAOYSA-N 0.000 description 4
- FAPWRFPIFSIZLT-UHFFFAOYSA-M Sodium chloride Chemical compound [Na+].[Cl-] FAPWRFPIFSIZLT-UHFFFAOYSA-M 0.000 description 4
- 239000011248 coating agent Substances 0.000 description 4
- 238000000576 coating method Methods 0.000 description 4
- 238000013461 design Methods 0.000 description 4
- IOLCXVTUBQKXJR-UHFFFAOYSA-M potassium bromide Chemical compound [K+].[Br-] IOLCXVTUBQKXJR-UHFFFAOYSA-M 0.000 description 4
- 230000004044 response Effects 0.000 description 4
- 238000012360 testing method Methods 0.000 description 4
- 230000003667 anti-reflective effect Effects 0.000 description 3
- 238000013459 approach Methods 0.000 description 3
- 230000008901 benefit Effects 0.000 description 3
- 230000008859 change Effects 0.000 description 3
- 238000007405 data analysis Methods 0.000 description 3
- 238000013480 data collection Methods 0.000 description 3
- 230000001934 delay Effects 0.000 description 3
- 230000001419 dependent effect Effects 0.000 description 3
- 239000006185 dispersion Substances 0.000 description 3
- 239000000839 emulsion Substances 0.000 description 3
- 230000007613 environmental effect Effects 0.000 description 3
- 239000000835 fiber Substances 0.000 description 3
- 238000012417 linear regression Methods 0.000 description 3
- 238000004519 manufacturing process Methods 0.000 description 3
- 230000007246 mechanism Effects 0.000 description 3
- 238000010606 normalization Methods 0.000 description 3
- 239000003921 oil Substances 0.000 description 3
- 239000000546 pharmaceutical excipient Substances 0.000 description 3
- 239000004033 plastic Substances 0.000 description 3
- 229920003023 plastic Polymers 0.000 description 3
- 238000012545 processing Methods 0.000 description 3
- 230000009467 reduction Effects 0.000 description 3
- 238000000611 regression analysis Methods 0.000 description 3
- 238000004611 spectroscopical analysis Methods 0.000 description 3
- 229910000661 Mercury cadmium telluride Inorganic materials 0.000 description 2
- 238000002835 absorbance Methods 0.000 description 2
- 230000003321 amplification Effects 0.000 description 2
- 229910001632 barium fluoride Inorganic materials 0.000 description 2
- 238000004891 communication Methods 0.000 description 2
- 150000001875 compounds Chemical class 0.000 description 2
- 238000000354 decomposition reaction Methods 0.000 description 2
- 230000000694 effects Effects 0.000 description 2
- 239000011521 glass Substances 0.000 description 2
- 229920001903 high density polyethylene Polymers 0.000 description 2
- 239000004700 high-density polyethylene Substances 0.000 description 2
- 230000006872 improvement Effects 0.000 description 2
- NOESYZHRGYRDHS-UHFFFAOYSA-N insulin Chemical compound N1C(=O)C(NC(=O)C(CCC(N)=O)NC(=O)C(CCC(O)=O)NC(=O)C(C(C)C)NC(=O)C(NC(=O)CN)C(C)CC)CSSCC(C(NC(CO)C(=O)NC(CC(C)C)C(=O)NC(CC=2C=CC(O)=CC=2)C(=O)NC(CCC(N)=O)C(=O)NC(CC(C)C)C(=O)NC(CCC(O)=O)C(=O)NC(CC(N)=O)C(=O)NC(CC=2C=CC(O)=CC=2)C(=O)NC(CSSCC(NC(=O)C(C(C)C)NC(=O)C(CC(C)C)NC(=O)C(CC=2C=CC(O)=CC=2)NC(=O)C(CC(C)C)NC(=O)C(C)NC(=O)C(CCC(O)=O)NC(=O)C(C(C)C)NC(=O)C(CC(C)C)NC(=O)C(CC=2NC=NC=2)NC(=O)C(CO)NC(=O)CNC2=O)C(=O)NCC(=O)NC(CCC(O)=O)C(=O)NC(CCCNC(N)=N)C(=O)NCC(=O)NC(CC=3C=CC=CC=3)C(=O)NC(CC=3C=CC=CC=3)C(=O)NC(CC=3C=CC(O)=CC=3)C(=O)NC(C(C)O)C(=O)N3C(CCC3)C(=O)NC(CCCCN)C(=O)NC(C)C(O)=O)C(=O)NC(CC(N)=O)C(O)=O)=O)NC(=O)C(C(C)CC)NC(=O)C(CO)NC(=O)C(C(C)O)NC(=O)C1CSSCC2NC(=O)C(CC(C)C)NC(=O)C(NC(=O)C(CCC(N)=O)NC(=O)C(CC(N)=O)NC(=O)C(NC(=O)C(N)CC=1C=CC=CC=1)C(C)C)CC1=CN=CN1 NOESYZHRGYRDHS-UHFFFAOYSA-N 0.000 description 2
- 230000010354 integration Effects 0.000 description 2
- 239000007788 liquid Substances 0.000 description 2
- 238000003199 nucleic acid amplification method Methods 0.000 description 2
- 239000001103 potassium chloride Substances 0.000 description 2
- 235000011164 potassium chloride Nutrition 0.000 description 2
- 230000005855 radiation Effects 0.000 description 2
- 238000000926 separation method Methods 0.000 description 2
- 239000000377 silicon dioxide Substances 0.000 description 2
- 239000011780 sodium chloride Substances 0.000 description 2
- 238000007619 statistical method Methods 0.000 description 2
- PGAPATLGJSQQBU-UHFFFAOYSA-M thallium(i) bromide Chemical compound [Tl]Br PGAPATLGJSQQBU-UHFFFAOYSA-M 0.000 description 2
- 239000010409 thin film Substances 0.000 description 2
- 231100000331 toxic Toxicity 0.000 description 2
- 230000002588 toxic effect Effects 0.000 description 2
- 229910052984 zinc sulfide Inorganic materials 0.000 description 2
- YBNMDCCMCLUHBL-UHFFFAOYSA-N (2,5-dioxopyrrolidin-1-yl) 4-pyren-1-ylbutanoate Chemical compound C=1C=C(C2=C34)C=CC3=CC=CC4=CC=C2C=1CCCC(=O)ON1C(=O)CCC1=O YBNMDCCMCLUHBL-UHFFFAOYSA-N 0.000 description 1
- PFNQVRZLDWYSCW-UHFFFAOYSA-N (fluoren-9-ylideneamino) n-naphthalen-1-ylcarbamate Chemical compound C12=CC=CC=C2C2=CC=CC=C2C1=NOC(=O)NC1=CC=CC2=CC=CC=C12 PFNQVRZLDWYSCW-UHFFFAOYSA-N 0.000 description 1
- BSYNRYMUTXBXSQ-UHFFFAOYSA-N Aspirin Chemical compound CC(=O)OC1=CC=CC=C1C(O)=O BSYNRYMUTXBXSQ-UHFFFAOYSA-N 0.000 description 1
- LFQSCWFLJHTTHZ-UHFFFAOYSA-N Ethanol Chemical compound CCO LFQSCWFLJHTTHZ-UHFFFAOYSA-N 0.000 description 1
- 229910000530 Gallium indium arsenide Inorganic materials 0.000 description 1
- 229910000673 Indium arsenide Inorganic materials 0.000 description 1
- 102000004877 Insulin Human genes 0.000 description 1
- 108090001061 Insulin Proteins 0.000 description 1
- GUBGYTABKSRVRQ-QKKXKWKRSA-N Lactose Natural products OC[C@H]1O[C@@H](O[C@H]2[C@H](O)[C@@H](O)C(O)O[C@@H]2CO)[C@H](O)[C@@H](O)[C@H]1O GUBGYTABKSRVRQ-QKKXKWKRSA-N 0.000 description 1
- 229910002665 PbTe Inorganic materials 0.000 description 1
- -1 Polyethylene Polymers 0.000 description 1
- 239000004698 Polyethylene Substances 0.000 description 1
- 229910010252 TiO3 Inorganic materials 0.000 description 1
- 239000005083 Zinc sulfide Substances 0.000 description 1
- 229960001138 acetylsalicylic acid Drugs 0.000 description 1
- 239000000654 additive Substances 0.000 description 1
- 230000004075 alteration Effects 0.000 description 1
- 230000009118 appropriate response Effects 0.000 description 1
- 238000003491 array Methods 0.000 description 1
- 229910052788 barium Inorganic materials 0.000 description 1
- OYLGJCQECKOTOL-UHFFFAOYSA-L barium fluoride Chemical compound [F-].[F-].[Ba+2] OYLGJCQECKOTOL-UHFFFAOYSA-L 0.000 description 1
- 230000004397 blinking Effects 0.000 description 1
- XQPRBTXUXXVTKB-UHFFFAOYSA-M caesium iodide Chemical compound [I-].[Cs+] XQPRBTXUXXVTKB-UHFFFAOYSA-M 0.000 description 1
- WUKWITHWXAAZEY-UHFFFAOYSA-L calcium difluoride Chemical compound [F-].[F-].[Ca+2] WUKWITHWXAAZEY-UHFFFAOYSA-L 0.000 description 1
- 229910001634 calcium fluoride Inorganic materials 0.000 description 1
- 239000003990 capacitor Substances 0.000 description 1
- 238000001311 chemical methods and process Methods 0.000 description 1
- 238000010224 classification analysis Methods 0.000 description 1
- 238000013145 classification model Methods 0.000 description 1
- 229910052681 coesite Inorganic materials 0.000 description 1
- 239000003086 colorant Substances 0.000 description 1
- 230000006835 compression Effects 0.000 description 1
- 238000007906 compression Methods 0.000 description 1
- 238000000205 computational method Methods 0.000 description 1
- 238000010276 construction Methods 0.000 description 1
- 239000000109 continuous material Substances 0.000 description 1
- 238000001816 cooling Methods 0.000 description 1
- 229910052906 cristobalite Inorganic materials 0.000 description 1
- 230000008021 deposition Effects 0.000 description 1
- 238000010586 diagram Methods 0.000 description 1
- 229910003460 diamond Inorganic materials 0.000 description 1
- 239000010432 diamond Substances 0.000 description 1
- 238000009792 diffusion process Methods 0.000 description 1
- 238000007876 drug discovery Methods 0.000 description 1
- 230000005611 electricity Effects 0.000 description 1
- 238000005868 electrolysis reaction Methods 0.000 description 1
- 238000005516 engineering process Methods 0.000 description 1
- 238000012854 evaluation process Methods 0.000 description 1
- 238000001704 evaporation Methods 0.000 description 1
- 230000008020 evaporation Effects 0.000 description 1
- 230000005284 excitation Effects 0.000 description 1
- 238000002474 experimental method Methods 0.000 description 1
- 238000004880 explosion Methods 0.000 description 1
- 239000002360 explosive Substances 0.000 description 1
- 238000001413 far-infrared spectroscopy Methods 0.000 description 1
- 238000009501 film coating Methods 0.000 description 1
- 238000004186 food analysis Methods 0.000 description 1
- 238000004868 gas analysis Methods 0.000 description 1
- 229910052732 germanium Inorganic materials 0.000 description 1
- GNPVGFCGXDBREM-UHFFFAOYSA-N germanium atom Chemical compound [Ge] GNPVGFCGXDBREM-UHFFFAOYSA-N 0.000 description 1
- PCHJSUWPFVWCPO-UHFFFAOYSA-N gold Chemical compound [Au] PCHJSUWPFVWCPO-UHFFFAOYSA-N 0.000 description 1
- 239000010931 gold Substances 0.000 description 1
- 229910052737 gold Inorganic materials 0.000 description 1
- 239000000383 hazardous chemical Substances 0.000 description 1
- 230000036541 health Effects 0.000 description 1
- GPRLSGONYQIRFK-UHFFFAOYSA-N hydron Chemical compound [H+] GPRLSGONYQIRFK-UHFFFAOYSA-N 0.000 description 1
- 238000003384 imaging method Methods 0.000 description 1
- WPYVAWXEWQSOGY-UHFFFAOYSA-N indium antimonide Chemical compound [Sb]#[In] WPYVAWXEWQSOGY-UHFFFAOYSA-N 0.000 description 1
- 229940125396 insulin Drugs 0.000 description 1
- 230000002452 interceptive effect Effects 0.000 description 1
- 238000011835 investigation Methods 0.000 description 1
- 239000008101 lactose Substances 0.000 description 1
- 238000012423 maintenance Methods 0.000 description 1
- 238000007620 mathematical function Methods 0.000 description 1
- 238000013178 mathematical model Methods 0.000 description 1
- 238000000691 measurement method Methods 0.000 description 1
- 238000002844 melting Methods 0.000 description 1
- QSHDDOUJBYECFT-UHFFFAOYSA-N mercury Chemical compound [Hg] QSHDDOUJBYECFT-UHFFFAOYSA-N 0.000 description 1
- 229910052751 metal Inorganic materials 0.000 description 1
- 239000002184 metal Substances 0.000 description 1
- 238000004476 mid-IR spectroscopy Methods 0.000 description 1
- 230000007935 neutral effect Effects 0.000 description 1
- 239000003960 organic solvent Substances 0.000 description 1
- 239000002245 particle Substances 0.000 description 1
- 230000035515 penetration Effects 0.000 description 1
- 239000003208 petroleum Substances 0.000 description 1
- 239000003209 petroleum derivative Substances 0.000 description 1
- 230000000704 physical effect Effects 0.000 description 1
- 229920000573 polyethylene Polymers 0.000 description 1
- 230000001681 protective effect Effects 0.000 description 1
- 238000010926 purge Methods 0.000 description 1
- 238000011897 real-time detection Methods 0.000 description 1
- 238000011160 research Methods 0.000 description 1
- 229920005989 resin Polymers 0.000 description 1
- 239000011347 resin Substances 0.000 description 1
- SBIBMFFZSBJNJF-UHFFFAOYSA-N selenium;zinc Chemical compound [Se]=[Zn] SBIBMFFZSBJNJF-UHFFFAOYSA-N 0.000 description 1
- 230000035945 sensitivity Effects 0.000 description 1
- 229910052710 silicon Inorganic materials 0.000 description 1
- 239000010703 silicon Substances 0.000 description 1
- 235000012239 silicon dioxide Nutrition 0.000 description 1
- 239000000243 solution Substances 0.000 description 1
- 238000012306 spectroscopic technique Methods 0.000 description 1
- 230000007480 spreading Effects 0.000 description 1
- 238000003892 spreading Methods 0.000 description 1
- 229910001220 stainless steel Inorganic materials 0.000 description 1
- 239000010935 stainless steel Substances 0.000 description 1
- 229910052682 stishovite Inorganic materials 0.000 description 1
- OCGWQDWYSQAFTO-UHFFFAOYSA-N tellanylidenelead Chemical compound [Pb]=[Te] OCGWQDWYSQAFTO-UHFFFAOYSA-N 0.000 description 1
- CMJCEVKJYRZMIA-UHFFFAOYSA-M thallium(i) iodide Chemical compound [Tl]I CMJCEVKJYRZMIA-UHFFFAOYSA-M 0.000 description 1
- 229910052905 tridymite Inorganic materials 0.000 description 1
- 230000000007 visual effect Effects 0.000 description 1
- 239000002351 wastewater Substances 0.000 description 1
- 239000011701 zinc Substances 0.000 description 1
- DRDVZXDWVBGGMH-UHFFFAOYSA-N zinc;sulfide Chemical compound [S-2].[Zn+2] DRDVZXDWVBGGMH-UHFFFAOYSA-N 0.000 description 1
Images
Classifications
-
- G—PHYSICS
- G01—MEASURING; TESTING
- G01J—MEASUREMENT OF INTENSITY, VELOCITY, SPECTRAL CONTENT, POLARISATION, PHASE OR PULSE CHARACTERISTICS OF INFRARED, VISIBLE OR ULTRAVIOLET LIGHT; COLORIMETRY; RADIATION PYROMETRY
- G01J3/00—Spectrometry; Spectrophotometry; Monochromators; Measuring colours
- G01J3/28—Investigating the spectrum
-
- G—PHYSICS
- G01—MEASURING; TESTING
- G01J—MEASUREMENT OF INTENSITY, VELOCITY, SPECTRAL CONTENT, POLARISATION, PHASE OR PULSE CHARACTERISTICS OF INFRARED, VISIBLE OR ULTRAVIOLET LIGHT; COLORIMETRY; RADIATION PYROMETRY
- G01J3/00—Spectrometry; Spectrophotometry; Monochromators; Measuring colours
- G01J3/02—Details
- G01J3/0291—Housings; Spectrometer accessories; Spatial arrangement of elements, e.g. folded path arrangements
-
- G—PHYSICS
- G01—MEASURING; TESTING
- G01J—MEASUREMENT OF INTENSITY, VELOCITY, SPECTRAL CONTENT, POLARISATION, PHASE OR PULSE CHARACTERISTICS OF INFRARED, VISIBLE OR ULTRAVIOLET LIGHT; COLORIMETRY; RADIATION PYROMETRY
- G01J3/00—Spectrometry; Spectrophotometry; Monochromators; Measuring colours
- G01J3/02—Details
- G01J3/10—Arrangements of light sources specially adapted for spectrometry or colorimetry
-
- G—PHYSICS
- G01—MEASURING; TESTING
- G01J—MEASUREMENT OF INTENSITY, VELOCITY, SPECTRAL CONTENT, POLARISATION, PHASE OR PULSE CHARACTERISTICS OF INFRARED, VISIBLE OR ULTRAVIOLET LIGHT; COLORIMETRY; RADIATION PYROMETRY
- G01J3/00—Spectrometry; Spectrophotometry; Monochromators; Measuring colours
- G01J3/12—Generating the spectrum; Monochromators
- G01J2003/1213—Filters in general, e.g. dichroic, band
-
- G—PHYSICS
- G01—MEASURING; TESTING
- G01J—MEASUREMENT OF INTENSITY, VELOCITY, SPECTRAL CONTENT, POLARISATION, PHASE OR PULSE CHARACTERISTICS OF INFRARED, VISIBLE OR ULTRAVIOLET LIGHT; COLORIMETRY; RADIATION PYROMETRY
- G01J3/00—Spectrometry; Spectrophotometry; Monochromators; Measuring colours
- G01J3/28—Investigating the spectrum
- G01J2003/2866—Markers; Calibrating of scan
-
- G—PHYSICS
- G01—MEASURING; TESTING
- G01N—INVESTIGATING OR ANALYSING MATERIALS BY DETERMINING THEIR CHEMICAL OR PHYSICAL PROPERTIES
- G01N2201/00—Features of devices classified in G01N21/00
- G01N2201/12—Circuits of general importance; Signal processing
- G01N2201/129—Using chemometrical methods
Definitions
- the present invention relates to improvements related to system design, fabrication and operation of measurement systems. More particularly, the invention relates to data analysis for improved performance of multivariate optical computing systems.
- Light conveys information through data.
- light When light interacts with matter, for example, it carries away information about the physical and chemical properties of the matter.
- a property of the light for example, its intensity, may be measured and interpreted to provide information about the matter with which it interacted. That is, the data carried by the light through its intensity may be measured to derive information about the matter.
- light data is manipulated to convey information over an optical transmission medium, for example fiber optic cable. The data is measured when the light signal is received to derive information.
- An estimate may be obtained, for example, by separating light from several samples into wavelength bands and performing a multiple linear regression of the intensity of these bands against the results of conventional measurements of the desired information for each sample.
- a polymer sample may be illuminated so that light from the polymer carries information such as the sample's ethylene content.
- Light from each of several samples may be directed to a series of bandpass filters which separate predetermined wavelength bands from the light. Light detectors following the bandpass filters measure the intensity of each light band.
- Equation 1 Equation 1
- Equation 1 may be used to estimate ethylene content of subsequent samples of the same polymer type. Depending on the circumstances, however, the estimate may be unacceptably inaccurate since factors other than ethylene may affect the intensity of the wavelength bands. These other factors may not change from one sample to the next in a manner consistent with ethylene.
- a more accurate estimate may be obtained by compressing the data carried by the light into principal components.
- spectroscopic data is collected for a variety of samples of the same type of light, for example from illuminated samples of the same type of polymer.
- the light samples may be spread into their wavelength spectra by a spectrograph so that the magnitude of each light sample at each wavelength may be measured.
- This data is then pooled and subjected to a linear-algebraic process known as singular value decomposition (SVD).
- SVD singular value decomposition
- principal component analysis is a dimension reduction technique, which takes m spectra with n independent variables and constructs a new set of eigenvectors that are linear combinations of the original variables.
- the eigenvectors may be considered a new set of plotting axes.
- the primary axis, termed the first principal component, is the vector, which describes most of the data variability.
- Subsequent principal components describe successively less sample variability, until only noise is described by the higher order principal components.
- each component of a light sample may be expressed as x n z n , where x n is a scalar multiplier and z n is the normalized component vector for the nth component. That is, z n is a vector in a multi-dimensional space where each wavelength is a dimension.
- normalization determines values for a component at each wavelength so that the component maintains it shape and so that the length of the principal component vector is equal to one.
- each normalized component vector has a shape and a magnitude so that the components may be used as the basic building blocks of all light samples having those principal components.
- each light sample may be described in the following format by the combination of the normalized principal components multiplied by the appropriate scalar multipliers: x 1 z 1 +x 2 z 2 + . . . +x n z n .
- the scalar multipliers xn may be considered the “magnitudes” of the principal components in a given light sample when the principal components are understood to have a standardized magnitude as provided by normalization.
- the principal components are orthogonal, they may be used in a relatively straightforward mathematical procedure to decompose a light sample into the component magnitudes, which accurately describe the data in the original sample.
- the original light sample may also be considered a vector in the multi-dimensional wavelength space
- the dot product of the original signal vector with a principal component vector is the magnitude of the original signal in the direction of the normalized component vector. That is, it is the magnitude of the normalized principal component present in the original signal.
- This is analogous to breaking a vector in a three dimensional Cartesian space into its X, Y and Z components.
- the dot product of the three-dimensional vector with each axis vector assuming each axis vector has a magnitude of 1, gives the magnitude of the three dimensional vector in each of the three directions.
- the dot product of the original signal and some other vector that is not perpendicular to the other three dimensions provides redundant data, since this magnitude is already contributed by two or more of the orthogonal axes.
- the dot, or direct, product of any principal component with any other principal component is zero. Physically, this means that the components do not interfere with each other. If data is altered to change the magnitude of one component in the original light signal, the other components remain unchanged. In the analogous Cartesian example, reduction of the X component of the three dimensional vector does not affect the magnitudes of the Y and Z components.
- each principal component is a light signal that forms a part of the original light signal. Each has a shape over some wavelength range within the original wavelength range. Summing the principal components produces the original signal, provided each component has the proper magnitude.
- the principal components comprise a compression of the data carried by the total light signal.
- the shape and wavelength range of the principal components describe what data is in the total light signal while the magnitude of each component describes how much of that data is there. If several light samples contain the same types of data, but in differing amounts, then a single set of principal components may be used to exactly describe (except for noise) each light sample by applying appropriate magnitudes to the components.
- the principal components may be used to accurately estimate information carried by the light. For example, suppose samples of a certain brand of gasoline, when illuminated, produce light having the same principal components. Spreading each light sample with a spectrograph may produce wavelength spectra having shapes that vary from one gasoline sample to another. The differences may be due to any of several factors, for example differences in octane rating or lead content.
- the differences in the sample spectra may be described as differences in the magnitudes of the principal components.
- the gasoline samples might have four principal components.
- the magnitudes xn of these components in one sample might be J, K, L, and M, whereas in the next sample the magnitudes may be 0.94 J, 1.07K, 1.13 L and 0.86M.
- these magnitudes exactly describe their respective light samples.
- y is octane rating
- an are constants determined by the regression analysis
- x 1 , x 2 , x 3 and x 4 are the first, second, third and fourth principal component magnitudes, respectively.
- Equation 2 which may be referred to as a regression vector
- refineries may accurately estimate octane rating of subsequent gasoline samples.
- Conventional systems perform regression vector calculations by computer, based on spectrograph measurements of the light sample by wavelength. The spectrograph system spreads the light sample into its spectrum and measures the intensity of the light at each wavelength over the spectrum wavelength range. If the regression vector in the Equation 2 form is used, the computer reads the intensity data and decomposes the light sample into the principal component magnitudes x n by determining the dot product of the total signal with each component. The component magnitudes are then applied to the regression equation to determine octane rating.
- the regression vector is typically converted to a form that is a function of wavelength so that only one dot product is performed.
- Equation 3 y is octane rating
- a 0 is the first regression constant from Equation 2
- b n is the sum of the multiple of each regression constant an from Equation 2 and the value of its respective normalized regression vector at wavelength n
- u n is the intensity of the light sample at wavelength n.
- the regression vector in a form as in Equation 3 represents the dot product of a light sample with this vector.
- Normalization of the principal components provides the components with an arbitrary value for use during the regression analysis. Accordingly, it is very unlikely that the dot product result produced by the regression vector will be equal to the actual octane rating.
- the number will, however, be proportional to the octane rating.
- the proportionality factor may be determined by measuring octane rating of one or more samples by conventional means and comparing the result to the number produced by the regression vector. Thereafter, the computer can simply scale the dot product of the regression vector and spectrum to produce a number approximately equal to the octane rating.
- a laser directs light to a sample by a bandpass filter, a beam splitter, a lens and a fiber optic cable. Light is reflected back through the cable and the beam splitter to another lens to a spectrograph.
- the spectrograph separates light from the illuminated sample by wavelength so that a detection device such as a charge couple detector can measure the intensity of the light at each wavelength.
- the charge couple detector is controlled by controller and cooled by a cooler.
- the detection device measures the light intensity of light from the spectrograph at each wavelength and outputs this data digitally to a computer, which stores the light intensity over the wavelength range.
- the computer also stores a previously derived regression vector for the desired sample property, for example octane, and sums the multiple of the light intensity and the regression vector intensity at each wavelength over the sampled wavelength range, thereby obtaining the dot product of the light from the substance and the regression vector. Since this number is proportional to octane rating, the octane rating of the sample is identified.
- a previously derived regression vector for the desired sample property for example octane
- spectrograph separates the sample light into its wavelengths, a detector is needed that can detect and distinguish the relatively small amounts of light at each wavelength.
- Charge couple devices provide high sensitivity throughout the visible spectral region and into the near infrared with extremely low noise. These devices also provide high quantum efficiency, long lifetime, imaging capability and solid-state characteristics. Unfortunately, however, charge couple devices and their required operational instrumentation are very expensive. Furthermore, the devices are sensitive to environmental conditions. In a refinery, for example, they must be protected from explosion, vibration and temperature fluctuations and are often placed in protective housings approximately the size of a refrigerator. The power requirements, cooling requirements, cost, complexity and maintenance requirements of these systems have made them impractical in many applications.
- Multivariate optical computing is a powerful predictive spectroscopic technique that incorporates a multi-wavelength spectral weighting directly into analytical instrumentation. This is in contrast to traditional data collection routines where digitized spectral data is post processed with a computer to correlate spectral signal with analyte concentration.
- Previous work has focused on performing such spectral weightings by employing interference filters called Multivariate Optical Elements (MOEs).
- MOEs Multivariate Optical Elements
- Other researchers have realized comparable results by controlling the staring or integration time for each wavelength during the data collection process. All-optical computing methods have been shown to produce similar multivariate calibration models, but the measurement precision via an optical computation is superior to a traditional digital regression.
- the MOE utilizes a thin film interference filter to sense the magnitude of a spectral pattern.
- a no-moving parts spectrometer highly selective to a particular analyte may be constructed by designing simple calculations based on the filter transmission and reflection spectra.
- Other research groups have also performed optical computations through the use of weighted integration intervals and acousto-optical tunable filters digital mirror arrays and holographic gratings.
- the measurement precision of digital regression has been compared to various optical computing techniques including MOEs, positive/negative interference filters and weighted-integration scanning optical computing.
- MOEs positive/negative interference filters
- optical computing offers a higher measurement precision when compared to its digital regression counterpart.
- the enhancement in measurement precision for scanning instruments is related to the fraction of the total experiment time spent on the most important wavelengths. While the detector integrates or coadds measurements at these important wavelengths, the signal increases linearly while the noise increases as a square root of the signal.
- Another contribution to this measurement precision enhancement is a combination of the Felgott's and Jacquinot's advantage, which is possessed by MOE optical computing.
- a method of classifying measurement results in a multivariate optical computing system can comprise receiving a first signal based on light that has interacted with a material of interest and at least one spectral element.
- the method can also comprise receiving a second signal based on light that has interacted with the material of interest.
- light may be transmitted through and/or reflected from a sample of a chemical, compound, or mixture in any suitable form or forms.
- the light may split, with at least a portion of the light directed through a spectral element, such as a multivariate optical element, and then into a detector.
- the other portion or portions of the light may be directed into a detector without first passing through a multivariate optical element in some embodiments.
- the multivariate optical element may, for example, perform a dot product operation on the light received from the material of interest and a weighted regression vector.
- the signals may be provided to at least one computing device by one or more detectors, with the computing device(s) configured to analyze the signals in one or more ways.
- the first and second signals may be adjusted prior to receipt and/or analysis.
- a gain mechanism may be used to fine-tune or amplify either or both signals.
- the computing device(s) can comprise any suitable number or combination of components configured to analyze signals and provide a result or results.
- the device(s) may comprise general-purpose or specialized computer(s), controllers, or other hardware adapted to perform spectroscopic analysis.
- the computing device(s) may be adapted using hardware and/or software that configures the device(s) to perform steps, tasks, or processes.
- the computing device(s) may be configured by a first software routine and/or by hardware to evaluate one or more characteristics of a material based on the values of the first and second signals. As was noted above, the characteristics may be inferred from information obtained from light that has interacted with the material, with the information of interest obtained from the light through the use of one or more spectral elements, such as a multivariate optical element or elements.
- evaluation of a desired property can occur by using hardware, such as amplifiers, addition, subtraction, and other logic circuitry constructed to provide output based on the values of the signals.
- hardware such as amplifiers, addition, subtraction, and other logic circuitry constructed to provide output based on the values of the signals.
- the term “computing device” is not meant to include only computers that operate based on software, but also circuits constructed and configured to provide output based on input signal values.
- a second software routine and/or additional hardware included in or functioning in conjunction with the multivariate optical computing system can be used to validate and/or classify measurements based on the first and second signals. While validating/classifying may be advantageous when provided alongside a substantive measurement, it will be understood that validation/classification can occur without providing a measurement.
- the method can further comprise providing classifying information based on determining whether the first signal and lie in a range of expected results.
- the method can comprise accessing validation data that indicates the range of expected results.
- the validation data comprises data indicating at least one boundary that defines expected results as a function of the values of the first and second signals.
- the relationship between the first and second signals can be used as a basis for classifying measurements.
- providing classifying information can comprise determining where a given pair of simultaneous values for the first and second signal lie relative to the boundary or boundaries indicated in the validation data.
- Providing may further comprise storing data representing some or all of the classification data and/or generating one or more indicators of the classification data.
- one or more circuits can be configured to provide an output or outputs based on the first and second signals, with circuit(s) configured so that the output indicates whether the first and second signals lie in an expected range of results.
- providing classifying information can comprise indicating whether a result is valid or invalid. For example, if validation data or a validation model comprises a two-dimensional area defined in one dimension by the value of the first signal and in the second dimension by the second signal, one or more boundaries may divide the two-dimensional area into at least valid result area and an invalid result area. Providing classifying information can comprise indicating whether a measurement is valid based on whether a data point defined by the values of the first and second signal lie in the valid result area or the invalid result data.
- the validation data or model may comprise a plurality of boundaries defining multiple areas, such as a plurality of boundaries by confidence interval. For example, the validation data may define a first confidence interval, a second confidence interval, and a third confidence interval.
- Providing classification data can comprise indicating which confidence interval a particular pair of first and second signal values lies within.
- An optical computing system can comprise at least one computing device adapted to: receive data from a first detector indicative of light that has interacted with a material of interest and at least one spectral element, receive data from a second detector indicative of light that has interacted with the material of interest, and produce classification data based on determining if the data from the first and second detectors lie in a range of expected results.
- a “computing device” can comprise a computer adapted by software, but may alternatively or additionally comprise circuits constructed to provide output.
- detector data and classification data may comprise information in computer-readable form or may comprise analog signals.
- the computing device can access validation data defining the range of expected results and produce classification data based on evaluating the data from the first and second detectors and the validation data.
- the validation data may, for example, define at least one boundary as a function of the values of the first and second signal, and producing classification data can comprise determining where a pair of first and second signals lie relative to the boundary.
- the optical computing system can further comprise at least one light source configured to illuminate a material of interest and first and second broadband detectors.
- Each detector can be configured to detect light over a range of wavelengths and to provide data to the computing device.
- the computing device comprises a computer
- the data may be digital.
- the computing device comprises an evaluation circuit
- the data may comprise one or more signals from each detector.
- Embodiments of a method of configuring a measurement system can include obtaining calibration data.
- the calibration data can comprise a plurality of data points defining a response of an optical measurement system when the system is used to measure a known type or types of material.
- one or more multivariate optical elements can be constructed.
- a validation model comprising at least one boundary can be prepared.
- the data points may be subjected to one or more different statistical analyses to define confidence intervals.
- a model may simply define a first confidence interval indicating valid, or expected, results and a second confidence intervals indicating invalid, or unexpected, results.
- a model may define multiple confidence intervals, such as 99%, 95%, 90%, or any other lower percentage values.
- the confidence intervals alternatively may be defined as first, second, third, fourth, fifth, and so on standard deviations (sigma).
- the one or more multivariate optical elements constructed based on the calibration data can be included in a measurement system.
- the multivariate optical elements may be placed into an optical computing system used to measure one or more characteristics of a material, or may be provided to an end-user for such placement.
- the calibration model may also be used to configure the measurement system to validate or classify the results.
- a computer system associated with the measurement system may be configured to validate or classify measurements using the calibration model.
- circuitry included within or for use with the measurement system can be configured to validate results based on the model.
- FIG. 1 is a top perspective view of one embodiment of a real time measurement system according to an aspect of the present invention
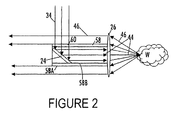
- FIG. 2 is a schematic view of a concentric cavity as in FIG. 1 in accordance with a further aspect of the present invention
- FIG. 3 is schematic plan view of another embodiment of a real time measurement system according to another aspect of the present invention.
- FIG. 4 is a schematic view of an exemplary implementation in which material(s) undergoing a process step may be measured in real-time using a multivariate optical computer;
- FIG. 5 is a 3-D graph of exemplary principal components for three data sets showing overlapping and outlying data points
- FIG. 6 is a 2-D graph showing data points for the detector outputs of an exemplary optical computing system measuring the same three data sets of FIG. 5 ;
- FIG. 7 is a 2-D graph showing hypothetical data points and exemplary corresponding confidence intervals that may be used to classify measurement data
- FIG. 8 is a process flow showing exemplary steps that may be carried out to provide measurement classification capability.
- FIG. 9 is a process flow showing exemplary steps in a classification routine.
- an optical analysis system is designated by the element number 10 .
- the system 10 is designed around at least one application specific multivariate optical element (MOE) based on spectra typically provided by an end-user.
- MOE application specific multivariate optical element
- System design takes into account representative spectra of compounds of interest, basic and expected concentrations of interest across a range of expected interferents.
- the system 10 incorporates the desired spectral regions (UV, VIS, NIR, MIR, IR) of interest.
- the optical analysis system 10 broadly includes a housing 12 , a plurality of illumination or light sources 14 A, 14 B, a concentric light tube or cavity 22 , a focusing lens 26 , at least one beam splitter 28 , a first detector 30 including a multivariate optical element 48 and a second detector 32 .
- FIG. 1 shows a generally square- or rectangle-shaped, metallic housing 12 and two detectors 30 , 32 arranged therein, a variety of shapes, dimensions, component placements and material makeup of the components can be substituted for the examples shown according to various requirements such as government regulations, customer specifications and the like.
- the term “light” is broadly used to mean any form of radiation or radiative energy including, for instance, visible light or light in the infrared region. “Light” is also referred to herein as a light signal, a light beam, a light ray and the like to mean any form of radiative energy in the electromagnetic spectrum. Similarly, the term “transmission” can mean transmission of radiative energy onto a surface of a sample; penetration, however slight, into a sample such as a particulate sample or opaque fluid sample; or passage through a sample.
- a workpiece or sample W can be analyzed using a PCR-type model without the beamsplitter 28 in an off-line approach.
- the workpiece or sample W can mean an analyte undergoing analysis over a range of conditions.
- the sample can be a solid or a fluid including but not limited to a powder, a pharmaceutical powder mixed with lactose and other excipient materials, a chemical, a polymer, a petroleum product, a solution, a dispersion, an emulsion and combinations of these solids and fluids.
- the system can be a measurement system operating in reflectance mode
- the system can also be configured to operate in a transmission mode in which light is shone through the sample W from an incident side of the sample W to a similar detection system 110 on another side of the sample W.
- a mirrored surface 210 can be placed within the transmissive sample to reflect the light back into the detection system 10 . Therefore, the invention is not limited only to the examples shown in the figures.
- the housing 12 (shown partially in phantom for clarity) can be metal such as stainless steel, a plastic material such as high-density polyethylene (HDPE) or any durable material for protecting the components of the optical analysis system 10 .
- sampling of the sample W is accomplished through a window 13 in the enclosed optical analysis system 10 .
- the enclosed optical analysis system 10 can be used in a dangerous (e.g., explosive) environment.
- the window 13 is transmissive in a known manner in a spectral region of interest.
- the illumination sources 14 A, 14 B are chosen to provide a source light 34 , which has a spectral range determined by a spectral range of interest for the intended sample measurement.
- the illumination sources 14 A, 14 B are also chosen based on reliability, intensity, temperature generation, and other factors.
- the illumination sources 14 A, 14 B are also redundant to further enhance reliability. As shown in FIG. 1 , the redundant illumination sources 14 A, 14 B can be oriented at 90 degrees from each other with a “50-50” beam splitter 36 located near their center point to provide a constant source of illumination.
- FIG. 1 further shows a plurality of lenses 16 A, 16 B, respectively associated with each of the illumination sources 14 A, 14 B.
- the lenses 16 A, 16 B are used to collect the light signal 34 from the illumination sources 14 A, 14 B and to focus the light signal 34 on a modulator or chopper wheel 18 , described below.
- the lenses 16 A, 16 B are positioned to capture as much of the light signal 34 as possible from the illumination sources 14 A, 14 B.
- a chopper-focusing lens 17 is used to focus as much of the light signal 34 as possible through the chopper wheel 18 .
- the lenses 16 A, 16 B, 17 are selected for focal length, position, material of construction and the like to enhance transmission (reduce loss) of the light signal 34 .
- the illumination sources 14 A, 14 B is a lamp
- slight magnification or demagnification of the source is generally obtained at the sample W, depending on the ratios of the focal length, e.g., of the lens 16 A to that placed after the illumination source 14 A to collimate it.
- the image of the illumination source 14 A on the sample W is directed toward the detectors 30 , 32 as described below and again with some slight magnification or demagnification, depending on the ratios of the focal length, e.g., of the lenses 16 A to that of, e.g., a lens 50 placed before the detector 30 to focus a reflected light 46 onto the detector 30 .
- Lenses 16 A, 16 B shown for example in FIG. 1 are plastic, Fresnel lenses well suited for use in an infrared (IR) region of about 1000 nanometers (nm) to about 3000 nm.
- the lenses 16 A, 16 B are not limited to only plastic, Fresnel lenses and other types of lenses and materials, such as glass or other materials, can be used for these lenses.
- the chopper wheel 18 includes a plurality of alternating windows 38 and a plurality of alternating spokes 40 .
- the alternating windows 38 and spokes 40 modulate the light signal 34 from about 50 Hertz (Hz) to about 5000 Hz to enable a plurality of photodetectors 52 , 56 in the optical system 10 to perform properly, as will be further described below.
- the chopper wheel 18 is a 10-window chopper wheel rotating at 40 Hz, which provides a chopped signal of 400 Hz.
- the number and arrangement of the windows 38 and spokes 40 and thus, the chopper frequency are chosen based on several variables, including a rate of motion of the sample material W moving past the sampling window 13 ; a performance characteristic of the photodetectors 52 , 56 and amplification system; a predetermined sampling rate of the data collection and analysis system 10 ; physical properties of a chopper motor (not shown), control system (not shown), and the chopper wheel 18 (including material(s) of the windows 38 ).
- the number of windows 38 in the chopper wheel 18 can be adjusted to provide a suitable degree of signal modulation.
- the chopper wheel 18 has open windows 38 and black spokes 40 , which block the light signal 34 .
- different materials can be placed in the windows 38 to provide different spectral characteristics for the various windows 38 .
- the transmission characteristic of these windows 38 could be used as further spectral elements.
- the windows 38 can also contain multivariate optical elements (MOE) such as those described below with respect to a MOE 48 of the MOE detector 30 .
- MOE multivariate optical elements
- FIG. 1 also shows a plurality of bandpass filters or spectral elements 20 located in a path of the light signal 34 after the light signal 34 has passed through the chopper wheel 18 .
- the spectral elements 20 are selected based on a desired application; i.e., to analyze a particular sample W.
- the spectral elements 20 are chosen so that the spectral region of illumination covers the desired range; i.e., related to a particular chemical material of interest. For example, if 1500-2000 nanometers (nm) of light wavelengths is the desired spectral region, the spectral elements 20 are selected to filter out wavelengths are not in that region.
- An example of these spectral elements is a Schott brand filter, which can be a long pass, short pass, or band pass filter.
- some suitable materials for use as the spectral elements 20 are listed in the following table.
- the light signal 34 exits the spectral elements 20 and reflects off a first mirror or turning mirror 24 .
- the turning mirror 24 can be turned to any desired angle.
- the turning mirror 24 can be a powered turning mirror powered by a battery, by electricity or the like. Further description of power sources and implementation with the turning mirror 24 is not necessary for one skilled in the art to understand this aspect of the invention.
- the turning mirror 24 is shown as a unitary mirror, other embodiments can utilize multiple mirrors arranged in or adjustable to a variety of positions.
- the filtered and reflected light signal 34 becomes a reflected light 44 after being reflected by the turning mirror 24 .
- the reflected light 44 thus continues down the concentric sampling tube 22 , briefly introduced above, in a direction of the sample W.
- the concentric tube 22 includes an inner annular region (also referred to as tube or chamber) 42 A and an outer annular region 42 B (also, tube or chamber).
- the reflected light 44 is reflected along the inner annular region 42 A.
- the illumination sources 14 A, 14 B and the detectors 30 , 32 are shown in an exemplary orientation and can be reversed.
- the light signal 34 and the reflected light 44 are shown collimated for simplicity. However, the light signal 34 and the reflected light 44 may not be completely collimated because the illumination sources 14 A, 14 B can be extended rather than point sources.
- the focusing lens 26 in FIGS. 1 and 2 is located near an end of the tube 22 proximate the sample W. As shown in this example, the end of the tube 22 is sealed with the transmissive window 13 .
- the transmissive window 13 can be uniformly transmissive across wavelengths. To the extent it is not uniformly transmissive; the transmission characteristics of the transmissive window 13 can be taken into account for the design of the system 10 and in particular the MOE 48 .
- This embodiment may include an additional focusing lens 66 , which can be solid or have one or more apertures as shown in FIG. 1 .
- the additional focusing lens 66 is used to focus or collimate a carrier light 46 , described below, in a direction of the tube 22 .
- the focusing lens 26 focuses the reflected light 44 onto, into or near the sample W via the transmissive window 13 .
- the reflected light 44 is focused with a focal point 0-5 mm into the sample W.
- the transmissive window 13 further enables a mixing vessel or container C, which is being tested/sampled into, to remain intact.
- a one-inch (inner diameter) Swagelok® brand connector 62 available from Swagelok Corporation, Solon, Ohio, is used to connect the optical analysis system 10 to the mixing vessel C. This arrangement permits the reflected light 44 to be sent down the tube 22 (inner region 42 A), interact with the material of interest W, reflect back up the tube 22 (outer region 42 B), and be directed to the detectors 30 , 32 as further described below.
- a tube 58 defines an aperture 60 for passage of the light signal 34 in a direction of the turning mirror 24 .
- Separation of the illumination and reflection light paths or signals 44 , 46 can be further defined or separated by physically separating the inner and outer regions 42 A, 42 B employing the tube 58 . Any minimal reduction in light return of the carrier light 46 described below (caused by physical occupation of a portion of the outer region 42 B by the tube 58 ) is offset by improvement in the amount of backscattered radiation returned to the detectors 30 , 32 without encountering the sample W.
- the tube 58 is used to reduce a non-zero background measurement.
- the non-zero background measurement can occur in an optical system when a small amount of scattered light is returned to a detector even when no sample is present. Some of the scattered light can be reflected from a window, and some can come from the lenses themselves.
- FIG. 2 shows that the tube 58 placed around the mirror 24 before the lens 26 .
- the tube 58 reduces background signals by separating the excitation and collection light paths 34 , 46 to minimize “cross-talk”.
- the tube 58 defines an aperture 60 for passage of the light signal 34 in a direction of the turning mirror 24 .
- a conical extension 58 A of the tube 58 can be placed after the mirror 24 in a direction of the detector 30 . A thickness of the tube 58 should be minimized.
- the tube 58 can have specular interior and exterior surfaces as well as a highly reflective coating 58 B, such as gold, applied by electrolysis deposition, evaporation or other thin film coating method.
- the coating 58 B reflects rays 34 , 46 that would ordinarily terminate at a surface of the tube 58 back into respective optical paths from which they came.
- An image of the illumination source 14 A, 14 B may be vignetted, but the “lost” light in the image is still focused to a spot within the zone illuminated by the illumination source 14 A, 14 B.
- the returning light outside the tube 58 can be kept from being lost by traveling inside an outer tube with a specular reflecting surface (not shown, but surrounding the outer light path). This will keep light loss to a minimum while keeping the input and output paths relatively isolated from one another.
- the reflected light 46 shown in FIGS. 1 and 2 travels back down the outer annular region 42 A of the sampling tube 22 , past the turning mirror 24 .
- the light 46 reaches the beam splitter 28 (one of its operating positions shown in phantom).
- the beam splitter 28 divides the light 46 with a neutral or gray spectrum, sending some of the light 46 in a direction of the first or Multivariate Optical Element (MOE) detector 30 through the MOE 48 , briefly introduced above, and through a first lens 50 onto the photo detector 52 , also briefly introduced above.
- the beam splitter 28 sends some other portion of the light 46 through a second lens 54 onto the other detector 56 , also briefly introduced above.
- MOE Multivariate Optical Element
- some detectors suitable for use as the detectors 52 , 56 include:
- a gain mechanism 64 is in communication with the detectors 30 , 32 and the MOE 48 .
- the gain mechanism 64 weights a magnitude of the property of an orthogonal component of a portion of the carrier light 48 as described, for instance, by Myrick et al. in U.S. Pat. No. 6,198,531 B1 and in U.S. Pat. No. 6,529,276 B1 to Myrick, which are both incorporated herein by reference thereto.
- Exemplary optical computing systems are also discussed in U.S. Pat. No. 7,123,844 to Myrick, which is also incorporated by reference herein.
- a system 68 using an electrochemical or chemometric model can be employed to make similar or same measurements of the light 46 reflected from the sample W as the measurements described in the foregoing embodiments.
- system 68 may be provided using one or more computing devices, such as general-purpose computers adapted by analysis software.
- system 68 may comprise one or more evaluation circuits that provide a result indicative of the property (properties) of interest by manipulating the detector signals through addition, subtraction, amplification, and other circuitry.
- the system 68 may be one as described by Myrick et al. in PCT Application Number PCT/US2004/043742, based on U.S. Provisional Application No. 60/533,570, filed Dec. 31, 2003, which are incorporated herein by reference to these applications.
- the beam splitter 28 is not required in an alternative embodiment of the invention in which a signal from the sample W is analyzed using a PCR-type model in an off-line approach.
- This alternative embodiment and approach is useful, for instance, for studying signals independently. More particularly, a system substantially as described above but without the beam splitter 28 is used to take an integral of the light on a detector similar to the detector 30 described above. By analyzing frequency-dependent intensities, results similar to those of the foregoing embodiment are produced, although possibly with a relatively slower response time in the present embodiment.
- one or more optical analysis systems can operate in a transmission mode in conjunction with the foregoing embodiments.
- light is directed (passes) through the sample W, e.g., a fluid sample, and collected on another side of the sample W to enable study of particle density in the fluid in conjunction with the chemical content described above.
- the system 10 can be configured to operate in transmission mode where the light is shone through the sample W to a similar detection system 110 as shown in FIG. 1 in phantom for clarity.
- a mirrored surface 210 can be placed within the transmissive sample W to reflect the light back into the system 10 .
- a second exemplary embodiment of the present subject matter is designated generally by reference number 110 .
- Many aspects of the optical analysis system 110 and related components are similar to the foregoing embodiment; thus, for the sake of brevity, only certain differences are described below. However, to provide a full and enabling disclosure of the optical analysis system 110 , when like or similar elements and components are not specifically described below; implicit reference is made to the foregoing descriptions.
- the optical analysis system 110 broadly includes a housing 112 , an illumination or light source 114 , a chopper wheel 118 , one or more spectral elements 120 , a focusing lens 126 , a beam splitter 128 , a first detector 130 including a multivariate optical element 148 , and a second detector 132 .
- the optical analysis system 110 further includes an electrical connection 160 , a pressurization sensor 162 and a purge gas assembly 164 , which those skilled in the art will readily understand; therefore, further description is not necessary to understand and practice these aspects of the invention.
- the illumination source 114 provides a light 134 , which passes through a collecting Fresnel lens 116 A and into and through the spectral element(s) 120 .
- the illumination source 114 is rated for at least about 10,000 hours of operation, which alleviates a need for redundant illumination sources though they may be provided if desired.
- the collecting Fresnel lens 116 A is sized to be about 1.5 square inches and is spaced about 0.6 inches from the illumination source 114 . These dimensions can be adjusted according to particular system requirements and are not meant as limitations.
- the light 134 passes through the spectral elements 120 , which filter out undesired wavelengths to define a desired spectral region, e.g., 1500-2000 nm, in order to target a particular chemical material of interest.
- the light 134 is focused by focusing Fresnel lens 116 B, which is also sized to be about 1.5 square inches and spaced about 1 inch from the chopper wheel 118 .
- the chopper wheel 118 reflects a portion of light 134 as a calibration or reference light 135 and a transmitted light 144 .
- Calibration light 135 is collimated by lens 158 before reflecting from a first mirror 124 A through an adjustable aperture 112 B in a bulkhead 112 A of the housing 112 .
- the aperture 112 B is adjustable to dictate a desired amount of the calibration light 135 .
- calibration light 135 impinges on beam splitter 128 thereby sending a portion 135 A of calibration light 135 to the first MOE detector 130 and a portion 135 B of calibration light 135 to the second or baseline detector 132 .
- FIG. 3 further illustrates that transmitted light 144 passes from the chopper wheel 118 into a collimating Fresnel lens 136 , which in this example is sized to be about 1.5 square inches and is spaced about 0.6 inches from the chopper wheel 118 .
- the transmitted light 144 passes through another adjustable aperture 112 C in the bulkhead 112 A and impinges upon a second mirror 124 B, which directs the transmitted light 144 toward a sample in a container C, such as mixing vat or blender.
- a container such as mixing vat or blender.
- the container could be a conveyor belt or other device for holding or transporting the sample and is not limited to an enclosed container.
- the transmitted light 144 is focused by the focusing Fresnel lens 126 , which in this example may be round and about 15/16 inches in diameter and is adjustable with an inner tube 122 . Also in this example, lens 126 may be positioned about 0.6 inches from an outer surface of the container C. As shown, the transmitted light 144 , now focused, passes through a transmissive window 113 , which in this example is approximately 1 inch in diameter and with an anti-reflective (AR) coating disposed on one or both sides of the lens 126 . The AR coating ensures that the chemical process in the container C does not interfere with the measuring process of optical analysis system 110 .
- AR anti-reflective
- the transmitted light 144 enters the container C and reflects from the sample as a carrier light 146 .
- the sample can be a moving mixture such as aspirin and an excipient being blended in real time, or a plurality of tablets passing by on a conveyor belt at high speed.
- FIG. 3 further illustrates that the carrier light 146 is directed by the tube 122 in a direction of the first detector 130 .
- the carrier light 146 impinges on the beam splitter 128 and a portion passes in a direction of the detector 132 for baselining with the portion 135 B of the calibration light 135 .
- Another portion of the carrier light 146 passes through MOE 148 , which as noted above, has been selected for the chemical of interest based on the various components of the system 110 .
- that portion of the carrier light 146 having passed through the MOE 148 , is focused by lens 150 and received by the detector 152 .
- the two signals collected by the detectors 132 and 152 can be manipulated, e.g., mathematically, to extract and ascertain information about the sample carried by the carrier light 146 .
- the housing 16 can be shaped as a square, an oval, or in a variety of other shapes.
- a variety of light sources can be substituted for those described above. It is intended to claim all such changes and modifications as fall within the scope of the appended claims and their equivalents.
- an MOC system such as system 10 or 110 as described above, allows for the collection of the entire spectral range of testing simultaneously. This fact is notably different than either a system based on either a scanning lamp or detector system or a discrete diode array detection system.
- the ability to monitor over the complete spectral range of interest opens up a re-definition of the term “real-time” measurement and analysis.
- Process data can be obtained in an instantaneous or near-instantaneous manner through using the disclosed measurement techniques to directly monitor materials of interest while such materials are undergoing process steps. Long delays due to processing of measurement signals are avoided by optically processing the light as it is reflected from the material(s) of interest.
- Embodiments of the systems and methods disclosed herein can be utilized in analyzing solids, solutions, emulsions, gases, and dispersions, for example.
- exemplary embodiments discussed herein use reflectance measurements, measurements in a transmission or transflectance mode would also be appropriate.
- the presently-disclosed technology can be applied to real-time measurements for a range of industrial applications. These include, but are not limited to monitoring of the blending of pharmaceutical powders, including excipients, additives, and active pharmaceutical materials; blending of other powders, including food and chemicals; monitoring dispersions and bi-phasic mixtures (such as insulin, emulsions); and oil and gas applications, including analyzing water content in oil, or oil content in water.
- transmissive window provides physical separation between the measuring device and the process or material being tested. Therefore, this window allows for in-line measurement and/or non-invasive measurement of parameters such as chemical functionality, including alcohol content of petroleum fractions or tackifier resins.
- Environmental applications are also conceivable, such as stack gas analysis, including measurement of NOx, SOx, CO, CO2, or other gases in a gas stream; wastewater analysis and treatment monitoring; and hazardous substance monitoring applications such as mercury vapor detection.
- FIG. 4 is a block diagram illustrating an exemplary measurement setup.
- a container C which may comprise a pipe or conveyor, is used to transport one or more materials of interest.
- Materials in container C are shown as two generalized masses 250 and 254 with a gap 252 therebetween.
- gap 252 may represent the space between two samples on a conveyor or a break in continuous material.
- Gap 252 may represent another material, such as a gas bubble in a pipe.
- materials may move through or occupy a container with no gaps or breaks.
- Exemplary optical analysis system 210 is configured to perform optical measurements of materials therein via transmissive window 213 .
- container C comprises a closed container
- connector 262 may be used at an opening in the container.
- container C comprises an open container (e.g. a conveyor or open mixing vat)
- no connector may be necessary.
- Connection 270 represents the exchange of data between components of system 210 and a computing device 268 , shown here as a personal computer.
- Screen 268 a of computing device 268 may be used to provide data to one or more users, such as a technician or engineer monitoring one or more properties of a material of interest.
- Connection 270 may comprise any number and type(s) of connections, including wired or wireless network connections (such as Ethernet or 802.11-compliant wireless connections), serial connections, and the like.
- Computing device 268 may be located proximate to analysis system 210 or may be remotely connected thereto via, for example, a wide-area network such as the Internet.
- computing device 268 need not comprise a computer, but may instead comprise one or more evaluation circuits constructed to provide output(s) indicative of the property (properties) of interest in response to the detector signal values.
- An optical analysis system such as system 10 , 110 , 210 as shown in FIGS. 1 , 3 , and 4 can be used to perform chemometric analysis to develop a correlation between characteristics of a set of spectra and a system variable.
- a system may be used to determine the concentration of an analyte in a mixture.
- the optical computing (or chemometric) model is only as good as the data used to develop it. Using a model on a set of data that was generated and collected for a different environment can lead to spurious results. Even worse, a sample from effectively a different system could produce a system output that falls within the range of expected outputs and the concentration is erroneously reported.
- optical computing can be used to identify out-of-specification results.
- system 210 of FIG. 4 may be used to determine the concentration of an analyte, such as water, in a mixture, such as dog food produced by a facility.
- container C may represent a pipe through which dog food 250 is transferred after mixing.
- computing device 268 can provide output data including the water concentration in dog food samples.
- problems could develop if a different material moves through the pipe.
- material 254 may represent cat food also produced by the facility.
- a dog food process may have ended and switched to production of cat food that is transferred using the same pipe (container C).
- a production error may result in unintentional routing of cat food 254 through container C.
- the measurement data may be too ambiguous for a technician or other responsible person to discern the change from dog food to cat food.
- the optical analysis system may not be able to provide any measurement at all, or may provide clearly inaccurate measurements.
- the expected moisture content of dog food 250 may range from 11% to 15%.
- the output moisture content may be spurious enough (e.g. 0%, 100%, etc.) to indicate a problem. However, this may not always be the case.
- the properties of dog food 250 and cat food 254 may be similar enough for the optical analysis system to provide output that results in an indicated moisture content falling within the expected output of 11% to 15% in this example.
- the moisture content is likely to be unreliable, since the measurement model is developed for dog food 250 and not cat food 254 .
- the model developed for dog food analysis may inadvertently provide erroneous output without any indication that the output is erroneous.
- PCA principal component analysis
- PLS partial least squares
- Other regression methods to analyze sets of data to assess relationships within the data.
- One such determination is to categorize the data, even as basic as effectively saying “these data have a relationship” while “these other data do not have such a relationship.”
- This categorization can be termed classification.
- This technique has been applied to data in fields such as environmental, GIS, human health, chemical analysis, and drug discovery.
- An important aspect in analyzing large data sets is the ability to identify spurious or outlying data that could influence the general conclusions about the data.
- optical computing can be used to perform classification analysis. This classification can enable an instantaneous determination of whether a given measurement is valid.
- signal A is the signal at the detector 52 ( FIG. 1 ) with the Multivariate Optical Element (MOE) and signal B is the reference signal at a second detector 56 ( FIG. 1 ).
- the ratio of A/B provides a referenced signal and measurement of the dependent variable of interest. Because the detectors used in this ASMOC system are broadband detectors, signals A and B are the sum of all wavelengths of that light. By analyzing signals A, B, and A/B independently, it is possible to develop additional information about the measurement and the validity of it. In particular, by analyzing the relationship between signal A and signal B, the relationship between the two can be used to define the “expected performance” and the expected range of results for the data set used to develop the model.
- the result in general is a line, the slope of which is a function of the MOE used to make the measurement.
- statistical analysis such as mean, standard deviation, 95% confidence interval, or others, can be used to determine the range of expected results for a given model system.
- the present subject matter is not limited to any particular type or number of detectors.
- two detector signals are used along with calibration data to classify measurements since the exemplary optical analysis systems utilize two detectors.
- other optical analysis systems may utilize three or more detectors for data classification and/or measurement purposes.
- Appropriate calibration and classification models can be prepared for use in such optical analysis systems in accordance with the subject matter discussed herein.
- a single value decomposition was performed on the Calibration data and regression vectors were calculated retaining varying numbers of principal components.
- the dot product of the calculated regression vector with the spectra is plotted in FIG. 5 in an x-y-z graph.
- the squares are the Calibration data while the triangles are the Validation 1 data.
- the circles labeled are the Validation 2 data set, and in this example, the Validation 2 data set comprises outlier data points.
- the plot in FIG. 5 shows qualitatively that the Outlier data points are different from the Calibration and Validation 1 data points.
- the optical computing system was designed with a set of spectral elements which frame a particular wavelength region for investigation.
- a multivariate optical element (MOE) was designed using the calibration spectra in conjunction with the spectral elements. Specifically, the multivariate optical element was designed based on the data from analyzing the “Calibration” material.
- the dot product of the transmission of the total optical computing system (including the MOE) with each spectrum was calculated and labeled as Detector A.
- the dot product of the optical system without the MOE with the sample spectra is Detector B.
- FIG. 6 shows a plot of Detector B vs. Detector A for the three different data sets as the example of FIG. 4 .
- the squares represent the results in the Calibration data set
- the triangles represent the Validation 1 data set
- the circles represent the Validation 2 data set.
- a least squares fit was calculated for the combined Calibration and Validation 1 data set to produce the 2 sigma confidence interval oval labeled as “boundary” in FIG. 6 .
- This oval is a measure of approximately the 95% confidence interval of the data.
- the same dot products were then calculated for the Validation 2 spectral data and the Detector A and Detector B responses plotted as shown by the circles in FIG. 6 .
- the fact that these circles all fall outside of the 2-sigma oval indicates that these samples are in a different system and the model developed for the Calibration set would not be expected to accurate for this Validation 2 set.
- an optical analysis system can utilize classification data such as the oval labeled “boundary” in FIG. 6 as a pass/fail determination regarding specific samples.
- multiple boundaries can be defined whereby an optical analysis system can determine the 80%, 90%, etc. confidence intervals, which can be used to identify a particular sample as within or outside of the expected universe.
- a software application, routine, process, or sub-process may be provided to analyze detector outputs and provide classifying information based on validation data.
- the oval labeled as “boundary” in FIG. 6 may be defined as a mathematical function of the signals provided by Detector A and Detector B.
- the relative location of the data point as compared to the boundary can be determined and the classifying information can indicate whether the data point is inside, outside, or at the boundary.
- any appropriate computational method may be used to make the determination and the use of spatial terms (e.g. “inside,” “outside,” etc.) is for purposes of explanation only.
- validation data may comprise one or more stored records of groupings of data points, such as a first range of data points grouped as “valid,” a second range of data points groups as “invalid,” and so on.
- classification would then be a matter of accessing the record(s) and determining which group a particular data point is associated with.
- the data points themselves may be stored, or particular ranges may be identified by minimum and maximum values.
- one or more validation/classification circuits may be constructed to provide classification information based on the values of the detector signals. For example, based on the calibration data points, components can be selected so that the output of the circuit(s) vary in a manner consistent with the validation/classification results. For instance components may be selected so that, for detector signal values that correspond to data points in the “valid” range, the classification circuit provides a logical “TRUE” while providing a logical “FALSE” for detector signal values that correspond to data points in the “invalid” range.
- the TRUE/FALSE indicator i.e. classification data
- FIG. 7 is another 2-D graph of calibration data points.
- hypothetical calibration data points are illustrated as a plurality of “X”s in the graph.
- the hypothetical data points appear in several dispersed clusters.
- Five boundaries are defined in this example: boundaries b 1 - 1 , b 1 - 2 , and b 1 - 3 each define a cluster; boundary b 2 defines an area comprising the clusters b 1 - 1 and b 1 - 3 and some additional data points, while boundary b 3 defines an area including all hypothetical data points.
- the various boundaries b 1 , b 2 , and b 3 may be used to define validation data that comprises multiple confidence levels. For instance, data points within either of boundaries b 1 - 1 , b 1 - 2 , or b 1 - 3 may be deemed to lie in a “high” confidence level due to the clusters in those areas. Data points within boundary b 2 may be deemed to lie in a “medium” confidence level since the calibration data indicates a possibility of data points in the area, but not as high a possibility as compared to the clusters. Data points within boundary b 3 may be deemed to lie in a “low” confidence area, since it is possible for data points to be valid in the area but not likely.
- Data points outside boundary b 3 may be deemed to lie in a “no” confidence area since, in this example, no calibration data points occur outside boundary b 3 . It will be understood, of course, that these exemplary data points and boundaries are hypothetical in nature and are not intended to represent any real materials or test results.
- Data defining boundaries b 1 , b 2 , and b 3 may be provided for use in evaluating optical analysis system measurements.
- software and/or hardware may evaluate a measurement data point based on the validation data to determine a confidence level of a measurement derived from the data point.
- the classification process can include more sophisticated logic. For example, a routine may first determine if a data point lies within boundary b 3 ; if so, the data point may be evaluated to determine which (if any) further boundary the point lies within, and so on. Similarly, if an evaluation circuit or circuits are constructed, then the circuit can be designed so that the range of possible outputs of the circuit varies according to the confidence level.
- Output for the different confidence levels may be provided in any suitable manner. For example, if the boundaries define different percentage levels of confidence, the confidence level can be output to a display alongside measurement results. Alternatively or additionally, an indicator, such as a colored light associated with each level (e.g. green for “high confidence”, yellow for “medium confidence”, red for “low confidence,” and blinking red for “no confidence”).
- an indicator such as a colored light associated with each level (e.g. green for “high confidence”, yellow for “medium confidence”, red for “low confidence,” and blinking red for “no confidence”).
- confidence levels could be evaluated across a continuous spectrum by an appropriate mathematical model constructed from calibration data.
- a manufacturer or other entity building or configuring an optical analysis system can obtain calibration data to construct one or more multivariate optical elements for use in the system.
- the same calibration data can be used to construct one or more validation models. This is shown in exemplary process 1000 of FIG. 8 .
- a calibration data set is received or prepared. For example, a manufacturer may receive test results from a plurality of samples having known properties.
- one or more multivariate optical elements (MOEs) are constructed or configured based on the calibration data set.
- a validation model or models are prepared. Calibration data can be evaluated in any suitable way in order to prepare validation data for use in classifying optical analysis system measurements.
- one or more equations or models may be developed based on calibration data, and/or listings of data points and associated classifications may be prepared based in whole or in part on test results.
- the particulars of the model(s) will depend on the needs of the end user, such as desired granularity and type of classification. For instance, some users may want a binary “valid” or “invalid” indication while others may desire a percentage indicator of confidence.
- the model(s) are packaged into suitable validation data or system components are configured according to the model.
- the models may be converted into one or more files stored in computer-readable media if a digital computer is used to classify/validate results.
- the particular format and data structures that are used can vary, of course. If one or more analog circuits are used to classify/validate results, then circuit components (e.g. resisters, capacitors, inductors, transistors, logic components, etc.) are selected and arranged to provide classification data in accordance with the model.
- both the multivariate optical element and validation data are provided to the end user.
- one or more validation files may be provided for a particular multivariate optical element.
- the models can be provided to an end-user of the optical analysis system as validation data for use in the validation/classification process.
- additional validation files or circuits with appropriate responses for the additional material(s) can be provided.
- FIG. 9 illustrates an exemplary process 1100 that may be carried out to classify signals obtained using an optical analysis system.
- process 1100 may represent a software routine, process, or component whereby one or more measurements may be classified based on the values of light signals that are used to obtain the measurements.
- some or all aspects of the process could be implemented using specialized hardware, in which case validation data would not be accessed inasmuch as the data would be embodied in the circuitry used to evaluate measurement signals.
- a combination of hardware- and software-based classification/evaluation may be used, of course.
- the validation process may be carried out alone or alongside or as part of one or more other processes, such as chemometric or other analysis of data. For instance, in some embodiments, one or more classification processes using data from an optical analysis system are carried out in parallel, shortly after, or shortly before one or more other processes that provide a substantive measurement based on the data.
- validation data is accessed. For example, one or more data files comprising validation data for use with a particular multivariate optical element may be accessed.
- measurement data is accessed or received. For example, signals from sensors, such as Signal A and Signal B, may be received from an optical analysis system, with classification occurring in real time or near real-time as the data is received. As another example, stored data representing Signal A and Signal B may be accessed for off-line classification and/or analysis.
- the measurement data is evaluated based on the validation data, and at 1108 classification data is generated. The evaluation process and resulting classification will depend on factors such as the type of validation model as well as the types and degree of granularity provided for classification.
- one or more indicators are provided to indicate the classification results.
- classification may be indicated using color-coded lights or data outputs, such as confidence percentages.
- the type of indication if any, may depend on the classification results in some embodiments. Additionally, end-users and/or the system manufacturer may specify the type of indicators and the conditions that trigger the indicators. Any suitable indicator or indicators may be used however, including, but not limited to, visual effects (e.g. colors, flashing lights, icons), sound effects (such as computer sound effects, alarm klaxons), and the like.
- Indicators may also comprise data that is sent to other systems, such as other computer or control systems in a facility. In some embodiments, indicators may not always be provided at the time data is classified, and so step 1110 is illustrated using dashed lines. For instance, measurements may be classified and the classification data stored for later analysis.
- process 1100 is shown to loop back to 1104 from 1108 in order to represent ongoing classification of data. However, it will be understood that looping need not necessarily occur; for instance, if no more measurement data remains (i.e. a particular measurement cycle is complete or a stored set of data has been classified), then the process can end.
Abstract
Description
y=a 0 +a 1 w 1 +a 2 w 2 + . . . +a 10 w 10 (“
where y is ethylene content, an are constants determined by the regression analysis, and wn is light intensity for each wavelength band.
x 1 z 1 +x 2 z 2 + . . . +x n z n.
y=a 0 +a 1 x 1 +a 2 x 2 +a 3 x 3 +a 4 x 4 (“
y=a 0 +b 1 u 1 +b 2 u 2 + . . . +b n u (“Equation 3”)
TABLE 1 |
Properties of Select Transmitting Materials |
SWL | LWL | Solubility | Hardness | MP | pH | |||
Material | Comments | cm − 1 | cm − 1 | RI | g/100 g | Kg/ |
° C. | Range |
AMTIR | SeAsGe glass, brittle | 11000 | 593 | 2.5 | 0 | 170 | 370 | 1-9 |
BaF2 | Barium Fluoride | 66600 | 691 | 1.45 | 0.17 | 82 | 1280 | 5-8 |
Ca F2 | Calcium Fluoride | 79500 | 896 | 1.4 | 0.0017 | 158 | 1360 | 5-8 |
CsI | Cesium Iodide, very | 42000 | 172 | 1.73 | 44 | 20 | 621 | NA |
hygroscopic, Somewhat | ||||||||
Toxic | ||||||||
Diamond | Type IIa, strong IR | 30000 | <2 | 2.4 | 0 | 5700 | 550 fp | 1-14 |
absorbance between | ||||||||
2700-1800 cm − 1, costly | ||||||||
Ge | Germanium, brittle, | 5500 | 432 | 4 | 0 | 780 | 936 | 1-14 |
becomes opaque at | ||||||||
elevated temperatures | ||||||||
KBr | Potassium Bromide, | 48800 | 345 | 1.52 | 53 | 6 | 730 | NA |
most widely used for | ||||||||
mid-IR applications | ||||||||
KCl | Potassium Chloride | 55600 | 385 | 1.45 | 35 | 7 | 776 | NA |
KRS-5 | Thallium Bromide/ | 17900 | 204 | 2.37 | 0.05 | 40 | 414 | 5-8 |
Thallium Iodide, | ||||||||
Extremely Toxic! | ||||||||
NaCl | Sodium Chloride | 52600 | 457 | 1.49 | 36 | 18 | 801 | NA |
Polyethylene | For Far-IR, swells with | 625 | <4 | 1.52 | 0 | 110 | 1.5-14 | |
some organic solvents | ||||||||
SiO2 | Silicon Dioxide | 50000 | 2315 | 1.53 | 0 | 460 | 1713 | 1-14 |
Si | Silicon, strong IR | 8900 | 624.30 | 3.41 | 0 | 1150 | 1420 | 1-12 |
absorbance between | ||||||||
624-590 cm − 1 | ||||||||
ZnS | Zinc Sulfide | 17000 | 690 | 2.2 | 0 | 240 | 1830 | 5-9 |
ZnSe | Zinc Selenide | 15000 | 461 | 2.4 | 0 | 120 | 1526 | 5-9 |
Note: | ||||||||
To convert from wavenumber (cm − 1) to wavelength (μm), divide 10,000 by the wavenumber; e.g., 5500 cm − 1 is equivalent to 1.8 μm or 1800 nm. | ||||||||
SWL—Shortest wavelength for transmission, 1 mm, 50% transmission | ||||||||
LWL—Longest wavelength for transmission, 1 mm, 50% transmission | ||||||||
RI—Refractive Index, at relevant wavelength | ||||||||
MP—Melting point | ||||||||
pH—negative log of hydrogen ion concentration |
TABLE 2 | |||||
Wave | Cut Off | Operating | |||
Range | Detectivity | Frequency | Temperature | ||
Detector | Types1 | (λμ) | D2 | (Hz) | (K) |
Pt—S | PV | 0.35-0.6 | 30 | 108 | 295.0 |
Si p-n PD | PV | 0.4-1.0 | 50 | 107 | 295.0 |
Si p-i-n PD | PV | 0.4-1.1 | 80 | 108 | 295.0 |
Si APD | PV | 0.4-0.8 | 80 | 1010 | 295.0 |
Ge p-n PD | PV | 0.6-1.8 | 50 | 107 | 295.0 |
InSb p-n PD | PV | 3.0-6.2 | 8 | 5 × 10² | 77.0 |
PbSnTe p-n PD | PV | 5.0-11.4 | >15-60 V/W | 10 | 77.0 |
PbS | PC | 0.5-3.8 | 15.00 | 300 | 196.0 |
PbSe | PC | 0.8-4.6 | 3.00 | 3 × 10³ | 196.0 |
PbTe | PC | 0.8-5.5 | 0.16 | 3 × 10³ | 196.0 |
p-InSb | PC | 2.0-6.7 | 2.00 | 2 × 10⁵ | 77.0 |
n-InSb | PC | 1.0-3.6 | 30.00 | 2 × 10⁶ | 195.0 |
PbSnTe | PC | 5.0-11.0 | 1.7 | 8 × 10⁵ | 4.2 |
CdHgTe | PC | 5.0-16.0 | 3.00 | 104 | 4.2 |
Ge: Au | PC | 2.0-9.5 | 0.02 | 104 | 77.0 |
Ge: Zn, Au | PC | 5.0-40.0 | 1.00 | 103 | 4.2 |
Ge: Cu | PC | 5.0-30.0 | 3.00 | 103 | 4.2 |
Si: A1 | PC | 2.0-16.0 | 1.00 | 104 | 27.0 |
Si: Sb | PC | 2.0-31.5 | 1.80 | 104 | 4.0 |
ATGS | TC | 1-1000 | 0.030 | 10 | 295.0 |
(Ba, Sr)TiO3 | TC | 1-1000 | 0.011 | 400 | 295.0 |
Si | — | 0.2-1.1 | — | — | — |
Ge | — | 0.4-1.8 | — | — | — |
InAs | — | 1.0-3.8 | — | — | — |
InGaAs | — | 0.8-3.0 | — | — | — |
InSb | — | 1.0-7.0 | — | — | — |
InSb (77 K) | — | 1.0-5.6 | — | — | — |
HgCdTe (77 K) | — | 1.0-25.0 | — | — | — |
Note 1: | |||||
PV—photo transistor type; PC: photo conductive detector type; TC: pyroelectric detector type | |||||
Note 2: | |||||
(1010 cmHz1/2 W1) |
Claims (29)
Priority Applications (1)
Application Number | Priority Date | Filing Date | Title |
---|---|---|---|
US12/295,631 US9170154B2 (en) | 2006-06-26 | 2007-06-26 | Data validation and classification in optical analysis systems |
Applications Claiming Priority (3)
Application Number | Priority Date | Filing Date | Title |
---|---|---|---|
US81641606P | 2006-06-26 | 2006-06-26 | |
PCT/US2007/072095 WO2008002903A2 (en) | 2006-06-26 | 2007-06-26 | Data validation and classification in optical analysis systems |
US12/295,631 US9170154B2 (en) | 2006-06-26 | 2007-06-26 | Data validation and classification in optical analysis systems |
Publications (2)
Publication Number | Publication Date |
---|---|
US20090299946A1 US20090299946A1 (en) | 2009-12-03 |
US9170154B2 true US9170154B2 (en) | 2015-10-27 |
Family
ID=38846459
Family Applications (1)
Application Number | Title | Priority Date | Filing Date |
---|---|---|---|
US12/295,631 Active 2032-05-07 US9170154B2 (en) | 2006-06-26 | 2007-06-26 | Data validation and classification in optical analysis systems |
Country Status (3)
Country | Link |
---|---|
US (1) | US9170154B2 (en) |
EP (1) | EP2033196A2 (en) |
WO (1) | WO2008002903A2 (en) |
Cited By (9)
Publication number | Priority date | Publication date | Assignee | Title |
---|---|---|---|---|
US20120236301A1 (en) * | 2011-03-18 | 2012-09-20 | Seiko Epson Corporation | Measurement apparatus and measurement method |
US20130284897A1 (en) * | 2012-04-26 | 2013-10-31 | Robert Freese | Methods and Devices for Optically Determining A Characteristic of a Substance |
US9297254B2 (en) | 2011-08-05 | 2016-03-29 | Halliburton Energy Services, Inc. | Methods for monitoring fluids within or produced from a subterranean formation using opticoanalytical devices |
US9395306B2 (en) | 2011-08-05 | 2016-07-19 | Halliburton Energy Services, Inc. | Methods for monitoring fluids within or produced from a subterranean formation during acidizing operations using opticoanalytical devices |
US9441149B2 (en) | 2011-08-05 | 2016-09-13 | Halliburton Energy Services, Inc. | Methods for monitoring the formation and transport of a treatment fluid using opticoanalytical devices |
US20160282313A1 (en) * | 2015-03-26 | 2016-09-29 | General Electric Company | Trace Gas Measurement Apparatus for Electrical Equipment |
US9464512B2 (en) | 2011-08-05 | 2016-10-11 | Halliburton Energy Services, Inc. | Methods for fluid monitoring in a subterranean formation using one or more integrated computational elements |
US20180126259A1 (en) * | 2016-11-10 | 2018-05-10 | Z-Image, Llc | Laser beam detector including a light source for use in a laser attraction |
US11125681B2 (en) | 2019-01-24 | 2021-09-21 | Raven Industries, Inc. | Agricultural spectrographic composition sensor and methods for same |
Families Citing this family (54)
Publication number | Priority date | Publication date | Assignee | Title |
---|---|---|---|---|
EP1699422A4 (en) | 2003-12-31 | 2009-04-29 | Univ South Carolina | Thin-layer porous optical sensors for gases and other fluids |
US20070201136A1 (en) | 2004-09-13 | 2007-08-30 | University Of South Carolina | Thin Film Interference Filter and Bootstrap Method for Interference Filter Thin Film Deposition Process Control |
US20070166245A1 (en) | 2005-11-28 | 2007-07-19 | Leonard Mackles | Propellant free foamable toothpaste composition |
EP1955046A1 (en) | 2005-11-28 | 2008-08-13 | University of South Carolina | Method of high-speed monitoring based on the use of multivariate optical elements |
US8345234B2 (en) | 2005-11-28 | 2013-01-01 | Halliburton Energy Services, Inc. | Self calibration methods for optical analysis system |
WO2007064575A1 (en) | 2005-11-28 | 2007-06-07 | Ometric Corporation | Optical analysis system and method for real time multivariate optical computing |
US7623233B2 (en) | 2006-03-10 | 2009-11-24 | Ometric Corporation | Optical analysis systems and methods for dynamic, high-speed detection and real-time multivariate optical computing |
US8027855B2 (en) | 2006-05-30 | 2011-09-27 | Halliburton Energy Services Inc. | Methods of assessing and designing an application specific measurement system |
WO2008002903A2 (en) | 2006-06-26 | 2008-01-03 | University Of South Carolina | Data validation and classification in optical analysis systems |
US9182282B2 (en) | 2006-11-02 | 2015-11-10 | Halliburton Energy Services, Inc. | Multi-analyte optical computing system |
US8379199B2 (en) | 2006-11-02 | 2013-02-19 | Halliburton Energy Services, Inc. | Self-contained multivariate optical computing and analysis system |
US8213006B2 (en) * | 2007-03-30 | 2012-07-03 | Halliburton Energy Services, Inc. | Multi-analyte optical computing system |
US8184295B2 (en) | 2007-03-30 | 2012-05-22 | Halliburton Energy Services, Inc. | Tablet analysis and measurement system |
EP2140238B1 (en) | 2007-03-30 | 2020-11-11 | Ometric Corporation | In-line process measurement systems and methods |
US8283633B2 (en) | 2007-11-30 | 2012-10-09 | Halliburton Energy Services, Inc. | Tuning D* with modified thermal detectors |
US8212213B2 (en) | 2008-04-07 | 2012-07-03 | Halliburton Energy Services, Inc. | Chemically-selective detector and methods relating thereto |
AU2011358621B2 (en) | 2011-02-11 | 2015-05-07 | Halliburton Energy Services, Inc. | Method and apparatus to use multiple spectroscopic envelopes to determine components with greater accuracy and dynamic range |
US8908165B2 (en) | 2011-08-05 | 2014-12-09 | Halliburton Energy Services, Inc. | Systems and methods for monitoring oil/gas separation processes |
US8997860B2 (en) | 2011-08-05 | 2015-04-07 | Halliburton Energy Services, Inc. | Methods for monitoring the formation and transport of a fracturing fluid using opticoanalytical devices |
US9182355B2 (en) | 2011-08-05 | 2015-11-10 | Halliburton Energy Services, Inc. | Systems and methods for monitoring a flow path |
US9222348B2 (en) * | 2011-08-05 | 2015-12-29 | Halliburton Energy Services, Inc. | Methods for monitoring the formation and transport of an acidizing fluid using opticoanalytical devices |
US9206386B2 (en) | 2011-08-05 | 2015-12-08 | Halliburton Energy Services, Inc. | Systems and methods for analyzing microbiological substances |
US9261461B2 (en) | 2011-08-05 | 2016-02-16 | Halliburton Energy Services, Inc. | Systems and methods for monitoring oil/gas separation processes |
US8960294B2 (en) | 2011-08-05 | 2015-02-24 | Halliburton Energy Services, Inc. | Methods for monitoring fluids within or produced from a subterranean formation during fracturing operations using opticoanalytical devices |
US9222892B2 (en) | 2011-08-05 | 2015-12-29 | Halliburton Energy Services, Inc. | Systems and methods for monitoring the quality of a fluid |
US8912477B2 (en) | 2012-04-26 | 2014-12-16 | Halliburton Energy Services, Inc. | Methods and devices for optically determining a characteristic of a substance |
US9658149B2 (en) | 2012-04-26 | 2017-05-23 | Halliburton Energy Services, Inc. | Devices having one or more integrated computational elements and methods for determining a characteristic of a sample by computationally combining signals produced therewith |
US9013698B2 (en) | 2012-04-26 | 2015-04-21 | Halliburton Energy Services, Inc. | Imaging systems for optical computing devices |
US9013702B2 (en) | 2012-04-26 | 2015-04-21 | Halliburton Energy Services, Inc. | Imaging systems for optical computing devices |
US8823939B2 (en) | 2012-04-26 | 2014-09-02 | Halliburton Energy Services, Inc. | Methods and devices for optically determining a characteristic of a substance |
US8941046B2 (en) | 2012-04-26 | 2015-01-27 | Halliburton Energy Services, Inc. | Methods and devices for optically determining a characteristic of a substance |
US8780352B2 (en) | 2012-04-26 | 2014-07-15 | Halliburton Energy Services, Inc. | Methods and devices for optically determining a characteristic of a substance |
US9080943B2 (en) | 2012-04-26 | 2015-07-14 | Halliburton Energy Services, Inc. | Methods and devices for optically determining a characteristic of a substance |
US9702811B2 (en) | 2012-04-26 | 2017-07-11 | Halliburton Energy Services, Inc. | Methods and devices for optically determining a characteristic of a substance using integrated computational elements |
US9019501B2 (en) | 2012-04-26 | 2015-04-28 | Halliburton Energy Services, Inc. | Methods and devices for optically determining a characteristic of a substance |
US8879053B2 (en) | 2012-04-26 | 2014-11-04 | Halliburton Energy Services, Inc. | Devices having an integrated computational element and a proximal interferent monitor and methods for determining a characteristic of a sample therewith |
US20140067268A1 (en) * | 2012-08-30 | 2014-03-06 | Halliburton Energy Services, Inc. | Systems and Methods for Monitoring a Subsea Environment |
US9103716B2 (en) | 2012-08-31 | 2015-08-11 | Halliburton Energy Services, Inc. | Handheld characteristic analyzer and methods of using the same |
US9170208B2 (en) | 2012-08-31 | 2015-10-27 | Halliburton Energy Services, Inc. | Handheld characteristic analyzer and methods of using the same |
US9222896B2 (en) | 2012-09-14 | 2015-12-29 | Halliburton Energy Services, Inc. | Systems and methods for inspecting and monitoring a pipeline |
US8619256B1 (en) | 2012-09-14 | 2013-12-31 | Halliburton Energy Services, Inc. | Systems and methods for monitoring the properties of a fluid cement composition in a flow path |
US9176052B2 (en) | 2012-09-14 | 2015-11-03 | Halliburton Energy Services, Inc. | Systems and methods for inspecting and monitoring a pipeline |
US8765061B2 (en) | 2012-09-14 | 2014-07-01 | Halliburton Energy Services, Inc. | Systems and methods for inspecting and monitoring a pipeline |
US9086383B2 (en) | 2012-09-14 | 2015-07-21 | Halliburton Energy Services, Inc. | Systems and methods for monitoring chemical processes |
US9228940B2 (en) | 2012-09-14 | 2016-01-05 | Halliburton Energy Services, Inc. | Systems, methods, and apparatuses for in situ monitoring of cement fluid compositions and setting processes thereof |
MX367603B (en) | 2013-06-07 | 2019-08-28 | Halliburton Energy Services Inc | Discriminant analysis used with optical computing devices. |
US9186103B2 (en) * | 2013-06-11 | 2015-11-17 | Northwestern University | System and method for spin logic |
BR112015028910A2 (en) | 2013-07-09 | 2017-07-25 | Halliburton Energy Services Inc | computational elements integrated with laterally distributed spectral filters |
AU2013393869B2 (en) | 2013-07-09 | 2017-05-11 | Halliburton Energy Services, Inc. | Integrated computational elements with frequency selective surface |
BR112016002987B1 (en) | 2013-09-25 | 2022-05-31 | Halliburton Energy Services, Inc | SYSTEMS AND METHODS FOR REAL-TIME MEASUREMENT OF GAS CONTENT IN DRILLING FLUIDS |
US9836520B2 (en) | 2014-02-12 | 2017-12-05 | International Business Machines Corporation | System and method for automatically validating classified data objects |
EP3129592A4 (en) | 2014-06-13 | 2017-11-29 | Halliburton Energy Services, Inc. | Integrated computational element with multiple frequency selective surfaces |
GB2543973B (en) | 2014-08-26 | 2021-01-20 | Halliburton Energy Services Inc | Systems and methods for in situ monitoring of cement slurry locations and setting processes thereof |
GB2542309B (en) | 2014-08-26 | 2021-10-06 | Halliburton Energy Services Inc | Systems and methods for analyzing the characteristics and compositions of cement additives |
Citations (178)
Publication number | Priority date | Publication date | Assignee | Title |
---|---|---|---|---|
US3632435A (en) | 1968-07-12 | 1972-01-04 | Gylling & Co Ab | Preparation of substrate for electroless deposition |
US3717078A (en) | 1970-04-03 | 1973-02-20 | Fuji Photo Film Co Ltd | Pressure resistant underwater casing |
US3761724A (en) | 1972-07-06 | 1973-09-25 | Resalab Inc | Double beam hydrocarbon gas detector |
US4084880A (en) | 1975-01-22 | 1978-04-18 | Clow Richard G | Coherent optical computer for polynomial evaluation |
US4118106A (en) | 1976-08-02 | 1978-10-03 | Environmental Research Institute Of Michigan | Fiber optic phase correction using holograms |
JPS57142546A (en) | 1981-02-28 | 1982-09-03 | Shimadzu Corp | Infrared multiple reflection type oil concentration measuring apparatus |
US4499378A (en) | 1982-03-09 | 1985-02-12 | Horiba, Ltd. | Infrared radiation gas analyzer |
US4595832A (en) | 1984-03-30 | 1986-06-17 | The United States Of America As Represented By The United States Department Of Energy | Thermal sensor with an improved coating |
US4607914A (en) | 1983-10-12 | 1986-08-26 | Environmental Research Institute Of Michigan | Optical system design techniques using holographic optical element |
US4687337A (en) | 1981-09-02 | 1987-08-18 | The United States Of America As Represented By The Secretary Of The Air Force | Atmospheric Aerosol extinctiometer |
US4687335A (en) | 1985-12-09 | 1987-08-18 | Atlantic Richfield Company | Temperature compensation means for a radiometer |
US4704536A (en) | 1983-12-23 | 1987-11-03 | Hochiki Corporation | Gas sensor and gas detecting method |
US4821338A (en) | 1985-08-07 | 1989-04-11 | Minolta Camera Kabushiki Kaisha | Optical signal receiving apparatus with compensation for peripheral light |
US4891574A (en) | 1987-12-23 | 1990-01-02 | Mitchell Instruments Ltd. | Hygrometer with plural measuring bones and redundancy system circuit |
US4917958A (en) | 1984-12-12 | 1990-04-17 | Okuno Chemical Industry Co., Ltd. | Metal coated ceramic composition |
US4934782A (en) | 1988-01-19 | 1990-06-19 | Hughes Aircraft Company | Optical thresholding apparatus and method |
US4968148A (en) | 1984-03-01 | 1990-11-06 | Molecular Devices Corporation | Single source multi-site photometric measurement system |
US4981332A (en) | 1989-06-29 | 1991-01-01 | Hughes Aircraft Company | Dispersion-compensated windshield hologram virtual image display |
US5005946A (en) | 1989-04-06 | 1991-04-09 | Grumman Aerospace Corporation | Multi-channel filter system |
US5029245A (en) | 1987-06-25 | 1991-07-02 | Valtion Teknillinen Tutkimuskeskus | Procedure for controlling a radiation source and controllable radiation source |
US5071526A (en) | 1987-05-28 | 1991-12-10 | Neotronics Technology Plc | Acidic gas sensors and method of using same |
US5090807A (en) | 1990-01-10 | 1992-02-25 | Environmental Research Institute Of Michigan | Real time optical pre-detection processing of multispectral image data |
US5103340A (en) | 1989-02-21 | 1992-04-07 | International Business Machines Corporation | Multiple-cavity optical filter using change of cavity length |
US5137364A (en) | 1991-01-31 | 1992-08-11 | Mccarthy Cornelius J | Optical spectral analysis apparatus |
US5150236A (en) | 1990-08-31 | 1992-09-22 | Bell Communications Research, Inc. | Tunable liquid crystal etalon filter |
US5194921A (en) | 1990-02-23 | 1993-03-16 | Fuji Electric Co., Ltd. | Method and apparatus for detecting flocculation process of components in liquid |
US5223715A (en) | 1991-09-20 | 1993-06-29 | Amoco Corporation | Process for spectrophotometric analysis |
US5259381A (en) | 1986-08-18 | 1993-11-09 | Physio-Control Corporation | Apparatus for the automatic calibration of signals employed in oximetry |
US5289289A (en) | 1990-01-23 | 1994-02-22 | Olympus Optical Co., Ltd. | Image data coding apparatus and coding method for dynamic-image data |
EP0600334A2 (en) | 1992-12-01 | 1994-06-08 | Ulrich Walter Glaus | Method for the determination of materials and/or their properties and apparatus therefor |
US5321539A (en) | 1991-02-04 | 1994-06-14 | Nippon Telegraph And Telephone Corporation | Liquid crystal Fabry-Perot etalon with glass spacer |
US5406082A (en) | 1992-04-24 | 1995-04-11 | Thiokol Corporation | Surface inspection and characterization system and process |
US5412465A (en) | 1993-08-02 | 1995-05-02 | The United States Of America As Represented By The United States Department Of Energy | Method for verification of constituents of a process stream just as they go through an inlet of a reaction vessel |
JPH0753582B2 (en) | 1987-12-09 | 1995-06-07 | 株式会社ジャパンエナジー | Method for producing nickel carbonate |
US5424545A (en) | 1992-07-15 | 1995-06-13 | Myron J. Block | Non-invasive non-spectrophotometric infrared measurement of blood analyte concentrations |
US5459677A (en) | 1990-10-09 | 1995-10-17 | Board Of Regents Of The University Of Washington | Calibration transfer for analytical instruments |
US5479164A (en) | 1994-05-05 | 1995-12-26 | Yorks; Jason | Photonic data compression system and method |
US5504332A (en) | 1994-08-26 | 1996-04-02 | Merck & Co., Inc. | Method and system for determining the homogeneity of tablets |
US5513022A (en) | 1993-12-30 | 1996-04-30 | Korea Institute Of Science And Technology | Method and apparatus for direct transmission of an optical image |
US5555128A (en) | 1994-10-04 | 1996-09-10 | The United States Of America As Represented By The Secretary Of The Air Force | Phase coding technique for one-way image transmission through an aberrating medium |
WO1996030746A1 (en) | 1995-03-31 | 1996-10-03 | Board Of Regents, The University Of Texas System | Detection of cervical neoplasias using fluorescence spectroscopy |
JPH093662A (en) | 1995-06-15 | 1997-01-07 | Dowa Mining Co Ltd | Etching treatment and etching liquid for aluminum-ceramic composite substrate |
US5622868A (en) | 1989-04-27 | 1997-04-22 | Microbiological Research Authority Camr (Centre For Applied Microbiology & Research) | Analytical apparatus utilizing a colorimetric or other optically detectable effect |
US5641962A (en) | 1995-12-05 | 1997-06-24 | Exxon Research And Engineering Company | Non linear multivariate infrared analysis method (LAW362) |
US5710655A (en) | 1993-07-21 | 1998-01-20 | Apeldyn Corporation | Cavity thickness compensated etalon filter |
US5717605A (en) | 1993-10-14 | 1998-02-10 | Olympus Optical Co., Ltd. | Color classification apparatus |
US5734098A (en) | 1996-03-25 | 1998-03-31 | Nalco/Exxon Energy Chemicals, L.P. | Method to monitor and control chemical treatment of petroleum, petrochemical and processes with on-line quartz crystal microbalance sensors |
US5747806A (en) | 1996-02-02 | 1998-05-05 | Instrumentation Metrics, Inc | Method and apparatus for multi-spectral analysis in noninvasive nir spectroscopy |
US5750994A (en) | 1995-07-31 | 1998-05-12 | Instrumentation Metrics, Inc. | Positive correlation filter systems and methods of use thereof |
US5760399A (en) | 1995-10-02 | 1998-06-02 | Foss Nirsystems, Inc. | Measurement of transmission spectra of pharmaceutical tablets |
US5771096A (en) | 1994-12-09 | 1998-06-23 | Foss Electric A/S | Method of obtaining information |
US5781289A (en) | 1996-11-05 | 1998-07-14 | Sabsabi; Mohamad | Method and apparatus for rapid in situ analysis of preselected components of homogeneous solid compositions, especially pharmaceutical compositions |
US5799231A (en) | 1996-07-25 | 1998-08-25 | International Business Machines Corporation | Variable index distributed mirror |
US5828492A (en) | 1994-06-18 | 1998-10-27 | Forschungszentrum Karlsruhe Gmbh | Grating structure having a plurality of binary lamellar gratings |
US5831742A (en) | 1995-06-16 | 1998-11-03 | Sun Electric U.K. Limited | Portable electrometric apparatus for roadside analysis of automotive exhaust emission |
US5905571A (en) | 1995-08-30 | 1999-05-18 | Sandia Corporation | Optical apparatus for forming correlation spectrometers and optical processors |
JPH11506206A (en) | 1996-02-02 | 1999-06-02 | インストゥルメンテイション メトリックス,インコーポレイテッド | Method and apparatus for multispectral analysis in non-invasive infrared spectroscopy |
US5939717A (en) | 1998-01-29 | 1999-08-17 | Schlumberger Technology Corporation | Methods and apparatus for determining gas-oil ratio in a geological formation through the use of spectroscopy |
US5941821A (en) | 1997-11-25 | 1999-08-24 | Trw Inc. | Method and apparatus for noninvasive measurement of blood glucose by photoacoustics |
US5946089A (en) | 1998-07-13 | 1999-08-31 | Jordan Valley Applied Radiation Ltd. | Plasma spectrometer with shutter assembly |
US5946088A (en) | 1994-05-03 | 1999-08-31 | Pfizer Inc. | Apparatus for mixing and detecting on-line homogeneity |
US5991048A (en) | 1995-10-25 | 1999-11-23 | University Of Washington | Surface plasmon resonance light pipe sensor |
US6006585A (en) | 1997-01-25 | 1999-12-28 | Cerberus Ag | Optoacoustic gas sensor |
US6040914A (en) | 1997-06-10 | 2000-03-21 | New Focus, Inc. | Simple, low cost, laser absorption sensor system |
US6124937A (en) | 1996-11-15 | 2000-09-26 | Optosens Optische Spektroskopie Und Sensortechnik Gmbh | Method and device for combined absorption and reflectance spectroscopy |
US6137108A (en) | 1998-06-17 | 2000-10-24 | Foss Nirsystems Incorporated | Instrument and method for spectroscopic analysis by reflectance and transmittance |
US6176323B1 (en) | 1997-06-27 | 2001-01-23 | Baker Hughes Incorporated | Drilling systems with sensors for determining properties of drilling fluid downhole |
US6198531B1 (en) | 1997-07-11 | 2001-03-06 | University Of South Carolina | Optical computational system |
US6304854B1 (en) | 1999-09-09 | 2001-10-16 | Dunhill Holdings, Corp. | System and method for providing a comparable branded product based on a current branded product for non-comparison shopped products |
US20010034064A1 (en) | 1998-08-13 | 2001-10-25 | Howard Turner | Parallel reactor with internal sensing |
US6317648B1 (en) | 1996-09-06 | 2001-11-13 | Merck & Co., Inc. | Customer specific packaging line having containers with tag means containing medication order information |
US20020005108A1 (en) * | 1998-05-15 | 2002-01-17 | Ludwig Lester Frank | Tactile, visual, and array controllers for real-time control of music signal processing, mixing, video, and lighting |
US20020008215A1 (en) | 2000-04-28 | 2002-01-24 | Evans Gary A. | Grating-outcoupled surface-emitting lasers with flared gain regions |
US6347131B1 (en) | 1999-11-02 | 2002-02-12 | Cintex Limited | Non-contact volume measurement |
US6350389B1 (en) | 1998-06-12 | 2002-02-26 | The University Of Tokyo | Method for producing porous diamond |
US20020050567A1 (en) | 2000-05-30 | 2002-05-02 | Thierry Boudet | Method and apparatus for detecting gases |
US20020071118A1 (en) | 2000-12-11 | 2002-06-13 | Masashi Shinbori | Device for measurement of the spectral reflectance and process for measurement of the spectral reflectance |
US6420708B2 (en) | 2000-03-10 | 2002-07-16 | Wilks Enterprise, Inc. | Spectroscopy analyzer using a detector array |
US6430513B1 (en) | 1998-09-04 | 2002-08-06 | Perkinelmer Instruments Llc | Monitoring constituents of an animal organ using statistical correlation |
US20020109094A1 (en) | 2001-02-12 | 2002-08-15 | Alexander Goetz | System and method for combining reflectance data |
US20020108892A1 (en) | 2001-02-12 | 2002-08-15 | Alexander Goetz | System and method for grouping refelectance data |
US6437326B1 (en) | 2000-06-27 | 2002-08-20 | Schlumberger Technology Corporation | Permanent optical sensor downhole fluid analysis systems |
US6469785B1 (en) | 1996-08-16 | 2002-10-22 | Zeptosens Ag | Optical detection device based on semi-conductor laser array |
US20020154315A1 (en) | 1999-04-06 | 2002-10-24 | Myrick Michael L. | Optical computational system |
US6476384B1 (en) | 2000-10-10 | 2002-11-05 | Schlumberger Technology Corporation | Methods and apparatus for downhole fluids analysis |
US6490035B1 (en) | 1998-08-07 | 2002-12-03 | Astrazeneca Ab | Mixing apparatus |
US6517230B1 (en) | 2000-02-17 | 2003-02-11 | Astrazeneca Uk Limited | Mixing apparatus and method |
US6529276B1 (en) | 1999-04-06 | 2003-03-04 | University Of South Carolina | Optical computational system |
US20030059820A1 (en) | 1997-11-26 | 2003-03-27 | Tuan Vo-Dinh | SERS diagnostic platforms, methods and systems microarrays, biosensors and biochips |
US20030056581A1 (en) | 1999-12-02 | 2003-03-27 | Turner William Edward | Apparatus and method for analyzing fluids |
US20030071988A1 (en) | 2001-10-11 | 2003-04-17 | Baker Hughes Incorporated | Real-time on-line sensing and control of mineral scale deposition from formation fluids |
US20030094495A1 (en) | 1999-06-07 | 2003-05-22 | Metrologic Instruments, Inc. | Nuclear resonance based scanning system having an automatic object identification and attribute information acquisition and linking mechanism integrated therein |
US6573999B1 (en) | 2000-07-14 | 2003-06-03 | Nanometrics Incorporated | Film thickness measurements using light absorption |
US20030111606A1 (en) | 2000-05-10 | 2003-06-19 | Berghmans Antonius Christianus | Process for identifying objects using an optical spectrometer and a transport system |
US20030117628A1 (en) | 2001-09-07 | 2003-06-26 | Raimo Harju | Intelligent instrumentation for optical measurement of samples |
US6600560B2 (en) | 2000-05-02 | 2003-07-29 | Leica Microsystems Jena Gmbh | Optical measurement arrangement having an ellipsometer |
US6630663B2 (en) | 1998-10-21 | 2003-10-07 | Raytheon Company | Miniature ion mobility spectrometer |
US20030202179A1 (en) | 2002-04-29 | 2003-10-30 | The Curators Of The University Of Missouri | Ultrasensitive spectrophotometer |
US6667802B2 (en) | 2001-02-12 | 2003-12-23 | Analytical Spectral Devices, Inc. | System and method for self-referencing calibration |
US20040012782A1 (en) | 2002-07-19 | 2004-01-22 | Mason Thomas G. | Asphaltene aggregation in petroleum oil mixtures determined by small angle light scattering |
US6690464B1 (en) | 1999-02-19 | 2004-02-10 | Spectral Dimensions, Inc. | High-volume on-line spectroscopic composition testing of manufactured pharmaceutical dosage units |
US6697195B2 (en) | 2000-08-21 | 2004-02-24 | 3M Innovative Properties Company | Loss enhanced reflective optical filters |
US6707043B2 (en) | 1998-08-14 | 2004-03-16 | On-Site Analysis, Inc. | On-site analyzer |
US6711503B2 (en) | 1999-03-04 | 2004-03-23 | Sandia Corporation | Hybrid least squares multivariate spectral analysis methods |
US6737654B2 (en) | 1999-12-28 | 2004-05-18 | Trixell | Method for temperature compensation of an image detector |
US6741335B2 (en) | 1998-03-09 | 2004-05-25 | Otm Technologies Ltd. | Optical translation measurement |
US20040106098A1 (en) | 2002-11-04 | 2004-06-03 | Transform Pharmaceuticals | Analysis of pharmaceutical solubility and stability |
US6748334B1 (en) | 1999-12-06 | 2004-06-08 | Jorge E. Perez | Specialty gas analysis system |
WO2004057284A1 (en) | 2002-12-19 | 2004-07-08 | Koninklijke Philips Electronics N.V. | Optical analysis system |
US6771369B2 (en) | 2002-03-12 | 2004-08-03 | Analytical Spectral Devices, Inc. | System and method for pharmacy validation and inspection |
US20040160601A1 (en) | 2003-02-14 | 2004-08-19 | Womble M. Edward | Probe assemblies for Raman spectroscopy |
US6798518B2 (en) | 2002-06-04 | 2004-09-28 | Baker Hughes Incorporated | Method and apparatus for a derivative spectrometer |
US20040197850A1 (en) | 2000-02-16 | 2004-10-07 | Baer Thomas M. | Transfer film for laser microcapture |
US20040227086A1 (en) | 2003-03-07 | 2004-11-18 | Pfizer Inc | Method and device for NIR reflection spectroscopy |
US6853447B2 (en) | 2001-02-12 | 2005-02-08 | Analytical Spectral Devices, Inc. | System and method for the collection of spectral image data |
US6870629B1 (en) | 2001-10-29 | 2005-03-22 | Precision Photonics Corporation | Optical frequency sweep control and readout by using a phase lock |
US20050077476A1 (en) | 2002-11-21 | 2005-04-14 | Cdex, Inc | System and methods for detection and identification of chemical substances |
US20050087132A1 (en) | 2001-01-31 | 2005-04-28 | Planar Systems, Inc. | Methods and apparatus for the production of optical filters |
WO2005062006A1 (en) | 2003-12-19 | 2005-07-07 | Koninklijke Philips Electronics N. V. | Optical analysis system using multivariate optical elements |
WO2005062986A2 (en) | 2003-12-31 | 2005-07-14 | The University Of South Carolina | Thin-layer porous optical sensors for gases and other fluids |
US20050167264A1 (en) | 2004-01-15 | 2005-08-04 | James Sternbergh | Method and apparatus for monitoring optical characteristics of thin films in a deposition process |
US6952267B2 (en) | 2003-07-07 | 2005-10-04 | Cymer, Inc. | Method and apparatus for measuring bandwidth of a laser output |
US20050251289A1 (en) | 2002-07-25 | 2005-11-10 | Bonney Stanley G | Medicament dispenser |
US20050264815A1 (en) | 2004-05-07 | 2005-12-01 | Mark Wechsler | Sample element with fringing-reduction capabilities |
US6980285B1 (en) | 1998-06-12 | 2005-12-27 | Radiometer Medical A/S | Method in quality control of a spectrophotometer |
US20050288906A1 (en) | 2004-06-29 | 2005-12-29 | Drennen James K Iii | Spectroscopic pharmacy verification and inspection system |
US6982431B2 (en) | 1998-08-31 | 2006-01-03 | Molecular Devices Corporation | Sample analysis systems |
US6995840B2 (en) | 2002-03-06 | 2006-02-07 | Aspectrics, Inc. | Method and apparatus for radiation encoding and analysis |
US20060035018A1 (en) | 2002-11-01 | 2006-02-16 | Advance Company, Ltd. | Method for forming a thin film silver mirror and method for forming coated film comprising thin silver mirror film |
US20060051036A1 (en) | 2004-09-03 | 2006-03-09 | Treado Patrick J | Method and apparatus for fiberscope |
WO2006031733A2 (en) | 2004-09-13 | 2006-03-23 | The University Of South Carolina | Thin film interference filter and bootstrap method for interference filter thin film deposition process control |
US20060093523A1 (en) | 2004-10-29 | 2006-05-04 | Hyperteq, Lp | System, method and apparatus for mud-gas extraction, detection and analysis thereof |
WO2006064446A1 (en) | 2004-12-15 | 2006-06-22 | Koninklijke Philips Electronics N.V. | Calibration of optical analysis making use of multivariate optical elements |
US20060142955A1 (en) | 2004-12-09 | 2006-06-29 | Jones Christopher M | In situ optical computation fluid analysis system and method |
US20060153492A1 (en) | 2005-01-13 | 2006-07-13 | Komag, Inc. | Test head for optically inspecting workpieces |
US20060169902A1 (en) | 2005-02-01 | 2006-08-03 | Denso Corporation | Infrared sensor |
US20060197015A1 (en) | 2004-10-21 | 2006-09-07 | Sterling Bernhard B | Method and apparatus for determining an analyte concentration in a sample having interferents |
US7138156B1 (en) | 2000-09-26 | 2006-11-21 | Myrick Michael L | Filter design algorithm for multi-variate optical computing |
US7145145B2 (en) | 2001-09-20 | 2006-12-05 | Ndc Infrared Engineering, Ltd. | Optical window for monitoring samples |
US20060276697A1 (en) | 2005-06-07 | 2006-12-07 | Chemlmage Corporation | Non-invasive biochemical analysis |
WO2006137902A2 (en) | 2004-10-04 | 2006-12-28 | University Of South Carolina | Thermal selectivity multivariate optical computing |
US7173239B2 (en) | 2003-03-14 | 2007-02-06 | Baker Hughes Incorporated | Method and apparatus for downhole quantification of methane using near infrared spectroscopy |
US20070035737A1 (en) | 2005-08-15 | 2007-02-15 | Schlumberger Technology Corporation | Method and apparatus for composition analysis in a production logging environment |
WO2007061436A1 (en) | 2005-11-28 | 2007-05-31 | University Of South Carolina | Self calibration methods for optical analysis system |
WO2007061435A1 (en) | 2005-11-28 | 2007-05-31 | University Of South Carolina | Method of high-speed monitoring based on the use of multivariate optical elements |
WO2007062202A1 (en) | 2005-11-28 | 2007-05-31 | University Of South Carolina | Novel multivariate optical elements for optical analysis system |
WO2007062224A1 (en) | 2005-11-28 | 2007-05-31 | University Of South Carolina | Process for selecting spectral elements and components for optical analysis systems |
WO2007064578A2 (en) | 2005-11-28 | 2007-06-07 | University Of South Carolina | Optical analysis system and optical train |
US20070137292A1 (en) | 2005-12-16 | 2007-06-21 | Schlumberger Technology Corporation | Methods and apparatus for oil composition determination |
US20070201136A1 (en) | 2004-09-13 | 2007-08-30 | University Of South Carolina | Thin Film Interference Filter and Bootstrap Method for Interference Filter Thin Film Deposition Process Control |
US7271883B2 (en) | 2004-07-13 | 2007-09-18 | Newell Benjamin E | Refractive index sensor using internally reflective light beams |
US20070282647A1 (en) | 2006-05-30 | 2007-12-06 | Freese Robert P | Methods of assessing and designing an application specific measurement system |
US20070294094A1 (en) | 2006-06-20 | 2007-12-20 | Ometric Corporation | Methods of customizing, licensing and sustaining a technology option to meet a customer requirement |
WO2008002903A2 (en) | 2006-06-26 | 2008-01-03 | University Of South Carolina | Data validation and classification in optical analysis systems |
US7348493B2 (en) | 2000-09-04 | 2008-03-25 | Dowa Mining Co., Ltd. | Metal-ceramic circuit board |
US20080111064A1 (en) | 2006-11-10 | 2008-05-15 | Schlumberger Technology Corporation | Downhole measurement of substances in earth formations |
WO2008057913A2 (en) | 2006-11-02 | 2008-05-15 | University Of South Carolina | Improved signal processing for optical computing system |
WO2008057912A2 (en) | 2006-11-02 | 2008-05-15 | University Of South Carolina | Multi-analyte optical computing system |
US7411729B2 (en) | 2004-08-12 | 2008-08-12 | Olympus Corporation | Optical filter, method of manufacturing optical filter, optical system, and imaging apparatus |
EP1969326A1 (en) | 2005-11-28 | 2008-09-17 | Ometric Corporation | Optical analysis system and method for real time multivariate optical computing |
WO2008121684A1 (en) | 2007-03-30 | 2008-10-09 | University Of South Carolina | Novel multi-analyte optical computing system |
US20080309930A1 (en) | 2004-08-26 | 2008-12-18 | Koninklijke Philips Electronics N.V. | Calibration for Spectroscopic Analysis |
US20090002697A1 (en) | 2006-03-10 | 2009-01-01 | Ometric Corporation | Optical Analysis Systems and Methods for Dynamic, High-Speed Detection and Real-Time Multivariate Optical Computing |
US20090015819A1 (en) | 2003-12-22 | 2009-01-15 | Koninklijke Philips Electronics Nv | Optical analysis system, blood analysis system and method of determining an amplitude of a principal component |
US20090073433A1 (en) | 2005-11-28 | 2009-03-19 | Univeristy Of South Carolina | Optical analysis system and methods for operating multivariate optical elements in a normal incidence orientation |
US20090140144A1 (en) | 2007-11-30 | 2009-06-04 | University Of South Carolina | Tuning D* with Modified Thermal Detectors |
US7569354B2 (en) | 2004-08-03 | 2009-08-04 | Onchip Cellomics Consortium | Cellomics system |
EP2087328A2 (en) | 2006-11-02 | 2009-08-12 | Ometric Corporation | Self-contained multivariate optical computing and analysis system |
US20090250613A1 (en) | 2008-04-07 | 2009-10-08 | University Of South Carolina | Chemically-Selective Detector and Methods Relating Thereto |
EP2140238A1 (en) | 2007-03-30 | 2010-01-06 | Ometric Corporation | In-line process measurement systems and methods |
US7652767B2 (en) | 2006-10-19 | 2010-01-26 | Sporian Microsystems, Inc. | Optical sensor with chemically reactive surface |
US20100153048A1 (en) | 2007-02-28 | 2010-06-17 | Myrick Michael L | Design of multivariate optical elements for nonlinear calibration |
US20100195105A1 (en) | 2006-11-02 | 2010-08-05 | University Of South Carolina | Improved stability for optical computing system |
US20100211329A1 (en) | 2007-10-12 | 2010-08-19 | Stuart Farquharson | Method and apparatus for determining properties of fuels |
US7853104B2 (en) | 2009-01-05 | 2010-12-14 | Yokogawa Electric Corporation | Bidirectional optical module and optical time domain reflectometer |
US20100328669A1 (en) | 2007-03-30 | 2010-12-30 | Myrick Michael L | Tablet analysis and measurment system |
US7920258B2 (en) | 2005-11-28 | 2011-04-05 | Halliburton Energy Services, Inc. | Optical analysis system and elements to isolate spectral region |
US7993276B2 (en) | 2004-10-15 | 2011-08-09 | Pulse Tracer, Inc. | Motion cancellation of optical input signals for physiological pulse measurement |
-
2007
- 2007-06-26 WO PCT/US2007/072095 patent/WO2008002903A2/en active Application Filing
- 2007-06-26 US US12/295,631 patent/US9170154B2/en active Active
- 2007-06-26 EP EP20070812318 patent/EP2033196A2/en not_active Withdrawn
Patent Citations (215)
Publication number | Priority date | Publication date | Assignee | Title |
---|---|---|---|---|
US3632435A (en) | 1968-07-12 | 1972-01-04 | Gylling & Co Ab | Preparation of substrate for electroless deposition |
US3717078A (en) | 1970-04-03 | 1973-02-20 | Fuji Photo Film Co Ltd | Pressure resistant underwater casing |
US3761724A (en) | 1972-07-06 | 1973-09-25 | Resalab Inc | Double beam hydrocarbon gas detector |
US4084880A (en) | 1975-01-22 | 1978-04-18 | Clow Richard G | Coherent optical computer for polynomial evaluation |
US4118106A (en) | 1976-08-02 | 1978-10-03 | Environmental Research Institute Of Michigan | Fiber optic phase correction using holograms |
JPS57142546A (en) | 1981-02-28 | 1982-09-03 | Shimadzu Corp | Infrared multiple reflection type oil concentration measuring apparatus |
US4687337A (en) | 1981-09-02 | 1987-08-18 | The United States Of America As Represented By The Secretary Of The Air Force | Atmospheric Aerosol extinctiometer |
US4499378A (en) | 1982-03-09 | 1985-02-12 | Horiba, Ltd. | Infrared radiation gas analyzer |
US4607914A (en) | 1983-10-12 | 1986-08-26 | Environmental Research Institute Of Michigan | Optical system design techniques using holographic optical element |
US4704536A (en) | 1983-12-23 | 1987-11-03 | Hochiki Corporation | Gas sensor and gas detecting method |
US4968148A (en) | 1984-03-01 | 1990-11-06 | Molecular Devices Corporation | Single source multi-site photometric measurement system |
US4595832A (en) | 1984-03-30 | 1986-06-17 | The United States Of America As Represented By The United States Department Of Energy | Thermal sensor with an improved coating |
US4917958A (en) | 1984-12-12 | 1990-04-17 | Okuno Chemical Industry Co., Ltd. | Metal coated ceramic composition |
US4821338A (en) | 1985-08-07 | 1989-04-11 | Minolta Camera Kabushiki Kaisha | Optical signal receiving apparatus with compensation for peripheral light |
US4687335A (en) | 1985-12-09 | 1987-08-18 | Atlantic Richfield Company | Temperature compensation means for a radiometer |
US5259381A (en) | 1986-08-18 | 1993-11-09 | Physio-Control Corporation | Apparatus for the automatic calibration of signals employed in oximetry |
US5071526A (en) | 1987-05-28 | 1991-12-10 | Neotronics Technology Plc | Acidic gas sensors and method of using same |
US5029245A (en) | 1987-06-25 | 1991-07-02 | Valtion Teknillinen Tutkimuskeskus | Procedure for controlling a radiation source and controllable radiation source |
JPH0753582B2 (en) | 1987-12-09 | 1995-06-07 | 株式会社ジャパンエナジー | Method for producing nickel carbonate |
US4891574A (en) | 1987-12-23 | 1990-01-02 | Mitchell Instruments Ltd. | Hygrometer with plural measuring bones and redundancy system circuit |
US4934782A (en) | 1988-01-19 | 1990-06-19 | Hughes Aircraft Company | Optical thresholding apparatus and method |
US5103340A (en) | 1989-02-21 | 1992-04-07 | International Business Machines Corporation | Multiple-cavity optical filter using change of cavity length |
US5005946A (en) | 1989-04-06 | 1991-04-09 | Grumman Aerospace Corporation | Multi-channel filter system |
US5622868A (en) | 1989-04-27 | 1997-04-22 | Microbiological Research Authority Camr (Centre For Applied Microbiology & Research) | Analytical apparatus utilizing a colorimetric or other optically detectable effect |
US4981332A (en) | 1989-06-29 | 1991-01-01 | Hughes Aircraft Company | Dispersion-compensated windshield hologram virtual image display |
US5090807A (en) | 1990-01-10 | 1992-02-25 | Environmental Research Institute Of Michigan | Real time optical pre-detection processing of multispectral image data |
US5289289A (en) | 1990-01-23 | 1994-02-22 | Olympus Optical Co., Ltd. | Image data coding apparatus and coding method for dynamic-image data |
US5194921A (en) | 1990-02-23 | 1993-03-16 | Fuji Electric Co., Ltd. | Method and apparatus for detecting flocculation process of components in liquid |
US5150236A (en) | 1990-08-31 | 1992-09-22 | Bell Communications Research, Inc. | Tunable liquid crystal etalon filter |
US5459677A (en) | 1990-10-09 | 1995-10-17 | Board Of Regents Of The University Of Washington | Calibration transfer for analytical instruments |
US5137364A (en) | 1991-01-31 | 1992-08-11 | Mccarthy Cornelius J | Optical spectral analysis apparatus |
US5321539A (en) | 1991-02-04 | 1994-06-14 | Nippon Telegraph And Telephone Corporation | Liquid crystal Fabry-Perot etalon with glass spacer |
US5223715A (en) | 1991-09-20 | 1993-06-29 | Amoco Corporation | Process for spectrophotometric analysis |
US5406082A (en) | 1992-04-24 | 1995-04-11 | Thiokol Corporation | Surface inspection and characterization system and process |
US5424545A (en) | 1992-07-15 | 1995-06-13 | Myron J. Block | Non-invasive non-spectrophotometric infrared measurement of blood analyte concentrations |
US5737076A (en) | 1992-12-01 | 1998-04-07 | Glaus; Ulrich Walter | Method and apparatus for determining substances and/or the properties thereof |
EP0600334A2 (en) | 1992-12-01 | 1994-06-08 | Ulrich Walter Glaus | Method for the determination of materials and/or their properties and apparatus therefor |
US5710655A (en) | 1993-07-21 | 1998-01-20 | Apeldyn Corporation | Cavity thickness compensated etalon filter |
US5412465A (en) | 1993-08-02 | 1995-05-02 | The United States Of America As Represented By The United States Department Of Energy | Method for verification of constituents of a process stream just as they go through an inlet of a reaction vessel |
US5717605A (en) | 1993-10-14 | 1998-02-10 | Olympus Optical Co., Ltd. | Color classification apparatus |
US5513022A (en) | 1993-12-30 | 1996-04-30 | Korea Institute Of Science And Technology | Method and apparatus for direct transmission of an optical image |
US5946088A (en) | 1994-05-03 | 1999-08-31 | Pfizer Inc. | Apparatus for mixing and detecting on-line homogeneity |
US5479164A (en) | 1994-05-05 | 1995-12-26 | Yorks; Jason | Photonic data compression system and method |
US5828492A (en) | 1994-06-18 | 1998-10-27 | Forschungszentrum Karlsruhe Gmbh | Grating structure having a plurality of binary lamellar gratings |
US5504332A (en) | 1994-08-26 | 1996-04-02 | Merck & Co., Inc. | Method and system for determining the homogeneity of tablets |
US5555128A (en) | 1994-10-04 | 1996-09-10 | The United States Of America As Represented By The Secretary Of The Air Force | Phase coding technique for one-way image transmission through an aberrating medium |
US5771096A (en) | 1994-12-09 | 1998-06-23 | Foss Electric A/S | Method of obtaining information |
WO1996030746A1 (en) | 1995-03-31 | 1996-10-03 | Board Of Regents, The University Of Texas System | Detection of cervical neoplasias using fluorescence spectroscopy |
JPH093662A (en) | 1995-06-15 | 1997-01-07 | Dowa Mining Co Ltd | Etching treatment and etching liquid for aluminum-ceramic composite substrate |
US5831742A (en) | 1995-06-16 | 1998-11-03 | Sun Electric U.K. Limited | Portable electrometric apparatus for roadside analysis of automotive exhaust emission |
US5750994A (en) | 1995-07-31 | 1998-05-12 | Instrumentation Metrics, Inc. | Positive correlation filter systems and methods of use thereof |
US5905571A (en) | 1995-08-30 | 1999-05-18 | Sandia Corporation | Optical apparatus for forming correlation spectrometers and optical processors |
US5760399A (en) | 1995-10-02 | 1998-06-02 | Foss Nirsystems, Inc. | Measurement of transmission spectra of pharmaceutical tablets |
US5991048A (en) | 1995-10-25 | 1999-11-23 | University Of Washington | Surface plasmon resonance light pipe sensor |
US5641962A (en) | 1995-12-05 | 1997-06-24 | Exxon Research And Engineering Company | Non linear multivariate infrared analysis method (LAW362) |
US5945676A (en) | 1996-02-02 | 1999-08-31 | Instrumentation Metrics, Inc. | Method and apparatus for multi-spectral analysis in noninvasive NIR spectroscopy |
US5747806A (en) | 1996-02-02 | 1998-05-05 | Instrumentation Metrics, Inc | Method and apparatus for multi-spectral analysis in noninvasive nir spectroscopy |
JPH11506206A (en) | 1996-02-02 | 1999-06-02 | インストゥルメンテイション メトリックス,インコーポレイテッド | Method and apparatus for multispectral analysis in non-invasive infrared spectroscopy |
JPH11506207A (en) | 1996-02-02 | 1999-06-02 | インストゥルメンテイション メトリックス,インコーポレイテッド | Method and apparatus for multispectral analysis in non-invasive near-infrared spectroscopy |
US5734098A (en) | 1996-03-25 | 1998-03-31 | Nalco/Exxon Energy Chemicals, L.P. | Method to monitor and control chemical treatment of petroleum, petrochemical and processes with on-line quartz crystal microbalance sensors |
US5799231A (en) | 1996-07-25 | 1998-08-25 | International Business Machines Corporation | Variable index distributed mirror |
US6469785B1 (en) | 1996-08-16 | 2002-10-22 | Zeptosens Ag | Optical detection device based on semi-conductor laser array |
US6317648B1 (en) | 1996-09-06 | 2001-11-13 | Merck & Co., Inc. | Customer specific packaging line having containers with tag means containing medication order information |
US6522945B2 (en) | 1996-09-06 | 2003-02-18 | Merck & Company, Inc. | Customer specific packaging line |
US5781289A (en) | 1996-11-05 | 1998-07-14 | Sabsabi; Mohamad | Method and apparatus for rapid in situ analysis of preselected components of homogeneous solid compositions, especially pharmaceutical compositions |
US6124937A (en) | 1996-11-15 | 2000-09-26 | Optosens Optische Spektroskopie Und Sensortechnik Gmbh | Method and device for combined absorption and reflectance spectroscopy |
US6006585A (en) | 1997-01-25 | 1999-12-28 | Cerberus Ag | Optoacoustic gas sensor |
US6040914A (en) | 1997-06-10 | 2000-03-21 | New Focus, Inc. | Simple, low cost, laser absorption sensor system |
US6176323B1 (en) | 1997-06-27 | 2001-01-23 | Baker Hughes Incorporated | Drilling systems with sensors for determining properties of drilling fluid downhole |
US6198531B1 (en) | 1997-07-11 | 2001-03-06 | University Of South Carolina | Optical computational system |
US5941821A (en) | 1997-11-25 | 1999-08-24 | Trw Inc. | Method and apparatus for noninvasive measurement of blood glucose by photoacoustics |
US20030059820A1 (en) | 1997-11-26 | 2003-03-27 | Tuan Vo-Dinh | SERS diagnostic platforms, methods and systems microarrays, biosensors and biochips |
US5939717A (en) | 1998-01-29 | 1999-08-17 | Schlumberger Technology Corporation | Methods and apparatus for determining gas-oil ratio in a geological formation through the use of spectroscopy |
US6741335B2 (en) | 1998-03-09 | 2004-05-25 | Otm Technologies Ltd. | Optical translation measurement |
US20020005108A1 (en) * | 1998-05-15 | 2002-01-17 | Ludwig Lester Frank | Tactile, visual, and array controllers for real-time control of music signal processing, mixing, video, and lighting |
US6980285B1 (en) | 1998-06-12 | 2005-12-27 | Radiometer Medical A/S | Method in quality control of a spectrophotometer |
US6350389B1 (en) | 1998-06-12 | 2002-02-26 | The University Of Tokyo | Method for producing porous diamond |
US6137108A (en) | 1998-06-17 | 2000-10-24 | Foss Nirsystems Incorporated | Instrument and method for spectroscopic analysis by reflectance and transmittance |
US5946089A (en) | 1998-07-13 | 1999-08-31 | Jordan Valley Applied Radiation Ltd. | Plasma spectrometer with shutter assembly |
US6490035B1 (en) | 1998-08-07 | 2002-12-03 | Astrazeneca Ab | Mixing apparatus |
US20010034064A1 (en) | 1998-08-13 | 2001-10-25 | Howard Turner | Parallel reactor with internal sensing |
US6707043B2 (en) | 1998-08-14 | 2004-03-16 | On-Site Analysis, Inc. | On-site analyzer |
US6982431B2 (en) | 1998-08-31 | 2006-01-03 | Molecular Devices Corporation | Sample analysis systems |
US6430513B1 (en) | 1998-09-04 | 2002-08-06 | Perkinelmer Instruments Llc | Monitoring constituents of an animal organ using statistical correlation |
US6630663B2 (en) | 1998-10-21 | 2003-10-07 | Raytheon Company | Miniature ion mobility spectrometer |
US6690464B1 (en) | 1999-02-19 | 2004-02-10 | Spectral Dimensions, Inc. | High-volume on-line spectroscopic composition testing of manufactured pharmaceutical dosage units |
US7399968B2 (en) | 1999-02-19 | 2008-07-15 | Malvern Instruments Incorporated | Spectroscopic instruments and methods employing array detector and variable filtering |
US6711503B2 (en) | 1999-03-04 | 2004-03-23 | Sandia Corporation | Hybrid least squares multivariate spectral analysis methods |
US7123844B2 (en) | 1999-04-06 | 2006-10-17 | Myrick Michael L | Optical computational system |
US20020154315A1 (en) | 1999-04-06 | 2002-10-24 | Myrick Michael L. | Optical computational system |
US6529276B1 (en) | 1999-04-06 | 2003-03-04 | University Of South Carolina | Optical computational system |
US20030094495A1 (en) | 1999-06-07 | 2003-05-22 | Metrologic Instruments, Inc. | Nuclear resonance based scanning system having an automatic object identification and attribute information acquisition and linking mechanism integrated therein |
US6304854B1 (en) | 1999-09-09 | 2001-10-16 | Dunhill Holdings, Corp. | System and method for providing a comparable branded product based on a current branded product for non-comparison shopped products |
US6347131B1 (en) | 1999-11-02 | 2002-02-12 | Cintex Limited | Non-contact volume measurement |
US20030056581A1 (en) | 1999-12-02 | 2003-03-27 | Turner William Edward | Apparatus and method for analyzing fluids |
US6748334B1 (en) | 1999-12-06 | 2004-06-08 | Jorge E. Perez | Specialty gas analysis system |
US6737654B2 (en) | 1999-12-28 | 2004-05-18 | Trixell | Method for temperature compensation of an image detector |
US20040197850A1 (en) | 2000-02-16 | 2004-10-07 | Baer Thomas M. | Transfer film for laser microcapture |
US6517230B1 (en) | 2000-02-17 | 2003-02-11 | Astrazeneca Uk Limited | Mixing apparatus and method |
US6776517B2 (en) | 2000-02-17 | 2004-08-17 | Astrazeneca Uk Limited | Mixing apparatus and method |
US6420708B2 (en) | 2000-03-10 | 2002-07-16 | Wilks Enterprise, Inc. | Spectroscopy analyzer using a detector array |
US20020008215A1 (en) | 2000-04-28 | 2002-01-24 | Evans Gary A. | Grating-outcoupled surface-emitting lasers with flared gain regions |
US6600560B2 (en) | 2000-05-02 | 2003-07-29 | Leica Microsystems Jena Gmbh | Optical measurement arrangement having an ellipsometer |
US20030111606A1 (en) | 2000-05-10 | 2003-06-19 | Berghmans Antonius Christianus | Process for identifying objects using an optical spectrometer and a transport system |
US20020050567A1 (en) | 2000-05-30 | 2002-05-02 | Thierry Boudet | Method and apparatus for detecting gases |
US6437326B1 (en) | 2000-06-27 | 2002-08-20 | Schlumberger Technology Corporation | Permanent optical sensor downhole fluid analysis systems |
US6573999B1 (en) | 2000-07-14 | 2003-06-03 | Nanometrics Incorporated | Film thickness measurements using light absorption |
US6697195B2 (en) | 2000-08-21 | 2004-02-24 | 3M Innovative Properties Company | Loss enhanced reflective optical filters |
US7348493B2 (en) | 2000-09-04 | 2008-03-25 | Dowa Mining Co., Ltd. | Metal-ceramic circuit board |
US7138156B1 (en) | 2000-09-26 | 2006-11-21 | Myrick Michael L | Filter design algorithm for multi-variate optical computing |
US6476384B1 (en) | 2000-10-10 | 2002-11-05 | Schlumberger Technology Corporation | Methods and apparatus for downhole fluids analysis |
US20020071118A1 (en) | 2000-12-11 | 2002-06-13 | Masashi Shinbori | Device for measurement of the spectral reflectance and process for measurement of the spectral reflectance |
US20050087132A1 (en) | 2001-01-31 | 2005-04-28 | Planar Systems, Inc. | Methods and apparatus for the production of optical filters |
US20020109094A1 (en) | 2001-02-12 | 2002-08-15 | Alexander Goetz | System and method for combining reflectance data |
US6765212B2 (en) | 2001-02-12 | 2004-07-20 | Analytical Spectral Devices, Inc. | System and method for combining reflectance data |
US6667802B2 (en) | 2001-02-12 | 2003-12-23 | Analytical Spectral Devices, Inc. | System and method for self-referencing calibration |
US20020108892A1 (en) | 2001-02-12 | 2002-08-15 | Alexander Goetz | System and method for grouping refelectance data |
US6853447B2 (en) | 2001-02-12 | 2005-02-08 | Analytical Spectral Devices, Inc. | System and method for the collection of spectral image data |
US20030117628A1 (en) | 2001-09-07 | 2003-06-26 | Raimo Harju | Intelligent instrumentation for optical measurement of samples |
US7145145B2 (en) | 2001-09-20 | 2006-12-05 | Ndc Infrared Engineering, Ltd. | Optical window for monitoring samples |
US20030071988A1 (en) | 2001-10-11 | 2003-04-17 | Baker Hughes Incorporated | Real-time on-line sensing and control of mineral scale deposition from formation fluids |
US6870629B1 (en) | 2001-10-29 | 2005-03-22 | Precision Photonics Corporation | Optical frequency sweep control and readout by using a phase lock |
US6995840B2 (en) | 2002-03-06 | 2006-02-07 | Aspectrics, Inc. | Method and apparatus for radiation encoding and analysis |
US6771369B2 (en) | 2002-03-12 | 2004-08-03 | Analytical Spectral Devices, Inc. | System and method for pharmacy validation and inspection |
US7006214B2 (en) | 2002-03-12 | 2006-02-28 | Analytical Spectral Devices, Inc. | System and method for pharmacy validation and inspection |
US20030202179A1 (en) | 2002-04-29 | 2003-10-30 | The Curators Of The University Of Missouri | Ultrasensitive spectrophotometer |
US6798518B2 (en) | 2002-06-04 | 2004-09-28 | Baker Hughes Incorporated | Method and apparatus for a derivative spectrometer |
US20040012782A1 (en) | 2002-07-19 | 2004-01-22 | Mason Thomas G. | Asphaltene aggregation in petroleum oil mixtures determined by small angle light scattering |
US20050251289A1 (en) | 2002-07-25 | 2005-11-10 | Bonney Stanley G | Medicament dispenser |
US20060035018A1 (en) | 2002-11-01 | 2006-02-16 | Advance Company, Ltd. | Method for forming a thin film silver mirror and method for forming coated film comprising thin silver mirror film |
US20040106098A1 (en) | 2002-11-04 | 2004-06-03 | Transform Pharmaceuticals | Analysis of pharmaceutical solubility and stability |
US20050077476A1 (en) | 2002-11-21 | 2005-04-14 | Cdex, Inc | System and methods for detection and identification of chemical substances |
US7405825B2 (en) | 2002-12-19 | 2008-07-29 | Koninklijke Philiips Electronics N. V. | Optical analysis system |
WO2004057284A1 (en) | 2002-12-19 | 2004-07-08 | Koninklijke Philips Electronics N.V. | Optical analysis system |
US7245374B2 (en) | 2002-12-19 | 2007-07-17 | Koninklijke Philips Electronics N.V. | Optical analysis system |
US20060158734A1 (en) | 2002-12-19 | 2006-07-20 | Schuurmans Frank J P | Optical analysis system |
US20040160601A1 (en) | 2003-02-14 | 2004-08-19 | Womble M. Edward | Probe assemblies for Raman spectroscopy |
US20040227086A1 (en) | 2003-03-07 | 2004-11-18 | Pfizer Inc | Method and device for NIR reflection spectroscopy |
US7173239B2 (en) | 2003-03-14 | 2007-02-06 | Baker Hughes Incorporated | Method and apparatus for downhole quantification of methane using near infrared spectroscopy |
US6952267B2 (en) | 2003-07-07 | 2005-10-04 | Cymer, Inc. | Method and apparatus for measuring bandwidth of a laser output |
US7671973B2 (en) | 2003-12-19 | 2010-03-02 | Koninklijke Philips Electronics N.V. | Optical analysis system using multivariate optical elements |
WO2005062006A1 (en) | 2003-12-19 | 2005-07-07 | Koninklijke Philips Electronics N. V. | Optical analysis system using multivariate optical elements |
US20090015819A1 (en) | 2003-12-22 | 2009-01-15 | Koninklijke Philips Electronics Nv | Optical analysis system, blood analysis system and method of determining an amplitude of a principal component |
US20080231849A1 (en) | 2003-12-31 | 2008-09-25 | Myrick Michael L | Thin-Layer Porous Optical Sensors for Gases and Other Fluids |
WO2005062986A2 (en) | 2003-12-31 | 2005-07-14 | The University Of South Carolina | Thin-layer porous optical sensors for gases and other fluids |
US7889346B2 (en) | 2003-12-31 | 2011-02-15 | University Of South Carolina | Thin-layer porous optical sensors for gases and other fluids |
WO2005062986A3 (en) | 2003-12-31 | 2007-05-18 | Univ South Carolina | Thin-layer porous optical sensors for gases and other fluids |
US20050167264A1 (en) | 2004-01-15 | 2005-08-04 | James Sternbergh | Method and apparatus for monitoring optical characteristics of thin films in a deposition process |
US20050264815A1 (en) | 2004-05-07 | 2005-12-01 | Mark Wechsler | Sample element with fringing-reduction capabilities |
US20050288906A1 (en) | 2004-06-29 | 2005-12-29 | Drennen James K Iii | Spectroscopic pharmacy verification and inspection system |
US7271883B2 (en) | 2004-07-13 | 2007-09-18 | Newell Benjamin E | Refractive index sensor using internally reflective light beams |
US7569354B2 (en) | 2004-08-03 | 2009-08-04 | Onchip Cellomics Consortium | Cellomics system |
US7411729B2 (en) | 2004-08-12 | 2008-08-12 | Olympus Corporation | Optical filter, method of manufacturing optical filter, optical system, and imaging apparatus |
US20080309930A1 (en) | 2004-08-26 | 2008-12-18 | Koninklijke Philips Electronics N.V. | Calibration for Spectroscopic Analysis |
US20060051036A1 (en) | 2004-09-03 | 2006-03-09 | Treado Patrick J | Method and apparatus for fiberscope |
WO2006031733A2 (en) | 2004-09-13 | 2006-03-23 | The University Of South Carolina | Thin film interference filter and bootstrap method for interference filter thin film deposition process control |
US20100305741A1 (en) | 2004-09-13 | 2010-12-02 | University Of South Carolina | Thin Film Interference Filter and Bootstrap Method for Interference Filter Thin Film Deposition Process Control |
US20070201136A1 (en) | 2004-09-13 | 2007-08-30 | University Of South Carolina | Thin Film Interference Filter and Bootstrap Method for Interference Filter Thin Film Deposition Process Control |
WO2006137902A2 (en) | 2004-10-04 | 2006-12-28 | University Of South Carolina | Thermal selectivity multivariate optical computing |
US20080276687A1 (en) | 2004-10-04 | 2008-11-13 | University Of South Carolina | Thermal Selectivity Multivariate Optical Computing |
US7993276B2 (en) | 2004-10-15 | 2011-08-09 | Pulse Tracer, Inc. | Motion cancellation of optical input signals for physiological pulse measurement |
US20060197015A1 (en) | 2004-10-21 | 2006-09-07 | Sterling Bernhard B | Method and apparatus for determining an analyte concentration in a sample having interferents |
US20060093523A1 (en) | 2004-10-29 | 2006-05-04 | Hyperteq, Lp | System, method and apparatus for mud-gas extraction, detection and analysis thereof |
US20100265509A1 (en) | 2004-12-09 | 2010-10-21 | Halliburton Energy Services, Inc. | In situ optical computation fluid analysis system and method |
US20100245096A1 (en) | 2004-12-09 | 2010-09-30 | Halliburton Energy Services, Inc. | Optical data transformation |
US7697141B2 (en) | 2004-12-09 | 2010-04-13 | Halliburton Energy Services, Inc. | In situ optical computation fluid analysis system and method |
US20060142955A1 (en) | 2004-12-09 | 2006-06-29 | Jones Christopher M | In situ optical computation fluid analysis system and method |
WO2006064446A1 (en) | 2004-12-15 | 2006-06-22 | Koninklijke Philips Electronics N.V. | Calibration of optical analysis making use of multivariate optical elements |
US20100042348A1 (en) * | 2004-12-15 | 2010-02-18 | Koninklijke Philips Electronics, N.V. | Calibration of optical analysis making use of multivariate optical elements |
US20060153492A1 (en) | 2005-01-13 | 2006-07-13 | Komag, Inc. | Test head for optically inspecting workpieces |
US20060169902A1 (en) | 2005-02-01 | 2006-08-03 | Denso Corporation | Infrared sensor |
US20060276697A1 (en) | 2005-06-07 | 2006-12-07 | Chemlmage Corporation | Non-invasive biochemical analysis |
US20070035737A1 (en) | 2005-08-15 | 2007-02-15 | Schlumberger Technology Corporation | Method and apparatus for composition analysis in a production logging environment |
US20090219538A1 (en) | 2005-11-28 | 2009-09-03 | University Of South Carolina | Method of high-speed monitoring based on the use of multivariate optical elements |
US7911605B2 (en) | 2005-11-28 | 2011-03-22 | Halliburton Energy Services, Inc. | Multivariate optical elements for optical analysis system |
EP1974201A1 (en) | 2005-11-28 | 2008-10-01 | University of South Carolina | Optical analysis system for dynamic, real-time detection and measurement |
US20090316150A1 (en) | 2005-11-28 | 2009-12-24 | Myrick Michael L | Self calibration methods for optical analysis system |
WO2007061436A1 (en) | 2005-11-28 | 2007-05-31 | University Of South Carolina | Self calibration methods for optical analysis system |
WO2007061435A1 (en) | 2005-11-28 | 2007-05-31 | University Of South Carolina | Method of high-speed monitoring based on the use of multivariate optical elements |
WO2007062202A1 (en) | 2005-11-28 | 2007-05-31 | University Of South Carolina | Novel multivariate optical elements for optical analysis system |
EP1969326A1 (en) | 2005-11-28 | 2008-09-17 | Ometric Corporation | Optical analysis system and method for real time multivariate optical computing |
WO2007061437A1 (en) | 2005-11-28 | 2007-05-31 | University Of South Carolina | Optical analysis system for dynamic, real-time detection and measurement |
US20090073433A1 (en) | 2005-11-28 | 2009-03-19 | Univeristy Of South Carolina | Optical analysis system and methods for operating multivariate optical elements in a normal incidence orientation |
US20090097024A1 (en) | 2005-11-28 | 2009-04-16 | Blackburn John C | Optical analysis system and method for real time multivariate optical computing |
WO2007064578A2 (en) | 2005-11-28 | 2007-06-07 | University Of South Carolina | Optical analysis system and optical train |
WO2007062224A1 (en) | 2005-11-28 | 2007-05-31 | University Of South Carolina | Process for selecting spectral elements and components for optical analysis systems |
US20090033933A1 (en) | 2005-11-28 | 2009-02-05 | Myrick Michael L | Novel multivariate optical elements for optical analysis system |
US20090216504A1 (en) | 2005-11-28 | 2009-08-27 | University Of South Carolina | Selecting spectral elements and components for optical analysis systems |
US7920258B2 (en) | 2005-11-28 | 2011-04-05 | Halliburton Energy Services, Inc. | Optical analysis system and elements to isolate spectral region |
US20070137292A1 (en) | 2005-12-16 | 2007-06-21 | Schlumberger Technology Corporation | Methods and apparatus for oil composition determination |
US7623233B2 (en) | 2006-03-10 | 2009-11-24 | Ometric Corporation | Optical analysis systems and methods for dynamic, high-speed detection and real-time multivariate optical computing |
US20090002697A1 (en) | 2006-03-10 | 2009-01-01 | Ometric Corporation | Optical Analysis Systems and Methods for Dynamic, High-Speed Detection and Real-Time Multivariate Optical Computing |
US20070282647A1 (en) | 2006-05-30 | 2007-12-06 | Freese Robert P | Methods of assessing and designing an application specific measurement system |
US20070294094A1 (en) | 2006-06-20 | 2007-12-20 | Ometric Corporation | Methods of customizing, licensing and sustaining a technology option to meet a customer requirement |
WO2008002903A2 (en) | 2006-06-26 | 2008-01-03 | University Of South Carolina | Data validation and classification in optical analysis systems |
US20090299946A1 (en) | 2006-06-26 | 2009-12-03 | Myrick Michael L | Data validation and classification in optical analysis systems |
US7652767B2 (en) | 2006-10-19 | 2010-01-26 | Sporian Microsystems, Inc. | Optical sensor with chemically reactive surface |
WO2008057912A2 (en) | 2006-11-02 | 2008-05-15 | University Of South Carolina | Multi-analyte optical computing system |
WO2008057913A2 (en) | 2006-11-02 | 2008-05-15 | University Of South Carolina | Improved signal processing for optical computing system |
US20100141952A1 (en) | 2006-11-02 | 2010-06-10 | Myrick Michael L | Multi-analyte optical computing system |
EP2087328A2 (en) | 2006-11-02 | 2009-08-12 | Ometric Corporation | Self-contained multivariate optical computing and analysis system |
US20100149537A1 (en) | 2006-11-02 | 2010-06-17 | Myrick Michael L | Improved signal processing for optical computing system |
US20100182600A1 (en) | 2006-11-02 | 2010-07-22 | Freese Robert P | Self-contained multivariate optical computing and analysis systems |
US20100195105A1 (en) | 2006-11-02 | 2010-08-05 | University Of South Carolina | Improved stability for optical computing system |
US20080111064A1 (en) | 2006-11-10 | 2008-05-15 | Schlumberger Technology Corporation | Downhole measurement of substances in earth formations |
US20100153048A1 (en) | 2007-02-28 | 2010-06-17 | Myrick Michael L | Design of multivariate optical elements for nonlinear calibration |
US20100073666A1 (en) | 2007-03-30 | 2010-03-25 | Perkins David L | In-line process measurement systems and methods |
EP2140238A1 (en) | 2007-03-30 | 2010-01-06 | Ometric Corporation | In-line process measurement systems and methods |
US20100302539A1 (en) | 2007-03-30 | 2010-12-02 | Myrick Michael L | Novel multi-analyte optical computing system |
WO2008121684A1 (en) | 2007-03-30 | 2008-10-09 | University Of South Carolina | Novel multi-analyte optical computing system |
US20100328669A1 (en) | 2007-03-30 | 2010-12-30 | Myrick Michael L | Tablet analysis and measurment system |
US20100211329A1 (en) | 2007-10-12 | 2010-08-19 | Stuart Farquharson | Method and apparatus for determining properties of fuels |
US20090140144A1 (en) | 2007-11-30 | 2009-06-04 | University Of South Carolina | Tuning D* with Modified Thermal Detectors |
US20090250613A1 (en) | 2008-04-07 | 2009-10-08 | University Of South Carolina | Chemically-Selective Detector and Methods Relating Thereto |
US7853104B2 (en) | 2009-01-05 | 2010-12-14 | Yokogawa Electric Corporation | Bidirectional optical module and optical time domain reflectometer |
Non-Patent Citations (61)
Title |
---|
A.M.C. Prakash et al., "Optical regression: a method for improving quantitative precision of multivariate prediction with single channel spectrometers", Chemom. Intell. Lab. Syst. 46, 265-274, 1999. |
Czarnik-Matusewicz et al., Temperature-Dependent Water Structural Transitions Examined by Near-IR and Mid-IR Spectra Analyzed by Multivariate Curve Resolution and Two-Dimensional Correlation Spectroscopy, Analytica Chimica Acta, vol. 544, No. 1-2, pp. 15-25, 2005. |
D. Eastwood et al., "Field applications of stand-off sensing using visible/NIR multivariate optical computing", Ground and Air Pollution Monitoring and Remediation, SPIE vol. 4199, pp. 105-114, 2001. |
Dereniak et al., Infrared Detectors and Systems, John Wiley & Sons: New York, Chapter 9, pp. 395-438, 1996. |
Dobrowolski, J.A., et al., "Refinement of Optical Multilayer Systems With Different Optimization Procedures," Applied Optics, vol. 29, No. 9, Jul. 1, 1990, pp. 2876-2893. |
E.B. Martin et al., "Process Performance Monitoring Using Multivariate Statistical Process Control", IEE Proc.-Control Theory Appl., vol. 143, No. 2, pp. 132-144, Mar. 1996. |
E.D. Palik, Handbook of Optical Constants of Solids I, Academic Press, San Diego, pp. 350-357, 1998. |
F.G. Haibach et al., "Precision in multivariate optical computing", Appl. Optics 43, 2130-2140, 2004. |
Ghesti et al., "Application of Raman Spectroscopy to Monitor and Quantify Ethyl Esters in Soybean Oil Transesterification", Journal of the American Oil Chemists' Society, vol. 83, pp. 597-601, 2006. |
Haibach et al., "On-line Reoptimization of Filter Designs for Multivariate Optical Elements", Applied Optics, vol. 42, No. 10, pp. 1833-1838, Apr. 1, 2003. |
Handbook of Polymer Coating for Electronic Chemistry and Applications, 2nd ed., 1990. |
Inon et al., "Combination of Mid- and Near-Infrared Spectroscopy for the Determination of the Quality Properties of Beers", Analytica Chimica Acta, vol. 571, No. 2, pp. 167-174, 2006. |
Knothe, "Analyzing Biodiesel: Standards and Other Methods", Journal of the American Oil Chemists Society, vol. 83, No. 10, pp. 823-833, 2006. |
Lang, "Ferroelectric Polymers and Ceramic-Polymer Composites", Key Engineering Materials, vol. 92-93, pp. 83-142, 1994. |
M. Groner et al., "Identification of Major Water-Soluble Fluorescent Components of Some Petrochemicals", Marine Pollution Bulletin, vol. 42, No. 10, pp. 935-941, 2001. |
M.L. Myrick et al., "A single-element all-optical approach to chemometric prediction", Vib. Spectrosc. 28, 73-81, 2002. |
M.L. Myrick et al., "Application of Multivariate Optical Computing to Near-Infrared Imaging", Vibration Spectroscopy-based Sensor System, Proceedings of SPIE, vol. 4577, pp. 148-157, 2002. |
M.L. Myrick et al., "Application of multivariate optical computing to simple near-infrared point measurements", Proceedings of the SPIE, Bellingham, VA, US, vol. 4574, pp. 208-215, 2002. |
M.L. Myrick et al., "Spectral tolerance determination for multivariate optical element design", Fresenius J Anal Chem, 369:351-355, 2001. |
M.L. Myrick et al., "Use of Molecular Symmetry to Describe Pauli Principle Effects on the Vibration-Rotation Spectroscopy of CO2(g)", Journal of Chemical Education, vol. 81, No. 3, pp. 379-382, Mar. 2004. |
M.L. Myrick, "Multivariate optical elements simplify spectroscopy", Laser Focus World 38, 91-94, 2002. |
M.L. Myrick, "New approaches to implementing predictive spectroscopy", Proceedings of the SPIE Conference on Pattern Recognition, Chemometrics, and Imaging for Optical Environmental Monitoring, SPIE vol. 3854, pp. 98-102, Sep. 1999. |
M.N. Simcock et al., "Precision in imaging multivariate optical computing", Applied Optics, vol. 46., No. 7, pp. 1066-1080, Mar. 1, 2007. |
M.P. Nelson et al., "Fabrication and evaluation of a dimension-reduction fiberoptic system for chemical imaging applications", Review of Scientific Instruments, vol. 70, No. 6, pp. 2836-2843, Jun. 1999. |
M.P. Nelson et al., "Multivariate optical computation for predictive spectroscopy", Analytical Chemistry, vol. 70, No. 1, pp. 73-82, Jan. 1, 1998. |
M.P. Nelson et al., "Multivariate optical computation for predictive spectroscopy", SPIE Vo. 3261, pp. 232-243, 1998. |
M.V. Schiza et al., "Use of a 2D to 1D Dimension Reduction Fiber-Optic Array for Multiwavelength Imaging Sensors", Applied Spectroscopy, vol. 55, No. 2, pp. 217-226, 2001. |
Mandelis et al., "Theory of Photopyroelectric Spectroscopy of Solids", Journal of Applied Physics, vol. 57, No. 9, pp. 4421-4430, 1985. |
Moravskii, A.P., "Spectrophotometrtc Determination of the Yield of the C60 and C70 Fullerenes in Electric Arc Synthesis under Helium", Journal of Analytical Chemistry, vol. 53, No. 12, 1998, 8 pages. |
MSDS Hyper Glossary is a website http://www.ilpi.com/msds/ref/index.html , Safety Emporium Laboratory and Safety Supplies, retrieved on Feb. 10, 2012, 4 pages. |
MSDS No. F1080, Material Safety Data Sheet, Mallinckrodt Baker, Inc., Feb. 18, 2003, 6 pages. |
Mullins et al., "Gas-Oil Ratio of Live Crude Oils Determined by Near-Infrared Spectroscopy", Applied Spectroscopy, vol. 55, No. 2, pp. 197-201, 2001. |
Mullins et al., "Gas-Oil Ratio of Live Crude Oils Determined by Near-Infrared Spectroscopy", Optical Methods for Industrial Processes, Proceedings of SPIE vol. 4201, pp. 73-81, 2001. |
N. Aske et al., "Asphaltene Aggregation from Crude Oils and Models Systems Studied by High-Pressure NIR Spectroscopy", Energy and Fuels, American Chemical Society, 16, No. 5, pp. 1287-1295, 2002. |
N. Aske et al., "Determination of Saturate, Aromatic, Resin, and Asphitenic (SARA) Components in Crude Oils by Means of Infrared and Near-Infrared Spectroscopy", American Chemical Society, Energy and Fuels 15, No. 5, pp. 1304-1312, 2001. |
O. Soyemi et al., "A Simple Optical Computing Device for Chemical Analysis", Proceedings of SPIE Vo. 4284, pp. 17-28, 2001. |
O. Soyemi et al., "Design and testing of a multivariate optical element: The first demonstration of multivariate optical computing for predictive spectroscopy", Anal. Chem. 73, No. 6, pp. 1069-1079, (2001). |
O. Soyemi et al., "Design of angle tolerant multivariate optical elements for chemical imaging", Applied Optics, vol. 41, No. 10, pp. 1936-1941, Apr. 1, 2002. |
O. Soyemi et al., "Nonlinear Optimization Algorithm for Multivariate Optical Element Design", Applied Spectroscopy, vol. 56, No. 4, pp. 477-487, 2002. |
O. Soyemi et al., "Novel Filter Design Algorithm for Multivariate Optical Computing", Advanced Environmental and Chemical Sensing Technology, Proceedings of SPIE Vo. 4205, pp. 288-299, 2001. |
O.S. Heavens, Optical Properties of Thin Solid Films, Dover Publications, Inc., Mineola, USA, pp. 62-81, 242-249, 1991. |
Ozturk et al., "Filtering Characteristics of Hybrid Integrated Polymer and Compound Semiconductor Waveguides", In: Journal of Lightwave Technology, vol. 20, No. 8, pp. 1530-1536, Aug. 2002. |
P.G. Miney et al., "A New Optically Reflective Thin Layer Electrode (ORTLE) Window: Gold on a Thin Porous Alumina Film Used to Observe the Onset of Water Reduction", Electroanalysis, 16, No. 1-2, pp. 113-119, 2004. |
Pimentel et al., "Determination of Biodiesel Content when Blended with Mineral Diesel Fuel Using Infrared Spectroscopy and Multivariate Calibration", Microchemical Journal, vol. 82, No. 2, pp. 201-206, 2006. |
Power et al., "Rapid Recovery of Wide Bandwidth Photothermal Signals via Homodyne Photothermal Spectrometry: Theory and Methodology", Applied Spectroscopy, vol. 47, No. 4, pp. 489-500, 1993. |
Profeta et al., "Spectral Resolution in Multivariate Optical Computing", Spectrochimica Acta Part A: Molecular and Biomolecular Spectroscopy, vol. 67, pp. 483-502, 2007. |
Prystay et al., "Thermophysical Measurements and Interfacial Adhesion Studies in Ultrathin Polymer Films Using Homodyne Photothermal Spectrometry", Applied Spectroscopy, vol. 47, No. 4, pp. 501-514, 1993. |
R.A. Deverse et al., "Realization of the Hadamard multiplex advantage using a programmable optical mask in a dispersive flat-field near-infrared spectrometer", Appl. Spectrosc. 54, 1751-1758, 2000. |
R.J. Priore et al., "Miniature Stereo Spectral Imaging System for Multivariate Optical Computing", Applied Spectroscopy, vol. 58, No. 7, pp. 870-873, 2004. |
Ryabenko, A.G., et al., "An Algorithm for Constructing the Basis of Optimal Linear Combinations . . . " , Pattern Recognition and image Analysis, vol. 3, No. 1, 1993, 12 pages. |
Ryabenko, A.G., et al., "Numerical Study of a Pattern Recognition Multispectral System With Optimal Spectral Splitting," Pattern Recognition and Image Analysis, vol. 1, No. 3, 1991, 10 pages. |
S. Betancourt et al., "Analyzing Hydrocarbons in the Borehole", Oilfield Review, pp. 54-61, Autumn 2003. |
Sastry et al., "Determination of Physiocochemical Properties and Carbon-Type Analysis of Base Oils Using Mid-IR Spectroscopy and Partial Least Squares Regression Analysis", American Chemical Society, Energy and Fuels 12, No. 2, pp. 304-311, 1998. |
Simcock et al, "Tuning D* with Modified Thermal Detectors", Applied Spectroscopy, vol. 60, No. 12, pp. 1469-1476, 2006. |
Strausz et al., "About the Colloidal Nature of Asphaltenes and the MW of Covalent Monomeric Units", American Chemical Society, Energy and Fuels 16, No. 4, pp. 809-822, 2002 (abstract). |
Sullivan, Brian T., et al., "Implementation of a Numerical Needle Method for Thin-Film Design," Applied Optics, vol. 35, No. 28, Oct. 1996, pp. 5484-5492. |
The Chemistry of Ferric Chloride; Printmaking Today, vol. 4, No. 2, 1995; Cello Press Ltd., Oxon, UK, 2 pages. |
Vasil'Ev, G.K., et al., "Rotational and Vibrational Deactivation of Excited HF Molecules", Soy. Physics-JETP, vol. 41, No. 4, 1976, pp. 617-621. |
Workman, Handbook of Organic Compounds: NIR, IR, Raman and UV-Vis Spectra Featuring Polymers and Surfactants (a 3-volume set); Academic Press: San Diego, vol. 3, pp. 96-160, 2001. |
Y. Yan et al. "Fluorescence Fingerprint of Waters: Excitation-Emission Matrix Spectroscopy as a Tracking Tool", Applied Spectroscopy, vol. 54, No. 10, pp. 1539-1542, 2000. |
Zagonel et al., "Multivariate Monitoring of Soybean Oil Ethanolysis by FTIR", Talanta, vol. 63, No. 4, pp. 1021-1025, 2004. |
Cited By (11)
Publication number | Priority date | Publication date | Assignee | Title |
---|---|---|---|---|
US20120236301A1 (en) * | 2011-03-18 | 2012-09-20 | Seiko Epson Corporation | Measurement apparatus and measurement method |
US9297254B2 (en) | 2011-08-05 | 2016-03-29 | Halliburton Energy Services, Inc. | Methods for monitoring fluids within or produced from a subterranean formation using opticoanalytical devices |
US9395306B2 (en) | 2011-08-05 | 2016-07-19 | Halliburton Energy Services, Inc. | Methods for monitoring fluids within or produced from a subterranean formation during acidizing operations using opticoanalytical devices |
US9441149B2 (en) | 2011-08-05 | 2016-09-13 | Halliburton Energy Services, Inc. | Methods for monitoring the formation and transport of a treatment fluid using opticoanalytical devices |
US9464512B2 (en) | 2011-08-05 | 2016-10-11 | Halliburton Energy Services, Inc. | Methods for fluid monitoring in a subterranean formation using one or more integrated computational elements |
US20130284897A1 (en) * | 2012-04-26 | 2013-10-31 | Robert Freese | Methods and Devices for Optically Determining A Characteristic of a Substance |
US9383307B2 (en) * | 2012-04-26 | 2016-07-05 | Halliburton Energy Services, Inc. | Methods and devices for optically determining a characteristic of a substance |
US20160282313A1 (en) * | 2015-03-26 | 2016-09-29 | General Electric Company | Trace Gas Measurement Apparatus for Electrical Equipment |
US20180126259A1 (en) * | 2016-11-10 | 2018-05-10 | Z-Image, Llc | Laser beam detector including a light source for use in a laser attraction |
US10539711B2 (en) * | 2016-11-10 | 2020-01-21 | Z Image, Llc | Laser beam detector including a light source for use in a laser attraction |
US11125681B2 (en) | 2019-01-24 | 2021-09-21 | Raven Industries, Inc. | Agricultural spectrographic composition sensor and methods for same |
Also Published As
Publication number | Publication date |
---|---|
WO2008002903A3 (en) | 2009-04-09 |
WO2008002903A2 (en) | 2008-01-03 |
US20090299946A1 (en) | 2009-12-03 |
EP2033196A2 (en) | 2009-03-11 |
Similar Documents
Publication | Publication Date | Title |
---|---|---|
US9170154B2 (en) | Data validation and classification in optical analysis systems | |
US8629984B2 (en) | Optical analysis system for dynamic, real-time detection and measurement | |
US8154726B2 (en) | Optical analysis system and method for real time multivariate optical computing | |
US8379199B2 (en) | Self-contained multivariate optical computing and analysis system | |
US7623233B2 (en) | Optical analysis systems and methods for dynamic, high-speed detection and real-time multivariate optical computing | |
US8184295B2 (en) | Tablet analysis and measurement system | |
US8212216B2 (en) | In-line process measurement systems and methods | |
US9182282B2 (en) | Multi-analyte optical computing system | |
US7834999B2 (en) | Optical analysis system and optical train | |
US8213006B2 (en) | Multi-analyte optical computing system | |
US7990538B2 (en) | Signal processing for optical computing system | |
US8862445B2 (en) | Selecting spectral elements and components for optical analysis systems | |
US8213012B2 (en) | Stability for optical computing system | |
US7911605B2 (en) | Multivariate optical elements for optical analysis system | |
US20090219512A1 (en) | Optical analysis system and elements to isolate spectral region |
Legal Events
Date | Code | Title | Description |
---|---|---|---|
AS | Assignment |
Owner name: UNIVERSITY OF SOUTH CAROLINA, SOUTH CAROLINA Free format text: ASSIGNMENT OF ASSIGNORS INTEREST;ASSIGNORS:MYRICK, MICHAEL L.;PRIORE, RYAN J.;FREESE, ROBERT P.;AND OTHERS;SIGNING DATES FROM 20090310 TO 20090316;REEL/FRAME:022567/0233 |
|
AS | Assignment |
Owner name: HALLIBURTON ENERGY SERVICES, INC., TEXAS Free format text: ASSIGNMENT OF ASSIGNORS INTEREST;ASSIGNOR:UNIVERSITY OF SOUTH CAROLINA;REEL/FRAME:025790/0442 Effective date: 20110121 |
|
STCF | Information on status: patent grant |
Free format text: PATENTED CASE |
|
MAFP | Maintenance fee payment |
Free format text: PAYMENT OF MAINTENANCE FEE, 4TH YEAR, LARGE ENTITY (ORIGINAL EVENT CODE: M1551); ENTITY STATUS OF PATENT OWNER: LARGE ENTITY Year of fee payment: 4 |
|
MAFP | Maintenance fee payment |
Free format text: PAYMENT OF MAINTENANCE FEE, 8TH YEAR, LARGE ENTITY (ORIGINAL EVENT CODE: M1552); ENTITY STATUS OF PATENT OWNER: LARGE ENTITY Year of fee payment: 8 |