US9411032B2 - Sensitivity distribution generating apparatus, magnetic resonance system, sensitivity distribution generating method, and program - Google Patents
Sensitivity distribution generating apparatus, magnetic resonance system, sensitivity distribution generating method, and program Download PDFInfo
- Publication number
- US9411032B2 US9411032B2 US13/562,656 US201213562656A US9411032B2 US 9411032 B2 US9411032 B2 US 9411032B2 US 201213562656 A US201213562656 A US 201213562656A US 9411032 B2 US9411032 B2 US 9411032B2
- Authority
- US
- United States
- Prior art keywords
- fat
- region
- image data
- water
- sensitivity
- Prior art date
- Legal status (The legal status is an assumption and is not a legal conclusion. Google has not performed a legal analysis and makes no representation as to the accuracy of the status listed.)
- Active, expires
Links
- 230000035945 sensitivity Effects 0.000 title claims abstract description 77
- 238000000034 method Methods 0.000 title description 20
- 238000000926 separation method Methods 0.000 claims abstract description 25
- 238000003384 imaging method Methods 0.000 claims abstract description 24
- XLYOFNOQVPJJNP-UHFFFAOYSA-N water Substances O XLYOFNOQVPJJNP-UHFFFAOYSA-N 0.000 claims description 54
- 238000002595 magnetic resonance imaging Methods 0.000 claims 5
- 239000000126 substance Substances 0.000 abstract description 43
- 238000010586 diagram Methods 0.000 description 14
- XUIMIQQOPSSXEZ-UHFFFAOYSA-N Silicon Chemical compound [Si] XUIMIQQOPSSXEZ-UHFFFAOYSA-N 0.000 description 4
- 229910052710 silicon Inorganic materials 0.000 description 4
- 239000010703 silicon Substances 0.000 description 4
- XEEYBQQBJWHFJM-UHFFFAOYSA-N Iron Chemical compound [Fe] XEEYBQQBJWHFJM-UHFFFAOYSA-N 0.000 description 2
- 230000000694 effects Effects 0.000 description 2
- 238000001914 filtration Methods 0.000 description 2
- 210000000056 organ Anatomy 0.000 description 2
- 230000011218 segmentation Effects 0.000 description 2
- 230000003187 abdominal effect Effects 0.000 description 1
- 230000005540 biological transmission Effects 0.000 description 1
- 210000000746 body region Anatomy 0.000 description 1
- 238000003702 image correction Methods 0.000 description 1
- 229910052742 iron Inorganic materials 0.000 description 1
- 210000004185 liver Anatomy 0.000 description 1
- 230000003068 static effect Effects 0.000 description 1
Images


Classifications
-
- G—PHYSICS
- G01—MEASURING; TESTING
- G01R—MEASURING ELECTRIC VARIABLES; MEASURING MAGNETIC VARIABLES
- G01R33/00—Arrangements or instruments for measuring magnetic variables
- G01R33/20—Arrangements or instruments for measuring magnetic variables involving magnetic resonance
- G01R33/44—Arrangements or instruments for measuring magnetic variables involving magnetic resonance using nuclear magnetic resonance [NMR]
- G01R33/48—NMR imaging systems
-
- G—PHYSICS
- G01—MEASURING; TESTING
- G01R—MEASURING ELECTRIC VARIABLES; MEASURING MAGNETIC VARIABLES
- G01R33/00—Arrangements or instruments for measuring magnetic variables
- G01R33/20—Arrangements or instruments for measuring magnetic variables involving magnetic resonance
- G01R33/24—Arrangements or instruments for measuring magnetic variables involving magnetic resonance for measuring direction or magnitude of magnetic fields or magnetic flux
- G01R33/246—Spatial mapping of the RF magnetic field B1
-
- G—PHYSICS
- G01—MEASURING; TESTING
- G01R—MEASURING ELECTRIC VARIABLES; MEASURING MAGNETIC VARIABLES
- G01R33/00—Arrangements or instruments for measuring magnetic variables
- G01R33/20—Arrangements or instruments for measuring magnetic variables involving magnetic resonance
- G01R33/44—Arrangements or instruments for measuring magnetic variables involving magnetic resonance using nuclear magnetic resonance [NMR]
- G01R33/48—NMR imaging systems
- G01R33/4828—Resolving the MR signals of different chemical species, e.g. water-fat imaging
Definitions
- the present invention relates to a sensitivity distribution generating apparatus, a magnetic resonance system, a sensitivity distribution generating method, and a program for generating sensitivity distribution data of a coil.
- a sensitivity distribution generating apparatus which generates sensitivity distribution data of a coil for receiving magnetic resonance signals from an imaging region including a first substance and a second substance different in resonant frequency.
- the apparatus includes a reference image data generating unit that generates reference image data in which a region of the first substance is suppressed and a region of the second substance is emphasized, based on data obtained by executing a separation sequence for separating the first substance and the second substance from each other, and an estimating unit which estimates a sensitivity of the coil in the region of the first substance, based on a signal value of the region of the second substance in the reference image data
- a magnetic resonance system which scans an imaging region including a first substance and a second substance different in resonant.
- the system includes a scan unit which executes a separation sequence for separating the first and second substances included in the imaging region, a reference image data generating unit which generates reference image data in which a region of the first substance is suppressed and a region of the second substance is emphasized, based on data obtained by executing the separation sequence and an estimating unit which estimates a sensitivity of a coil in the region of the first substance, based on a signal value of the region of the second substance in the reference image data.
- a sensitivity distribution generating method which generates sensitivity distribution data of a coil for receiving magnetic resonance signals from an imaging region including a first substance and a second substance different in resonant frequency.
- the method includes generating reference image data in which a region of the first substance is suppressed and a region of the second substance is emphasized, based on data obtained by executing a separation sequence for separating the first substance and the second substance included in the imaging region from each other, and estimating a sensitivity of the coil in the region of the first substance, based on a signal value of the region of the second substance in the reference image data.
- a program for generating sensitivity distribution data of a coil for receiving magnetic resonance signals from an imaging region including a first region and a second region different in resonant frequency causes a computer to execute a reference image data generating process which generates reference image data in which a region of the first substance is suppressed and a region of the second substance is emphasized, based on data obtained by executing a separation sequence for separating the first substance and the second substance included in the imaging region from each other, and an estimating process which estimates a sensitivity of the coil in the region of the first substance, based on a signal value of the region of the second substance in the reference image data.
- the reference image data a region of a first substance is suppressed and a region of a second substance is emphasized.
- the reference image data is generated based on data obtained by executing a separation sequence for separating the first substance and the second substance different in resonant frequency. It is thus possible to separate the first and second substances from each other with sufficient accuracy.
- FIG. 1 is a schematic diagram of a magnetic resonance system according to one embodiment.
- FIG. 2 is a diagram for describing a sequence used when an imaging region of a subject 12 is imaged.
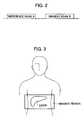
- FIG. 3 is a diagram schematically showing the imaging region of the subject 12 .
- FIG. 4 is a flow showing a procedure for generating sensitivity distribution data.
- FIG. 5 is a diagram schematically illustrating fat image data D fat in an axial section.
- FIGS. 6A and 6B are diagrams for describing fat image data after being subjected to threshold processing.
- FIGS. 7A and 7B are diagrams for describing one example of a method for estimating sensitivity.
- FIGS. 8A and 8B are diagrams schematically showing fat image data D fat ′′ after the sensitivities of water regions R w1 and R w2 have been estimated.
- FIG. 9 shows an example of MR image A obtained by a water-fat separation sequence, and a Histogram H of the MR image A.
- FIG. 10 shows an example of MR image A′ obtained by correcting the sensitivity of the MR image A, and a Histogram H′ of the MR image A′.
- FIG. 1 is a schematic diagram of a magnetic resonance system according to one embodiment.
- the magnetic resonance system (hereinafter called “MR system” and MR: Magnetic Resonance) 100 has a magnet 2 , a table 3 , a receiving coil 4 , etc.
- the magnet 2 has a bore 21 in which a subject 12 is accommodated, a superconductive coil 22 , a gradient coil 23 , a RF coil 24 , etc.
- the superconductive coil 22 applies a static magnetic field
- the gradient coil 23 applies a gradient magnetic field
- the RF coil 24 transmits an RF pulse.
- a permanent magnet may be used instead of the superconductive coil 22 .
- the table 3 has a cradle 3 a for supporting the subject 12 . With the movement of the cradle 3 a into the bore 21 , the subject 12 is carried in the bore.
- the receiving coil 4 is attached to an abdominal region of the subject 12 .
- the MR system 100 further includes a transmitter 6 , a gradient magnetic field power supply 7 , a receiver 8 , a controller 9 , an operation device 10 and a display device 11 , etc.
- the transmitter 6 supplies a current to the RF coil 24 .
- the gradient magnetic field power supply 7 supplies a current to the gradient coil 23 .
- the receiver 8 receives a RF signal from the receiving coil 4 to perform signal processing (for example, demodulation) of the RF signal.
- the controller 9 controls the operations of respective parts of the MR system 100 so as to realize various operations of the MR system 100 such as transmission of information necessary for the display device 11 , reconstruction of an image based on data received from the receiver 8 , etc.
- the controller 9 has a reference image data generating unit 91 and an estimating unit 92 , etc.
- the reference image data generating unit 91 generates reference image data in which each water region is suppressed and a fat region is emphasized, based on data obtained by executing a water-fat separation sequence for separating water and fat from each other.
- the estimating unit 92 estimates the sensitivity of the coil in the water region, based on a signal value of the fat region in the reference image data.
- the controller 9 is one example that configures the reference image data generating unit 91 and the estimating unit 92 .
- the controller 9 executes a predetermined program to function as these units.
- the controller 9 is one example of a sensitivity distribution generating apparatus.
- the operation device 10 is operated by an operator and inputs various information to the controller 9 .
- the display device 11 displays various information thereon.
- the MR system 100 is configured as described above.
- FIG. 2 is a diagram for describing a sequence used when an imaging region of the subject 12 is imaged
- FIG. 3 is a diagram schematically showing an example of the imaging region of the subject 12 .
- the imaging region R includes the liver.
- a reference scan A and an imaging scan B are carried out.
- the water-fat separation sequence is a sequence for separating water and fat from each other using the difference in resonant frequency between the water and the fat in the imaging region R to acquire water image data and fat image data.
- sensitivity distribution data is generated based on data obtained by the reference scan A.
- the generated sensitivity distribution data is used to correct water image data and fat image data obtained by the imaging scan B.
- a procedure for generating the sensitivity distribution data will be explained below.
- FIG. 4 is a flow showing the procedure of generating the sensitivity distribution data.
- Step ST 1 the water-fat separation sequence in the reference scan A is performed.
- the reference image data generating unit 91 (refer to FIG. 1 ) generates fat image data, based on data acquired by carrying out the water-fat separation sequence in the reference scan A.
- Fat image data D fat in an axial section is schematically shown in FIG. 5 .
- a body region in the fat image data D fat is shown by one fat region R f and two water regions R w1 and R w2 for convenience of explanation.
- the fat region R f is represented by a high signal
- the water regions R w1 and R w2 are represented by a low signal.
- an outside region R out of the body is expressed in dots for convenience of explanation.
- the reference image data generating unit 91 performs threshold processing for removing noise (signals of the outside region R out of the body, etc.) on the fat image data D fat (refer to FIG. 6 ).
- FIGS. 6A and 6B are diagrams for describing fat image data after being subjected to the threshold processing.
- FIG. 6A is a diagram schematically showing fat image data D fat ′ after being subjected to the threshold processing
- FIG. 6B is a sectional diagram taken along line L-L of FIG. 6A .
- the fat image data D fat ′ after being subjected to the threshold processing is used as reference image data for generating sensitivity distribution data. Since the fat region R f is represented by a high signal as shown in FIG. 6B , a signal value of the fat region R f can be used as data on a sensitivity distribution. However, signal values of the water regions R w1 and R w2 cannot be used as data on a coil's sensitivity distribution because the water regions R w1 and R w2 are represented by low signals. Thus, in the present embodiment, the sensitivities of the water regions R w1 and R w2 represented by the low signal are estimated using the signal value of the fat region R f represented by the high signal. The flow proceeds to Step ST 3 to estimate the sensitivities.
- the estimating unit 92 estimates the sensitivities of the water regions R w1 and R w2 .
- FIGS. 7A and 7B are diagrams for describing one example of a method for estimating the sensitivity.
- data of the water region R w1 is interpolated using a signal value of fat that exists around the water region R w1 .
- interpolation methods therefor there can be used various interpolation methods such as a cubic spline method, etc.
- Interpolating the data of the water region R w1 enables estimation of a sensitivity distribution of the water region R w1 .
- the sensitivity of another water region R w2 is also estimated by interpolating data of the water region R w2 using a signal value of fat that exists around the water region R w2 .
- the fat image data D fat ′′ obtained in this way is used as coil's sensitivity distribution data D s .
- the sensitivity distribution data D s of the coil is data used to correct the water image data and fat image data obtained by the imaging scan B.
- the sensitivity distribution data D s of the coil is obtained in the above-described manner.
- the image data is obtained using the water-fat separation sequence.
- water and fat can be separated with high accuracy, this makes it possible to obtain highly reliable sensitivity distribution data.
- the sensitivity distribution data has been generated using the fat image data D fat acquired during the reference scan A. Since the difference in the contrast of fat between organs is generally not so large, sensitivity distribution data with higher reliability can be obtained using the fat image data D fat .
- sensitivity distribution data may be generated using water image data instead of the fat image data D fat .
- the water image data is image data in which a fat region is suppressed and each water region is emphasized.
- the sensitivity of the fat region may be estimated based on the signal value of each water region. It is however desirable that a filtering process is performed after the sensitivity of the fat region is estimated since the contrast of water tends to depend on the type of organ. The filtering process makes it possible to obtain sensitivity distribution data with high reliability.
- the fat image data D fat is threshold-processed at Step ST 2 . If it is however possible to obtain highly reliable sensitivity distribution data, then there is no need to perform the threshold processing.
- a water-fat separation sequence considering T 2 *effects may be used as the water-fat separation sequence for the reference scan A. Considering the T 2 *effects enables an improvement in accuracy when the water and fat are separated from each other.
- sensitivity distribution data may be generated using another separation sequence for separating substances different in resonant frequency, instead of the water-fat separation sequence.
- a sequence for separating water and silicon from each other may be performed to generate sensitivity distribution data, based on water image data or silicon image data.
- a sequence for separating fat and silicon from each other may be carried out to generate sensitivity distribution data, based on fat image data or silicon image data.
- FIG. 9 shows an example of MR image A obtained by a water-fat separation sequence, and a Histogram H of the MR image A.
- FIG. 10 shows an example of MR image A′ obtained by correcting the sensitivity of the MR image A, and a Histogram H′ of the MR image A′. Compared with FIG. 9 and FIG. 10 , it can be seen that the non-uniformity of the sensitivity is improved by the correction.
Abstract
Description
Claims (8)
Priority Applications (1)
| Application Number | Priority Date | Filing Date | Title |
|---|---|---|---|
| US13/562,656 US9411032B2 (en) | 2012-07-31 | 2012-07-31 | Sensitivity distribution generating apparatus, magnetic resonance system, sensitivity distribution generating method, and program |
Applications Claiming Priority (1)
| Application Number | Priority Date | Filing Date | Title |
|---|---|---|---|
| US13/562,656 US9411032B2 (en) | 2012-07-31 | 2012-07-31 | Sensitivity distribution generating apparatus, magnetic resonance system, sensitivity distribution generating method, and program |
Publications (2)
| Publication Number | Publication Date |
|---|---|
| US20140035575A1 US20140035575A1 (en) | 2014-02-06 |
| US9411032B2 true US9411032B2 (en) | 2016-08-09 |
Family
ID=50024855
Family Applications (1)
| Application Number | Title | Priority Date | Filing Date |
|---|---|---|---|
| US13/562,656 Active 2035-02-12 US9411032B2 (en) | 2012-07-31 | 2012-07-31 | Sensitivity distribution generating apparatus, magnetic resonance system, sensitivity distribution generating method, and program |
Country Status (1)
| Country | Link |
|---|---|
| US (1) | US9411032B2 (en) |
Families Citing this family (2)
| Publication number | Priority date | Publication date | Assignee | Title |
|---|---|---|---|---|
| DE102014223734B4 (en) | 2014-11-20 | 2018-08-09 | Siemens Healthcare Gmbh | Correction of imaging techniques in a magnetic resonance device |
| DE102014226034B4 (en) | 2014-12-16 | 2017-01-19 | Siemens Healthcare Gmbh | Image correction in MR imaging taking into account the reception profile |
Citations (11)
| Publication number | Priority date | Publication date | Assignee | Title |
|---|---|---|---|---|
| US7015696B2 (en) | 2003-12-22 | 2006-03-21 | Ge Medical Systems Global Technology Company, Llc | Magnetic resonance imaging apparatus and magnetic resonance imaging method |
| US20080231273A1 (en) | 2007-03-23 | 2008-09-25 | Hiroyuki Kabasawa | Magnetic resonance imaging apparatus, magnetic resonance imaging method and sensitivity distribution measuring apparatus |
| US7446527B2 (en) | 2006-03-08 | 2008-11-04 | Ge Medical Systems Global Technology Company, Llc | Methods and apparatus for reducing artifacts in MRI images |
| US7592810B2 (en) * | 2006-04-25 | 2009-09-22 | The Board Of Trustees Of The Leland Stanford Junior University | MRI methods for combining separate species and quantifying a species |
| US7664541B2 (en) | 2005-02-28 | 2010-02-16 | Siemens Aktiengesellschaft | Multi-channel magnetic resonance imaging reconstruction method for water-fat separation |
| US7701211B2 (en) | 2004-12-22 | 2010-04-20 | Koninklijke Philips Electronics N.V. | Magnetic resonance imaging system and method |
| US7741842B2 (en) * | 2006-04-25 | 2010-06-22 | The Board Of Trustees Of The Leland Stanford Junior University | Calibration maps for parallel imaging free of chemical shift artifact |
| US7888936B2 (en) * | 2006-11-02 | 2011-02-15 | Siemens Aktiengesellschaft | Phase correction method |
| US7956611B2 (en) | 2005-03-30 | 2011-06-07 | Hitachi Medical Corporation | Magnetic resonance imaging apparatus and method |
| US8278924B2 (en) * | 2007-11-08 | 2012-10-02 | Koninklijke Philips Electronics N.V. | Method of performing an MRI reference scan |
| US8384383B2 (en) * | 2010-03-23 | 2013-02-26 | Max-Planck-Gesellschaft zur Foerferung der Wissenschaften E.V. | Method and device for reconstructing a sequence of magnetic resonance images |
-
2012
- 2012-07-31 US US13/562,656 patent/US9411032B2/en active Active
Patent Citations (11)
| Publication number | Priority date | Publication date | Assignee | Title |
|---|---|---|---|---|
| US7015696B2 (en) | 2003-12-22 | 2006-03-21 | Ge Medical Systems Global Technology Company, Llc | Magnetic resonance imaging apparatus and magnetic resonance imaging method |
| US7701211B2 (en) | 2004-12-22 | 2010-04-20 | Koninklijke Philips Electronics N.V. | Magnetic resonance imaging system and method |
| US7664541B2 (en) | 2005-02-28 | 2010-02-16 | Siemens Aktiengesellschaft | Multi-channel magnetic resonance imaging reconstruction method for water-fat separation |
| US7956611B2 (en) | 2005-03-30 | 2011-06-07 | Hitachi Medical Corporation | Magnetic resonance imaging apparatus and method |
| US7446527B2 (en) | 2006-03-08 | 2008-11-04 | Ge Medical Systems Global Technology Company, Llc | Methods and apparatus for reducing artifacts in MRI images |
| US7592810B2 (en) * | 2006-04-25 | 2009-09-22 | The Board Of Trustees Of The Leland Stanford Junior University | MRI methods for combining separate species and quantifying a species |
| US7741842B2 (en) * | 2006-04-25 | 2010-06-22 | The Board Of Trustees Of The Leland Stanford Junior University | Calibration maps for parallel imaging free of chemical shift artifact |
| US7888936B2 (en) * | 2006-11-02 | 2011-02-15 | Siemens Aktiengesellschaft | Phase correction method |
| US20080231273A1 (en) | 2007-03-23 | 2008-09-25 | Hiroyuki Kabasawa | Magnetic resonance imaging apparatus, magnetic resonance imaging method and sensitivity distribution measuring apparatus |
| US8278924B2 (en) * | 2007-11-08 | 2012-10-02 | Koninklijke Philips Electronics N.V. | Method of performing an MRI reference scan |
| US8384383B2 (en) * | 2010-03-23 | 2013-02-26 | Max-Planck-Gesellschaft zur Foerferung der Wissenschaften E.V. | Method and device for reconstructing a sequence of magnetic resonance images |
Non-Patent Citations (1)
| Title |
|---|
| C. Wurslin, ISMRM 2010, p. 5051: An A-Priori Supported Image Correction Method for Severe Intensity Non-Uniformities At 3T, 1 page. |
Also Published As
| Publication number | Publication date |
|---|---|
| US20140035575A1 (en) | 2014-02-06 |
Similar Documents
| Publication | Publication Date | Title |
|---|---|---|
| US9664764B2 (en) | Magnetic resonance imaging apparatus and susceptibility-weighted imaging method using the same | |
| US7898253B2 (en) | Method and apparatus for removing artifacts during magnetic resonance imaging | |
| EP3198291B1 (en) | Dixon mr imaging with suppression of flow artifacts | |
| US20170212198A1 (en) | Magnetic resonance signal processing method, magnetic resonance signal processing apparatus and magnetic resonance apparatus, and program | |
| JP6280881B2 (en) | Scan condition determining apparatus, magnetic resonance apparatus, scan condition determining method, and program | |
| JP2017529963A (en) | High performance bone visualization nuclear magnetic resonance imaging | |
| US9411032B2 (en) | Sensitivity distribution generating apparatus, magnetic resonance system, sensitivity distribution generating method, and program | |
| US11454692B2 (en) | Method of performing magnetic resonance imaging and a magnetic resonance apparatus | |
| JP2016093494A (en) | Magnetic resonance imaging apparatus, image processing apparatus and image processing method | |
| US20110190622A1 (en) | Magnetic resonance imaging apparatus and method | |
| CN107209239B (en) | Magnetic resonance apparatus and computer-readable medium storing program applied to the apparatus | |
| JP2017051439A (en) | Magnetic resonance apparatus and program | |
| JP2018020106A (en) | Magnetic resonance imaging apparatus and image processing system | |
| JP2005237703A (en) | Magnetic resonance imaging system, and method for data processing of the same | |
| US10481235B2 (en) | Magnetic resonance imaging apparatus and image processing apparatus | |
| US20150094563A1 (en) | Magnetic resonance system and program | |
| JP2016067687A (en) | Magnetic resonance apparatus | |
| JP6348355B2 (en) | Magnetic resonance signal processing apparatus, magnetic resonance apparatus, and program | |
| JP5755285B2 (en) | Magnetic resonance apparatus and program | |
| JP6554717B2 (en) | Magnetic resonance apparatus and program | |
| JP6560492B2 (en) | Magnetic resonance apparatus and program | |
| JP6554718B2 (en) | Data processing apparatus, magnetic resonance apparatus, and program | |
| JP5843497B2 (en) | Magnetic resonance apparatus and program | |
| JP2017086667A (en) | Magnetic resonance device and program | |
| JP6554719B2 (en) | Magnetic resonance apparatus and program |
Legal Events
| Date | Code | Title | Description |
|---|---|---|---|
| AS | Assignment |
Owner name: GE HEALTHCARE JAPAN CORPORATION, JAPAN Free format text: ASSIGNMENT OF ASSIGNORS INTEREST;ASSIGNOR:KABASAWA, HIROYUKI;REEL/FRAME:028686/0553 Effective date: 20120718 |
|
| AS | Assignment |
Owner name: GENERAL ELECTRIC COMPANY, NEW YORK Free format text: ASSIGNMENT OF ASSIGNORS INTEREST;ASSIGNOR:KNOWLES, ADRIAN JEREMY;REEL/FRAME:028978/0723 Effective date: 20120905 |
|
| AS | Assignment |
Owner name: GENERAL ELECTRIC COMPANY, NEW YORK Free format text: ASSIGNMENT OF ASSIGNORS INTEREST;ASSIGNOR:GE MEDICAL SYSTEMS GLOBAL TECHNOLOGY COMPANY, LLC;REEL/FRAME:029456/0603 Effective date: 20121115 Owner name: GE MEDICAL SYSTEMS GLOBAL TECHNOLOGY COMPANY, LLC, Free format text: ASSIGNMENT OF ASSIGNORS INTEREST;ASSIGNOR:GE HEALTHCARE JAPAN CORPORATION;REEL/FRAME:029456/0584 Effective date: 20121114 |
|
| STCF | Information on status: patent grant |
Free format text: PATENTED CASE |
|
| MAFP | Maintenance fee payment |
Free format text: PAYMENT OF MAINTENANCE FEE, 4TH YEAR, LARGE ENTITY (ORIGINAL EVENT CODE: M1551); ENTITY STATUS OF PATENT OWNER: LARGE ENTITY Year of fee payment: 4 |
|
| FEPP | Fee payment procedure |
Free format text: MAINTENANCE FEE REMINDER MAILED (ORIGINAL EVENT CODE: REM.); ENTITY STATUS OF PATENT OWNER: LARGE ENTITY |