US9501585B1 - Methods and system for providing real-time business intelligence using search-based analytics engine - Google Patents
Methods and system for providing real-time business intelligence using search-based analytics engine Download PDFInfo
- Publication number
- US9501585B1 US9501585B1 US14/304,490 US201414304490A US9501585B1 US 9501585 B1 US9501585 B1 US 9501585B1 US 201414304490 A US201414304490 A US 201414304490A US 9501585 B1 US9501585 B1 US 9501585B1
- Authority
- US
- United States
- Prior art keywords
- user
- data
- query
- data set
- server node
- Prior art date
- Legal status (The legal status is an assumption and is not a legal conclusion. Google has not performed a legal analysis and makes no representation as to the accuracy of the status listed.)
- Active
Links
- 238000000034 method Methods 0.000 title claims abstract description 39
- 238000012517 data analytics Methods 0.000 claims abstract description 18
- 230000002452 interceptive effect Effects 0.000 claims abstract description 18
- 238000012545 processing Methods 0.000 claims abstract description 14
- 230000004044 response Effects 0.000 claims abstract description 10
- 230000004931 aggregating effect Effects 0.000 claims abstract description 4
- 230000015654 memory Effects 0.000 claims description 15
- 238000010586 diagram Methods 0.000 claims description 11
- 230000007246 mechanism Effects 0.000 claims description 7
- 230000001960 triggered effect Effects 0.000 claims description 6
- 230000004048 modification Effects 0.000 claims 8
- 238000012986 modification Methods 0.000 claims 8
- 230000003993 interaction Effects 0.000 claims 7
- 230000009471 action Effects 0.000 claims 1
- 238000004891 communication Methods 0.000 description 39
- 238000007405 data analysis Methods 0.000 description 22
- 238000003058 natural language processing Methods 0.000 description 14
- 238000012800 visualization Methods 0.000 description 14
- 230000008569 process Effects 0.000 description 13
- 238000005516 engineering process Methods 0.000 description 12
- 238000003860 storage Methods 0.000 description 11
- 230000001413 cellular effect Effects 0.000 description 9
- 230000002776 aggregation Effects 0.000 description 7
- 238000004220 aggregation Methods 0.000 description 7
- 238000004458 analytical method Methods 0.000 description 7
- 238000001914 filtration Methods 0.000 description 7
- 230000006870 function Effects 0.000 description 5
- 230000008859 change Effects 0.000 description 4
- 238000010801 machine learning Methods 0.000 description 4
- 230000003287 optical effect Effects 0.000 description 3
- 238000007619 statistical method Methods 0.000 description 3
- 230000000007 visual effect Effects 0.000 description 3
- 238000013459 approach Methods 0.000 description 2
- 230000008901 benefit Effects 0.000 description 2
- 230000005540 biological transmission Effects 0.000 description 2
- 238000013461 design Methods 0.000 description 2
- 238000011161 development Methods 0.000 description 2
- 238000012423 maintenance Methods 0.000 description 2
- 230000001902 propagating effect Effects 0.000 description 2
- 238000012546 transfer Methods 0.000 description 2
- 241001455214 Acinonyx jubatus Species 0.000 description 1
- VYZAMTAEIAYCRO-UHFFFAOYSA-N Chromium Chemical compound [Cr] VYZAMTAEIAYCRO-UHFFFAOYSA-N 0.000 description 1
- 241001481833 Coryphaena hippurus Species 0.000 description 1
- 230000003213 activating effect Effects 0.000 description 1
- 239000008186 active pharmaceutical agent Substances 0.000 description 1
- 238000004364 calculation method Methods 0.000 description 1
- 239000003086 colorant Substances 0.000 description 1
- 230000000052 comparative effect Effects 0.000 description 1
- 238000012937 correction Methods 0.000 description 1
- 230000008878 coupling Effects 0.000 description 1
- 238000010168 coupling process Methods 0.000 description 1
- 238000005859 coupling reaction Methods 0.000 description 1
- 238000007418 data mining Methods 0.000 description 1
- 238000013500 data storage Methods 0.000 description 1
- 238000004141 dimensional analysis Methods 0.000 description 1
- 238000009826 distribution Methods 0.000 description 1
- 230000003203 everyday effect Effects 0.000 description 1
- 239000011521 glass Substances 0.000 description 1
- 230000001976 improved effect Effects 0.000 description 1
- 230000006872 improvement Effects 0.000 description 1
- 230000000977 initiatory effect Effects 0.000 description 1
- 230000010354 integration Effects 0.000 description 1
- 230000014759 maintenance of location Effects 0.000 description 1
- 238000013507 mapping Methods 0.000 description 1
- 238000003825 pressing Methods 0.000 description 1
- 238000009877 rendering Methods 0.000 description 1
- 239000010979 ruby Substances 0.000 description 1
- 229910001750 ruby Inorganic materials 0.000 description 1
- 230000003068 static effect Effects 0.000 description 1
- 230000008093 supporting effect Effects 0.000 description 1
- 230000009466 transformation Effects 0.000 description 1
- 238000007794 visualization technique Methods 0.000 description 1
Images


Classifications
-
- G06F17/30991—
-
- G—PHYSICS
- G06—COMPUTING; CALCULATING OR COUNTING
- G06F—ELECTRIC DIGITAL DATA PROCESSING
- G06F16/00—Information retrieval; Database structures therefor; File system structures therefor
- G06F16/90—Details of database functions independent of the retrieved data types
- G06F16/903—Querying
-
- G—PHYSICS
- G06—COMPUTING; CALCULATING OR COUNTING
- G06F—ELECTRIC DIGITAL DATA PROCESSING
- G06F16/00—Information retrieval; Database structures therefor; File system structures therefor
- G06F16/20—Information retrieval; Database structures therefor; File system structures therefor of structured data, e.g. relational data
- G06F16/24—Querying
- G06F16/245—Query processing
- G06F16/2452—Query translation
- G06F16/24522—Translation of natural language queries to structured queries
-
- G—PHYSICS
- G06—COMPUTING; CALCULATING OR COUNTING
- G06F—ELECTRIC DIGITAL DATA PROCESSING
- G06F16/00—Information retrieval; Database structures therefor; File system structures therefor
- G06F16/20—Information retrieval; Database structures therefor; File system structures therefor of structured data, e.g. relational data
- G06F16/26—Visual data mining; Browsing structured data
-
- G—PHYSICS
- G06—COMPUTING; CALCULATING OR COUNTING
- G06F—ELECTRIC DIGITAL DATA PROCESSING
- G06F16/00—Information retrieval; Database structures therefor; File system structures therefor
- G06F16/30—Information retrieval; Database structures therefor; File system structures therefor of unstructured textual data
- G06F16/33—Querying
- G06F16/332—Query formulation
- G06F16/3325—Reformulation based on results of preceding query
- G06F16/3326—Reformulation based on results of preceding query using relevance feedback from the user, e.g. relevance feedback on documents, documents sets, document terms or passages
- G06F16/3328—Reformulation based on results of preceding query using relevance feedback from the user, e.g. relevance feedback on documents, documents sets, document terms or passages using graphical result space presentation or visualisation
-
- G—PHYSICS
- G06—COMPUTING; CALCULATING OR COUNTING
- G06F—ELECTRIC DIGITAL DATA PROCESSING
- G06F40/00—Handling natural language data
- G06F40/40—Processing or translation of natural language
Definitions
- Some embodiments described herein generally address apparatuses, methods, and systems for intelligent data analytics, and more particularly, include methods and system for providing real-time business intelligence using search based Analytics Engine.
- OLAP Online Analytical Processing
- the data in a data warehouse is generally queried using database development structured programming languages such as Structured Query Language (SQL).
- SQL Structured Query Language
- a user such as a database administrator typically inputs a SQL query into the business data warehouse, and in turn receives the query results in a SQL format.
- the user can compile the query results to generate business intelligence reports, by utilizing a document processing tool such as Microsoft Word or PowerPoint to generate data charts and data plots to graphically illustrate the query results.
- Some embodiments described herein relate generally to providing real-time data analysis, reporting and business intelligence related to data stored in various sources, and more particularly, to providing real-time business intelligence to users, irrespective of users' technical knowledge, using natural language interfaces.
- methods and system provide a substantially real-time statistical analysis and computation engine developed based on search engine technology to store and access data in index files without using data warehouses that store data in databases.
- the methods and system also provide a natural language and search based interface to analyze data and generate reports without a need for writing SQL queries or using software configurations for creating reports.
- FIG. 1A is a schematic block diagram illustrating one example of interactive input and output between a user and a business intelligence platform, according to an embodiment.
- FIG. 1B is a schematic block diagram of a communication network system in which real-time business intelligence functions can be provided, according to an embodiment.
- FIG. 2A is a schematic illustration of a real-time business intelligence platform, according to an embodiment.
- FIG. 2B is a schematic block diagram of an index topology infrastructure of an indexing module, according to an embodiment.
- FIG. 3A is a schematic block diagram of a data indexing process pipeline, according to an embodiment.
- FIGS. 3B-3D are example logic flow diagrams illustrating real-time business analytics query and report generation, according to an embodiment.
- FIGS. 4A-4D are sample display menus for a real-time business intelligence providing system, according to an embodiment.
- FIG. 5 is a sample display menu for defining queries, according to an embodiment.
- FIG. 6 is a sample report provided by the real-time business intelligence platform, according to an embodiment.
- FIG. 7 is a sample display menus for ad-hoc drill down of a real-time business intelligence report, according to an embodiment.
- FIG. 8 is a sample display menus for applying interactive filtering on a real-time business intelligence report, according to an embodiment.
- FIG. 9 is a display user interface for manual building of complex reports, according to one embodiment.
- FIG. 10 is a sample display user interface for manual building of dashboards by selecting reports, according to an embodiment.
- FIG. 11 is a sample display menu for defining role based security groups of users, according to an embodiment.
- FIG. 12 is a sample display menu for defining multi-tenant solutions, according to an embodiment.
- a real-time business intelligence platform using search engine based database queries allows a user to obtain business analytics reports by submitting a natural language based question via a user interface, without manually aggregating raw data from a database query.
- a user may input a question in a natural language via a user interface (e.g., see 501 in FIG. 5 ) by either manually typing the question, or speaking the question via a microphone, and/or the like.
- the user may optionally configure data sources and/or data sets for the query via a user interface (e.g., see FIGS. 4B-4D ) so as to define the scope of data queries.
- a natural language processing module e.g., see 201 in FIG.
- the business intelligence platform may process the natural-language-based question, and translate the question into a database query in the format of a structured database language, such as SQL, and/or the like.
- the generated query may be used by a search engine controlled module (e.g., see 205 in FIG. 2 ) to query a database (e.g., see 303 in FIG. 3A ) for the desired data.
- the business intelligence platform enables data discovery and business intelligence from disparate data sources where the sources in themselves may be non-relational in nature, with variable data structures or schema and may include metadata structural information that is not readily available. These include sources like Hadoop or NoSQL data, log files, machine data and others.
- the business intelligence platform analyzes a context of the natural language query based the data obtained from various data sources, and on structural information obtained from the natural language question.
- the business intelligence platform indexes data from disparate sources into a computation search engine designed for real-time ad-hoc multi-dimensional analysis.
- the search engine may be used as an underlying data storage that enables fast multi-dimensional lookups in real-time, which enables real-time processing of a natural language question using cross functional-dependency algorithms without a time lapse.
- Some example disadvantages of using data warehouses include, ability to only support pre-configured analysis methods such as using static formats for dashboards, reports and slice-dice and drill down capabilities, long deployment cycle for design and implementation of data warehouses, inflexibility of data warehouses for supporting ad-hoc changes to data because of the fixed schema of databases, regular maintenance hassles associated with databases for optimal performance, and performance and scalability issues in handling high volumes of data.
- Search engine technology provides data indexing from a data source in a de-normalized schema-free way.
- the search engine technology using indexed data enables ad-hoc data analysis and rapid deployment, because the deployment does not require a specific design.
- search engine technology provides flexibility to handle dynamic changes in data, as individual records are stored as columnar key value pairs.
- scalability and fast access to the data can be provided with minimal maintenance.
- a higher storage level security than databases can be provided because the data can be stored in distributed binary index files.
- the data is not query-able by any other methods except through a provided query engine.
- the computational data search engine can be a search engine technology infused with statistical aggregation and a data analysis engine that operates on search index files, in the field of data analytics and business intelligence, providing various benefits over typical data warehouse approaches to statistical data analysis and reporting. More generally, such a computational engine can be based on, for example, statistical, logical, mathematical, heuristics and/or algorithmic calculations.
- a business intelligence platform provides data analysis capabilities to a user irrespective of the user's technology or business intelligence skills by providing a simple natural-language-based question-and-answer system and a computational search-based interface to ask questions or to perform search and data analysis and receive reports.
- the business intelligence platform can use index files based on computational data search engine technology.
- Such a platform can provide natural language and search-based interfaces to analyze data and generate reports substantially in real-time without requiring a user to write queries in a query language (e.g., SQL) or use software configurations for generating reports.
- a query language e.g., SQL
- the business intelligence platform can provide data, data analysis, and reports to the user substantially in real-time without having to customize data beforehand.
- the business intelligence platform also provides a natural language processing engine that translates user questions and queries into appropriate analytics queries and then maps the results using a rule engine to appropriate visualization modules.
- a “data analysis” is intended to mean a single data analysis or a combination of data analyses (e.g., data analyses associated with a series of applications, services, locations, products, etc.)
- FIG. 1A is a schematic block diagram illustrating one example of interactive input and output between a user and a business analytics platform, according to an embodiment.
- a user 110 may desire to obtain business analytics data, e.g., the user may wonder what was the total revenue last year for digital camera in San Francisco store where the margin was more than 100 at 112 .
- the user 110 may not need to be proficient in database technologies or any structured programming language such as SQL, etc.
- the user 110 may submit the total revenue question in natural language at 112 via a user interface of a business intelligence platform 120 .
- the business intelligence platform 120 can translate the natural language into a query in a structured language, and perform a query on a business database 119 for business data so that the business intelligence platform 120 can automatically aggregate the query results and generate a business analytics report including graphical representations of the query results, at 114 .
- the user 110 may not need to process and/or compile any raw data from the database, but can receive an analytics report 113 as an output of the business intelligence platform 120 .
- FIG. 1B is a schematic block diagram of a communication network system in which real-time business intelligence functions can be provided, according to an embodiment.
- a communication network system 100 can include one or more user devices or User Equipments (UEs) 101 , each equipped with at least a User Interface (UI) 107 ; one or more search engine servers 109 ; one or more data source(s) 111 ; and a business intelligence platform 103 . Any of the devices or platforms of the network system 100 can be equipped with local memory/storage spaces (not shown in FIG. 1B ). Furthermore, the devices and platforms of the network system 100 may have access to centralized or distributed memory/storage spaces (not shown in FIG. 1B ) through the communication network 105 . Thus, FIG. 1B is merely an example illustrating the types of devices and platforms that can be included within a communication network system 100 .
- Communication network 105 can be any communication network, such as the Internet, configurable to allow the one or more UEs 101 , the one or more search engine servers 109 , and the business intelligence platform 103 to communicate with communication network 105 and/or to each other through communication network 105 .
- Communication network 105 can be any network or combination of networks capable of transmitting information (e.g., data and/or signals) and can include, for example, a telephone network, an Ethernet network, a fiber-optic network, a wireless network, and/or a cellular network.
- communication network 105 can include multiple networks operatively coupled to one another by, for example, network bridges, routers, switches and/or gateways.
- the UEs 101 can be operatively coupled to a cellular network; and the business intelligence platform 103 can be operatively coupled to a fiber-optic network.
- the cellular network and fiber-optic network can each be operatively coupled to one another via one or more network bridges, routers, switches, and/or gateways such that the cellular network, the Ethernet network and the fiber-optic network are operatively coupled to form a communication network.
- the cellular network and fiber-optic network can each be operatively coupled to one another via one or more additional networks.
- the cellular network and the fiber-optic network can each be operatively coupled to the Internet such that the cellular network, the fiber-optic network and the Internet are operatively coupled to form a communication network.
- UEs 101 are operatively coupled to communication network 105 via network connection(s) 113 ; business intelligence platform 103 is operatively coupled to communication network 105 via network connection(s) 115 ; search engine servers 109 are operatively coupled to communication network 105 via network connection(s) 117 ; and data source(s) 111 are operatively coupled to communication network 105 via network connection(s) 119 .
- Network connections 113 , 115 , 117 , and 119 can be any appropriate network connection for operatively coupling UEs 101 , business intelligence platform 103 , the search engine servers 109 , and the data source(s) 111 .
- the business intelligence platform 103 can have a direct connection with search engine server(s) 109 via a communication 123 and the search engine server(s) 109 can have a direct connection to the data source(s) 111 via communication 121 .
- a network connection can be a wireless network connection such as, for example, a wireless fidelity (“Wi-Fi”) or Wireless Local Area Network (“WLAN”) connection, a Wireless Wide Area Network (“WWAN”) connection, and/or a cellular connection.
- a network connection can be a wired connection such as, for example, an Ethernet connection, a Digital Subscription Line (“DSL”) connection, a broadband coaxial connection, and/or a fiber-optic connection.
- Wi-Fi wireless fidelity
- WLAN Wireless Local Area Network
- WWAN Wireless Wide Area Network
- a network connection can be a wired connection such as, for example, an Ethernet connection, a Digital Subscription Line (“DSL”) connection, a broadband coaxial connection, and/or a fiber-optic connection.
- DSL Digital Subscription Line
- a communication network system 100 can include more than one UE 101 , more than one search engine server 109 , and more than one data source 111 .
- a UE 101 , and/or a search engine server 109 can be operatively coupled to the communication network 105 by heterogeneous network connections.
- a first UE 101 can be operatively coupled to the communication network 105 by a WWAN network connection
- another UE 101 can be operatively coupled to the communication network 105 by a DSL network connection
- a search engine server 109 can be operatively coupled to the communication network 105 by a fiber-optic network connection.
- the search engine server(s) 109 each can be, for example, a web server configured to provide search capabilities to electronic devices, such as UEs 101 .
- the UE 101 can be in communication with the search engine server(s) 109 via the communication network 105 , while the communication is managed by the business intelligence platform 103 .
- the business intelligence platform 103 can send a signal to control the communication between the UE 101 and the search engine server(s) 109 .
- the UEs 101 can be any of a variety of electronic devices that can be operatively coupled to communication network 105 .
- a UE 101 can be a personal computer, a tablet computer, a personal digital assistant (PDA), a cellular telephone, a portable/mobile internet device, television, kiosk display, display screens in vehicles, projection devices, laser display devices, digital display watches, digital display glasses and/or some other electronic communication device with audio and/or visual capabilities.
- PDA personal digital assistant
- a UE 101 can also be a television set, a streamer device, a set top box, or any other electronic device equipped with a display unit (a UI 107 ) and a network connection 113 that enables the device to run applications on an operating system.
- a UE 101 can be operatively coupled to communication network 105 via the UI 107 and network connection 113 .
- the UEs 101 each can include a web browser configured to access a webpage or website hosted on or accessible via the business intelligence platform 103 over communication network 105 .
- the UEs 101 can be configured to support, for example, Hyper Text Markup Language (HTML) using JavaScript.
- HTML Hyper Text Markup Language
- the UEs 101 can include a web browser, such as, Firefox®, Safari®, Dolphin®, Opera®, Internet Explorer (IE)®, and Chrome®.
- An Internet page or website can be accessed by a user of a web browser at a UE 101 by providing the web browser with a reference such as a uniform resource locator (URL), for example, of a webpage.
- URL uniform resource locator
- a user of a UE 101 can access a search engine server 109 via a URL designated for the search engine server 109 .
- UEs 101 each can include specialized software other than a browser for accessing a web server such as, for example, a search engine server 109 .
- Specialized software can be, for example, a specialized network-enabled application or program provided by the business intelligence platform 103 .
- portions of a website accessible via a web server can be located in a local or remote memory space/data store accessible to the web server.
- Data source(s) 111 can be distributed sources of data throughout the communication network system 100 .
- a data source 111 can be at least one of a database, a data warehouse, a file, etc.
- a UE 101 can also include a display, monitor or user interface (UI) 107 , a keyboard, various ports (e.g., a USB port), and other user interface features, such as, for example, touch screen controls, audio components, and/or video components (each not shown).
- UI monitor or user interface
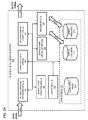
- FIG. 2A is a schematic illustration of a real-time business intelligence platform, according to an embodiment.
- the business intelligence platform 200 can be similar to the business intelligence platform 103 of FIG. 1B .
- a business intelligence platform 200 can include a natural language processing module 201 , a speech-to-text converter module 203 , a search engine controller module 205 , a meta-information lookup module 207 , an analytics engine module 209 , one or more data store(s) 211 , a report module 217 , and an indexing module 219 .
- a data store(s) 211 can include visualization rules 213 , and one or more search index nodes 215 a - 215 m .
- the business intelligence platform 200 communicates with other devices of a communication network system (e.g., communication network system 100 of FIG. 1 ) via input signal 221 and output signal 223 .
- a communication network system e.g., communication network system 100 of FIG. 1
- the business intelligence platform 200 and its components can be located anywhere within a communication network system 100 such as that shown in FIG. 1B including, but not limited to, within the UEs 101 , or in separate locations within the communication network system 100 of FIG. 1B .
- the business intelligence platform 200 can also be provided as on-premise deployment, via private computation clouds, or be embedded into other software or bundled into devices by Original Equipment Manufacturers (OEMs).
- OEMs Original Equipment Manufacturers
- a module can be, for example, any assembly and/or set of operatively-coupled electrical components, and can include, for example, a memory, a processor, electrical traces, optical connectors, software (executing or to be executed in hardware) and/or the like. Furthermore, a module can be capable of performing one or more specific functions associated with the module, as discussed further below.
- the business intelligence platform 200 can provide an analytics platform as a Software as a Service (SaaS) such that, for example, the business intelligence services are centrally hosted on the information cloud (not shown) for independent software vendors, system integrators, analytics consultants, enterprises, etc., to build multi-tenant business intelligence and embedded analytics solutions for external and internal customers, for example, by using a browser.
- SaaS Software as a Service
- the business intelligence platform 200 can enable users to mashup data from various sources for real-time ad-hoc analysis, build reports with rich visualizations and dynamic dashboards, and collaborate in-place among stakeholders to make informed decisions.
- the business intelligence platform 200 can provide capability of reducing data into smaller parts or views that can yield more information (e.g., slice and dice), drill downs and search on data.
- a multi-dimensional data structure can be considered as a data cube and the act of picking a rectangular subset of a data cube by choosing a single value for one of its dimensions can define a new data cube with one fewer dimension (e.g., slice operation).
- Other operations can produce sub-cubes, for example, by allowing an analyst to pick specific values of multiple dimensions (e.g., dice operation).
- a drill down/up operation allows the user to navigate among levels of data ranging from the most summarized (up) to the most detailed (down).
- the business intelligence platform 200 receives an input via the input signal 221 representing a question entered by a user of a UE 101 .
- the UE 101 can be equipped with sound input devices and a user can enter a question as a speech input by speaking into a microphone.
- the speech-to-text converter module 203 can convert the speech into text (e.g., as a HTTP request) and send a signal representing the input query to the natural language processing module 201 .
- the speech-to-text converter module 203 can send a signal representing the converted request to the meta-information lookup module 207 .
- the meta-information lookup module 207 can search the data store(s) 211 , or a data source(s) 111 , for keywords matching the query.
- the meta-information module 207 can store the keywords in data store(s) 211 .
- the keywords can be used for suggesting search phrase completions to the user of UE 101 , for example, when user is typing a question.
- the natural language processing module 201 receives the query and translates the query into an analytics query (e.g., a query including logical reasoning for finding an answer). For example, if a question in English asks for “all sales”, in the business intelligence context, the natural language processing module 201 can translate the question to “total sales”.
- the natural language processing module 201 can send a signal to the analytics engine module 209 representing the analytics query.
- the natural language processing module 201 can define a presentation type (e.g., line chart, pie chart, etc.) for the query results using the visualization rules 213 . Further embodiments of the natural language processing module 201 and/or its functionality are provided in co-pending U.S. non-provisional application Ser. No. 14/304,487, entitled “Methods and System for Providing Real-Time Business Intelligence using Natural Language Query Answer,” which is herein expressly incorporated by reference.
- the analytics engine module 209 can operate as the primary computational engine which transforms the analytics query into a search query and sends a signal representing the search query to the search engine controller module 205 .
- the search engine controller module 205 can perform a parallel distribution of the search query to one or more search engine server(s) (shown as 109 in FIG. 1B ), for example via an output signal 223 (shown as 123 in FIG. 1B ).
- the search engine(s) 109 performs search on various distributed search index nodes 215 a - 215 m and sends a signal (not shown) representing the search results to the analytics engine module 209 .
- the indexing module 219 collects, parses, and stores search data in search index nodes 215 a - 215 m via connections 225 a - 225 m to facilitate fast and accurate information retrieval.
- the indexing module 219 is described in more detail herein with regards to FIG. 3 .
- the analytics engine module 209 can receive data from the search engine controller module 205 and perform real-time computations on the data based on statistical, mathematical, logical heuristic and/or algorithmic functions to generate computed and aggregated results.
- the results can be further visually transformed based on the visualization rules 213 and presented to the user of UE 101 .
- the user can define rules and/or formulas by which the indexing module 219 or the analytics engine module 209 can calculate derived and/or computed attributes from the original data.
- the user-defined rules and formulas can be received from a UE 101 via an input signal 221 and stored in data store 211 .
- the attributes computed by the analytics engine module 209 may not be directly present in the original data and derived or computed from other attributes present in the original data using the rules and/or formula defined by the user.
- the user-defined rules and/or formulas can be applied on the data before the data is indexed by the indexing module 219 or at run-time before presenting the query results to the user via a UE 101 .
- the analytics engine module 209 receives the search results and performs statistical computations, aggregations, etc. on the results (e.g., in parallel).
- the analytics engine module 209 can store the analysis results in data store(s) 211 .
- the report module 217 produces reports from the analysis results, for example, by applying the visualization rules 213 to the results.
- the visualization rules can provide guidelines for reports such as, for example, chart types, colors, formats, etc.
- the visualization rules 213 can be interactively managed.
- the visualization rules can be modified or trained by self learning using machine learning techniques.
- the visualization rules 213 can be trained such that total sales report is presented as pie chart, while comparative sales report (e.g., among branches of an enterprise) can be presented as bar charts to enable comparison, based on history of users' report selections.
- the report module 217 can use machine learning techniques to learn (e.g., train visualization rules) based on data, data types, data analysis types, data analysis results, user selection history, etc.
- a user of UE 101 is given the capability to change presentation of data such as, for example, graph type, table formats, etc.
- the reports produced by the report module 217 are stored in data store(s) 211 and are available until changes (e.g., updates, inserts, deletes, etc.) in source data is recognized. In such change instances, the stored reports are erased from the data store(s) 211 and new reports are produced based on the new data.
- the business intelligence platform 200 can receive user feedback via the UI 107 of UE 101 of FIG. 1B to train and automatically improve various modules such as, for example, the natural language processing module 201 , the speech-to-text converter module 203 , the meta-information lookup module 207 , the analytics engine module 209 , or the report module 217 .
- the business intelligence platform 200 can also use the user feedback for improving the visualization rules 213 . These improvements enable the business intelligence platform 200 to automatically adapt to different use cases and become more accurate in delivering results for various queries in various use cases, over time.
- the user feedback can be provided either directly by the user via UE 101 or collected automatically by the business intelligence platform 200 , for example, based on the usage patterns of various users.
- FIG. 2B is a schematic block diagram of an index topology infrastructure of an indexing module, according to an embodiment.
- the index module 219 in FIG. 2A may employ an index topology (e.g., 230 ) to index and store data analytics, e.g., in the form as DataSet(s) (e.g., 231 ) which are persisted as search indices (e.g., 232 a - 232 n ).
- a DataSet 231 is stored with one or more search indices 232 a - 232 n , each of which then gets partitioned into smaller data sets, such as one or more index shards (e.g., 233 a - 233 n ) and segments (e.g., 235 a - 235 n ).
- index shards e.g., 233 a - 233 n
- segments e.g., 235 a - 235 n
- shards e.g., 233 a - 233 n
- segments e.g., 235 a - 235 n
- the natural language processing module e.g. 207 in FIG. 2A
- a query optimizer may then define an execution path for the intermediate query-formatted query, and this query gets transmitted to each of the shards (e.g., 233 a - 233 n , shards can exist in same machine or different machine).
- Each node engine (e.g., 234 a - 234 n ) may run a search query on the local index the distributed node is based on (e.g., search index 232 a for server nodes 234 a - n ) and select the eligible data.
- the indexing module 219 may employ a just-in-time-memory mechanism for data retrieval. Because each column of a data set may be indexed independently, instead of loading entire row, data for the columns of interests can be loaded to memory, in response to the server node engines (e.g., 234 a - n ) running the search query. In this way, the data input/output and transmission volume may be reduced, and usage of the memory is improved.
- the index module 219 may make efficient use of disk cache. For example, when a search requires a high memory, e.g., when the search is performed at a Cheetah system, the search engine controller module 205 can keep track of available memory and start using disk cache when system resources (such as memory space) is low. In this way, the search engine could be maintained without interruption due to resource unavailability.
- the selected data from each node engine 234 a - 234 n may go through multi-phased search aggregation to be aggregated.
- a post local search aggregator may be employed, which selects one master node from the server nodes 234 a - n and does the final aggregation on the master node.
- This aggregated data is then converted into a user-representable format and displayed using different visualization techniques.
- the indexing module 219 in FIG. 2A may employ sharded-compressed bit-map-indexing techniques, where data is stored in multiple shards 233 a - 233 n , which are configurable based on the data size.
- the indexing module 219 can employ multi-level search aggregators so that the data is distributed in 10 shards (e.g., 233 a - 233 n ) and each shard is placed in a separate server node, see e.g., 233 a placed in 234 a , 233 b placed in 234 b , and/or the like.
- an analytics query When an analytics query is initiated, it may be sent to each of these server nodes 234 a - n .
- each server node performs search aggregation for the data that belongs to that server node and returns the data to the master server node for the final aggregation. This mechanism could reduce the amount of data movement across a given server node, which improves overall efficiency in data search and aggregation in addition to making use of parallel computation.
- FIG. 3A is a schematic block diagram of a data indexing process pipeline, according to an embodiment.
- a user of a UE 101 of FIG. 1B selects data to be included in a query from data sources 301 .
- the data sources 301 can be similar to data source(s) 111 of FIG. 1B .
- the data sources 301 can include customer databases 303 (e.g., databases associated with a user or a group of users), third party data systems 305 (e.g., databases or files provided to the user by software providers, data providers, etc.), customer applications 307 (e.g., software applications associated with a user or a group of users such as, for example, financial applications), customer files 309 (files associated with a user or a group of users such as, for example, documents uploaded by the user via the UE 101 or by using file transfer protocols such as, for example, FTP/SFTP, SCP, etc.
- customer databases 303 e.g., databases associated with a user or a group of users
- third party data systems 305 e.g., databases or files provided to the user by software providers, data providers, etc.
- customer applications 307 e.g., software applications associated with a user or a group of users such as, for example, financial applications
- customer files 309 files associated with a user or a group of users
- a user wants to define a query as “annual sales by city” the user can select data fields representing sales value and city from a sales table in a customer database 303 .
- the data source(s) 301 can interact with the business intelligence platform 300 , which may obtain data from the data source(s) 301 .
- the indexing module 219 of FIG. 2A executes a data processing pipeline 311 .
- the indexing module 219 can receive the data selected by the user from data sources 301 and process the data through the data processing pipeline 311 by, for example, combining and indexing the data.
- the data processing pipeline 311 can include one or more database connectors (not shown in FIG. 3A ) to pull data from the customer databases 303 , and one or more custom connectors (not shown in FIG. 3A ) to pull data from the third party data systems 305 ).
- the data processing pipeline 311 can receive data associated with customer applications 307 from a UE 101 via an Application Programming Interface (API) (not shown in FIG. 3 ).
- API Application Programming Interface
- the data processing pipeline 311 can also receive customer files 309 from UE 101 via UI 107 or, for example, via a Secure Shell File Transfer Protocol (SFTP).
- SFTP Secure Shell File Transfer Protocol
- Data indexing process can include defining a data structure that improves the speed of data retrieval operations.
- indices can be defined using one or more columns of a database table, providing the basis for both rapid random lookups and efficient access of ordered records.
- mashup process can be also performed on the data, for example, by the indexing module 219 .
- a mashup process enables the data from various sources to be combined to produce new data sources (or newly searchable data sources) 301 .
- the term mashup includes, for example, easy, fast integration, frequently using open application programming interfaces (API) and data sources to produce results (e.g., answers to queries) that may not be related to the original reason for producing the raw source data.
- API application programming interfaces
- the mashup process by the data processing pipeline 311 can be performed based on processes of Extract, Transform, Load (ETL) layer 319 associated with a database or a data warehouse (not shown in FIG. 3 ).
- An ETL process can extract data from various data sources such as relational databases such as, for example, Oracle®, MySQL®, MS SQL Server®, PostGreSQL®, DB2®, etc.; non-relational databases and NoSQL storages such as, for example, MongoDB®, Cassandra®, CouchDB®, Redis®, HBase®, Hive® etc.; distributed file systems such as, for example, Apache's Hadoop® file systems etc.; other storage systems such as, for example, Netezza®, Terradata®, SAP Hana® etc.; third party software or services such as, for example, Salesforce®, NetSuite®, MS Dynamics®, MS Dynamics GP®, SugarCRM®, etc.
- the indexing module 219 can store the newly-produced data sets 313 by the data processing pipeline 311 in data store(s) 211 .
- the data sets 313 are de-normalized conceptual data entities extracted from data sources 301 to be used for defining search index nodes 317 .
- a search engine indexer 315 (similar to the search engine control module 205 ) can use the data sets 313 to define distributed search index nodes 317 .
- the distributed search index nodes 317 can be similar to search index nodes 215 a - 215 m .
- the search index nodes 317 can include data extracted, transformed, and loaded by the ETL layer 319 .
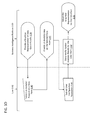
- FIGS. 3B-3D are example logic flow diagrams illustrating real-time business analytics query and report generation, according to an embodiment.
- a user 302 can submit a business analytics request 321 to the business intelligence platform 300 (also as shown as 300 in FIG. 3A ) via a user interface at a user compute device (e.g., see FIG. 5 ), which can retrieve a list of data sources for the query at 323 .
- the business analytics request 321 may include a user-desired, or user-interested data variable, such as “revenue,” “profit,” and/or the like.
- the business intelligence platform 300 may retrieve all available data sources.
- the business intelligence platform 300 can perform a preliminary search and retrieve relevant data sources, e.g., based on the user's past search history, the user's previously manually selected data sources, user industry, user geographical information, and/or the like.
- the user 302 may optionally select data sources for the user's inquiry at 324 (e.g., see FIG. 4B ).
- the user by operating a user compute device, can send a signal representing configuration parameters with regard to a selected data source to the business intelligence platform 300 .
- the business intelligence platform 300 may optionally send an access request to the user selected data source(s) at 325 , and in response, the data source(s) 301 may authorize data access of the business intelligence platform 300 , e.g., at 326 .
- the business intelligence platform 300 can define whether the user elects to further define a data set for the query at 327 . If no data set was previously-defined, the user may optionally define the data set at 328 . For example, the user may select data fields from a data table in a data source to define a customized data set (e.g., see FIG. 4C ). After the data set is defined or a previously defined data set is identified, the business intelligence platform 300 may aggregate the data source and defined data sets at 329 , and prepare to perform a data query.
- the user can input, via a user interface at the user compute device, a natural language question at 330 , which may be input before or after the user has configured the data source(s) and/or defined the data set(s).
- the user via the user compute device, can send a signal representing the natural language question to the business intelligence platform 300 .
- the business intelligence platform 300 can translate the natural language question into a query string at 332 (e.g., via the natural language processing module 201 in FIG. 2 ), and query the aggregated data sources and/or defined data sets at 333 .
- the data sources 301 can provide raw data as query results at 334 .
- the business intelligence platform 300 may provide the raw query data to the user 302 , via the user compute device, upon user request, e.g., in a spreadsheet format or a “.csv” file for the user to download, etc.
- the user may elects, via the user compute device, to obtain the business analytics query results in a report format at 335 . If the business intelligence platform 300 determines a report is requested by the user at 335 , the user 302 can elect, via the user compute device, to configure report format at 335 (e.g., chart type, desired display parameters, etc.).
- the user compute device can send a signal representing the report election to the business intelligence platform 300 .
- the business intelligence platform 300 may in turn generate graphical representation of the query results at 336 , which may be generated as output via a user interface at 337 (e.g., see FIGS. 6-8 and 10 ).
- a user 302 may interact with the business intelligence platform 300 via a user interface through the user compute device to dynamically change the graphical representation of business analytics query results.
- the business intelligence platform 300 may provide a graphical representation of data query results 339 , and the user 302 may submit, via the user compute device, an analytics request on a data point of the graphical representation of query results at 340 (e.g., a data plot curve, etc.), such as clicking or moving the mouse over a data point on a data plot curve, etc.
- business intelligence platform 300 can provide an engageable widget at 341 , such as but not limited to a dialog box, a drop-down menu, and/or any user-interactive user interface widget, which is triggered by a mouse click and/or the mouse moving over to a data point.
- An example engageable widget may include an analytics box on the selected data point (e.g., see the drill down drop box 701 in FIG. 7 , which may be used for interactive filtering of the data query results, based on an age-group, a deal type, a deal name, etc.).
- the user can submit the configuration parameter at 345 , and the business intelligence platform 300 can in turn dynamically update the data analytics for the data point associated with the user submitted configuration parameter at 342 , and adjust the graphical representation of analytics data query results at 343 .
- FIGS. 4A-4D are sample display menus for a real-time business intelligence providing system, according to an embodiment.
- FIG. 4A is a display menu for adding a new project.
- a project is a dedicated workspace for a user of UE 101 .
- This workspace can be in a local storage of UE 101 , in data store(s) 211 , or in a computation cloud associated with the business intelligence platform 200 .
- the workspace provides capability of exploring, analyzing data, producing reports and dashboards for a particular user. This is highly secure area which will be accessible with proper permissions.
- a user can sign into the business intelligence platform 200 using a user ID and a Password. After signing in, the user can define a project by, for example, defining a project name 401 , and a logo 403 . By clicking the button 405 , the new project is defined.
- FIG. 4B is a display menus for selecting data sources by a user of UE 101 as described with regards to FIG. 3 .
- a user of UE 101 can define a name 411 for a new data source to be added to the data sources 301 .
- the user can then select a type for the data source from a drop down menu 413 .
- Some standard data types can be, for example, MySQL®, Oracle®, MS SQL Server, etc.
- the user can also select “file upload” as data types. If “file upload” is selected, a new window is opened to allow the user to upload a file as a data source.
- the user can also select a configuration of the upload file to show, for example, if the upload file is a document, a spreadsheet, an image, a database table, etc.
- the user can define a data set as a data source explained herein with regards to FIG. 4C .
- a configuration window 415 enables the user to enter his/her credentials for authorizing access to a data source such as, for example, a database.
- the credentials may include a host name 417 , a port 419 , a database name 421 , a user ID 423 and password 425 , etc.
- the user can then click on button 427 to save the new data source.
- the user of UE 101 can select data from various data sources ( 301 ) and combine them into a new data set ( 313 ) (e.g., a table, a spreadsheet, etc.) by the data processing pipeline 311 .
- the user can select a data source (at 421 ) and enter his/her credentials indicating user's authority to access the data source such as a user name 423 and a password 425 .
- the save button 427 By pressing the save button 427 , the indicated data source is saved, for example, in data store(s) 211 and can be used by the business intelligence platform 200 for further analysis.
- FIG. 4C is a display menu for defining a new data set, according to an embodiment.
- the user can select a data source (e.g., a database) from the drop box 431 .
- the user can add columns from multiple data sources accessible to the user to produce a new data set through key relationships among the data sources. For example, if data sources are tables in relational databases, each data table has a primary key that uniquely specifies a tuple within the table.
- a data field of a table can be a foreign key that matches the primary key of another table. The foreign key can be used to cross-reference the two tables.
- the user can then select a table or data set (e.g., a datasheet) from the selected data source (at 433 ). For every table/data set selected at 433 , the corresponding set of column headers or field names is displayed in list 435 . The user can select fields from the selected table/data set by dragging the fields from table 435 and dropping them in box 437 . The user can also add every column using the Select All button 439 .
- a table or data set e.g., a datasheet
- the business intelligence platform 200 provides various types of data analysis elements such as, for example, dimensions ( 441 ), measures ( 443 ) and date/time ( 445 ).
- Dimensions 441 are the context or categories based on which measures 443 are summarized meaningfully such as, for example, “Sales by City”, where “City” is a dimension 441 .
- Measures are typically quantifiable (e.g., numeric) such as, for example, Salary, Revenue, Sales, Margin, etc.
- the date/time element is used to define a time dimension. For example, the user can assign a date column of the data set to the date/time element to define a time trend in data analysis.
- the business intelligence platform 200 can assign an element to each data column added to the new data set by default by inferring the data type of the data column based on a content of the column. For example, if a sales column (with numeric data values) is added to a data set, the sales column can be defined as a measure element 443 in the data set. As another example, if a name data column (with character string data values) is added to a data set, the name column can be defined as a dimension 441 in the data set. In some instances, the business intelligence platform 200 enables the user to reassign a column to a dimension 441 instead of a measure 443 by dragging and dropping the filed from list 435 into dimension 441 of table 437 .
- FIG. 4D is a display menu for defining relationships between data sets and/or data elements, according to an embodiment.
- the user is enabled to define key relationships (e.g., primary key, foreign key) across tables/data sets (e.g., if columns of data in the data set exist across tables/data sets) as well as unique keys.
- key relationships e.g., primary key, foreign key
- tables/data sets e.g., if columns of data in the data set exist across tables/data sets
- unique keys e.g., if a new data set contains columns of data across tables or data sources.
- a Primary Key/Foreign Key relationship can be defined.
- the ETL Layer 319 can automatically determine the relationships between tables by reading the metadata information or data dictionaries/definitions from the data source or by using heuristics, rules or other algorithms. For example, as seen in FIG.
- the user can select key fields from the data fields 451 using the drop box 453 ; select an operation such as, for example, database operation union (to combine tuples of two data tables and removes all duplicate tuples), database operation join (to connect two data tables over their common data column), etc. from the drop box 455 ; and apply the operation to selected data fields to define a relationship between the data fields.
- the user is also enabled to filter columns of the new data set based on a rule (not shown). For example, the user can define a rule by restricting the length of the column value (e.g., 10 digits), or enter a string value such as Sales to filter the added column based on the value.
- the rules can be combined using “AND”/“OR” clauses.
- the user is enabled to edit a defined data set (edit display is not shown).
- the user is also enabled to edit dimensions and measures associated with data fields of a data set (e.g., change a dimension into a measure).
- the user is enabled to define a new measure, or a new dimension, based on a combination of existing measures and/or dimensions using certain formula or rules.
- the user is also enabled to edit data set rules and/or define new rules.
- a new column is added to the data source (based on which a new data set is defined) and the data source has been reloaded (edited) to include the new column
- the user can be notified about the new column and the user is enabled to add the new column to the defined data set as a dimension, measure or a date/time element, for example, by updating the new data set, by defining a copy of the new data set including the new column, etc.
- the user is also enabled to rename a defined data set.
- a data set can be automatically created, for example by the business intelligence platform 200 , once the user connects a data source by using metadata associated with the data source, data dictionaries/definitions from the data source, heuristics, rules, one or more predefined algorithms, etc.
- the user is enabled to specify the frequency at which data is indexed from the data source.
- the user can choose frequencies such as, for example, one hour, six hours, one day, one week, etc.
- the user is enabled to choose precise times such as, for example 12 PM every day, etc.
- the user can also be enabled to choose the fields that uniquely define a record or a row of data to support data updates.
- the user can select the fields using which the new records can be fetched incrementally. For example, a date/time field can be selected to identify new records.
- the ETL Layer 319 can automatically determine the best frequency using certain predefined rules or by learning from previous data fetch instances using machine learning or heuristics algorithms.
- FIGS. 4A-4D are set-up display menus enabling a user to setup a project including selecting data sources, defining data sets, defining relations between data sets, etc.
- the business intelligence platform 200 can provide business intelligence to the user in response to user queries.
- FIG. 5 is a sample display menu for defining user queries, according to an embodiment.
- the user can type a question in window 501 and press the search icon 503 .
- the user can also ask a voice question by speaking into a microphone, by activating the voice input represented by symbol 505 .
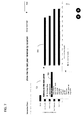
- FIG. 6 is a sample report provided by the real-time business intelligence platform, according to an embodiment.
- the user asked a question 601 “show me my last year revenue by location”.
- the bar chart of FIG. 6 shows the revenue by location by showing revenue values on the horizontal axis 603 and location values on the vertical axis 605 .
- the message 607 indicates that multiple attributes for the search has been found.
- the business intelligence platform 200 can provide an option to the user to allow the user to save the preferences, for example in data store 211 .
- the business intelligence platform 200 can also automatically learn from the user preferences for future searches.
- the business intelligence platform 200 can identify a closest match based on various criteria such as, for example, spell corrections, semantic matching techniques, dictionaries, searching private or public knowledge repositories, third party APIs, rules, heuristics, natural language processing or machine learning algorithms, user preferences, collaborative learning techniques, and/or other techniques to provide relevant suggestions or automatically mapping.
- criteria such as, for example, spell corrections, semantic matching techniques, dictionaries, searching private or public knowledge repositories, third party APIs, rules, heuristics, natural language processing or machine learning algorithms, user preferences, collaborative learning techniques, and/or other techniques to provide relevant suggestions or automatically mapping.
- the business intelligence platform 200 can define a format of the report (e.g., chart type) based on a default value without user-specified information, or based on a user preference entered by the user during system setup. For example, a default value for a “revenue by location” chart can be set as a bar chart, a line chart, etc.
- the business intelligence platform 200 can also enable the user to select and update report format while the report is provided. In some instances, the business intelligence platform 200 can learn from user selections and provide subsequent reports based on formats previously selected by the user for similar reports.
- the user can refine the answer by filtering the answer using an ad-hoc drill down as shown in FIG. 7 .
- the user can select a dimension from an engageable widget triggered by the user clicking on, or moving the mouse over a data point; the engageable widget can include a drill down drop box 701 to be used for interactive filtering of the answer based on, for example, an age-group 705 , a deal type, a deal name, etc.
- the dimensions in the drop box 701 can be the dimensions selected by the user during a setup as discussed with regards to FIG. 4C above.
- the user is allowed to filter results, for example, by appending text to the existing question or search query or by providing a follow-up question or search query.
- FIG. 8 is a sample display menu for applying interactive filtering on a real-time business intelligence report, according to an embodiment.
- the age-group table 801 can provide various age selection filters to the user for filtering the query answer 703 .
- the values of age-groups 803 in FIG. 8 can be values of a data field age-group in a data set defined as seen in FIG. 4C .
- values of the age-group can be “18 to 24”, “25 to 34”, “35 to 44”, etc.
- the analytics engine module 209 of the business intelligence platform 200 can update the bar chart 703 and produce the bar chart 805 based on the selected filter, substantially in real-time.
- the menu for interactive filtering or drill downs can be automatically generated based on the data using certain algorithms or heuristics, or predefined by the user. Furthermore, the results can be saved or bookmarked for future reference or use for example, in the data store 211 .
- the business intelligence platform 200 can recommend questions, search queries, reports, dashboards, filters, drill downs, etc., based on the user's prior questions or search queries, the user's interests, or based on trends and what other users are asking on the platform using certain rules or algorithms to calculate affinity or relevance of the recommendations.
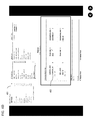
- FIG. 9 is a display user interface for manual building of complex reports, according to one embodiment.
- the user is enabled to assign one or more dimensions from list 901 to a report axis (e.g., 903 ).
- the user is also enabled to assign one or more measures from list 905 to another report axis (e.g., 907 ).
- the user can also configure the report by defining embedability, visibility, editability, and type of the report ( 909 ).
- FIG. 10 is a display user interface for manual building of dashboards by selecting reports, according to an embodiment.
- a user can select reports to be included in a dashboard from a drop down menu representing a list of available reports.
- the list of available reports may include default reports, reports previously defined by a user and saved in a storage location (e.g., data store(s) 211 ), etc.
- the dashboard of FIG. 10 is built from a pie report 1001 , a “monthly revenue by gender” report 1003 , a “revenue by location” report 1005 , and a grid report 1007 .
- FIG. 11 is a display menu for defining role-based security groups of users, according to an embodiment.
- an authorized user e.g., a manager
- a user can define categories of data sets and associate data sets with categories at setup time.
- the business intelligence platform 200 can use default categories and associate data sets with categories, for example, based on reports, report types, etc.
- FIG. 12 is a display menu for defining multi-tenant solutions, according to an embodiment.
- a multi-tenant business intelligence solution can serve multiple customers (tenants), while each customer can be given the ability to customize some parts of the solution such as, for example, color of the user interface (UI), business rules, visualization rules, report formats, etc.
- UI user interface
- a customer can build a business intelligence solution as discussed with regards to FIGS. 4-11 and publish to multiple other customers at click of a publish button (e.g., 1201 in FIG. 12 ).
- the business intelligence platform 200 enables users to perform real-time collaboration on the data.
- the user is enabled to start a discussion on a report, a chart within a report, data points within a chart, etc.
- the user can add other users into the discussion thread. Users with proper access are allowed to view various discussion threads and participate in discussions by leaving comments.
- the users mentioned in a discussion thread can receive notifications by email, text message, or other digital communication channels.
- the business intelligence platform 200 enables users to perform advanced data analysis such as, for example, predictive analytics and forecasting by asking a question. For example, a user may ask “Show me the estimated sales for the next 4 quarters”.
- the business intelligence platform 200 can perform predictive analytics, for example, by executing certain pre-built data mining algorithms, to provide responses to questions asked by the users.
- the business intelligence platform 200 can include a notification module (not shown in FIG. 2 ).
- the notification module can monitor the data based on various user-defined or automated rules and notify the user of any interesting patterns, changes, deviations, etc. in the data. Alerts from the notification module can be communicated to the user in various forms either as notifications via the UI 107 , feeds, emails, chat messages, text messages, voice messages, and/or other forms of communication.
- Hardware modules can include, for example, a general-purpose processor, a field programmable gate array (FPGA), and/or an application specific integrated circuit (ASIC).
- Software modules (executed on hardware) can be expressed in a variety of software languages (e.g., computer code), including C, C++, JavaTM, Ruby, Python, JavaScript, Perl, PHP, Visual BasicTM, and other object-oriented, procedural, or other programming language and development tools.
- Examples of computer code include, but are not limited to, micro-code or micro-instructions, machine instructions, such as produced by a compiler, code used to produce a web service, and files containing higher-level instructions that are executed by a computer using an interpreter. Additional examples of computer code include, but are not limited to, control signals, encrypted code, and compressed code.
- Some embodiments described herein relate to a computer storage product with a non-transitory computer-readable medium (also can be referred to as a non-transitory processor-readable medium) having instructions or computer code thereon for performing various computer-implemented operations.
- the computer-readable medium or processor-readable medium
- the media and computer code may be those designed and constructed for the specific purpose or purposes.
- non-transitory computer-readable media include, but are not limited to, magnetic storage media such as hard disks, floppy disks, and magnetic tape; optical storage media such as Compact Disc/Digital Video Discs (CD/DVDs), Compact Disc-Read Only Memories (CD-ROMs), and holographic devices; magneto-optical storage media such as optical disks; carrier wave signal processing modules; and hardware devices that are specially configured to store and execute program code, such as Application-Specific Integrated Circuits (ASICs), Programmable Logic Devices (PLDs), Read-Only Memory (ROM) and Random-Access Memory (RAM) devices.
- ASICs Application-Specific Integrated Circuits
- PLDs Programmable Logic Devices
- ROM Read-Only Memory
- RAM Random-Access Memory
- a query such as, for example, “revenue by location” can be provided by a user of UE 101 and sent by the UE 101 to the business intelligence platform 200 of FIG. 2 via an input signal 221 .
- the natural language processing module 201 of the business intelligence platform 200 can process the query and determine keywords, for example, by approximate string matching. For example, keywords “revenue” and “location” can be determined from the above query.
- the meta-information lookup module 207 can perform a search on metadata (e.g., location), for example, in search index nodes 215 a - 215 m .
- the metadata search can identify data sets 313 that include location and revenue data.
- the search engine controller module 205 can send a signal to initiate a search by the search engine service(s) 109 of FIG. 1 for revenue values in the identified data sets 313 .
- the analytics engine module 209 can send a signal to the UE 101 providing identified data sets 313 to the user and allowing the user to select a subset of data sets 313 for search.
- the search results can be stored in data store(s) 211 .
- the analytics engine module 209 can analyze search results to, for example, summarize the revenue values based on the location and store the analysis results in data store(s) 211 .
- the report module 217 can use the analysis results to define reports associated with the query response based on the visualization rules 213 .
- the reports can be presented on a UI 107 of UE 101 via an output signal 223 .
Abstract
Description
Claims (22)
Priority Applications (1)
| Application Number | Priority Date | Filing Date | Title |
|---|---|---|---|
| US14/304,490 US9501585B1 (en) | 2013-06-13 | 2014-06-13 | Methods and system for providing real-time business intelligence using search-based analytics engine |
Applications Claiming Priority (2)
| Application Number | Priority Date | Filing Date | Title |
|---|---|---|---|
| US201361834608P | 2013-06-13 | 2013-06-13 | |
| US14/304,490 US9501585B1 (en) | 2013-06-13 | 2014-06-13 | Methods and system for providing real-time business intelligence using search-based analytics engine |
Publications (1)
| Publication Number | Publication Date |
|---|---|
| US9501585B1 true US9501585B1 (en) | 2016-11-22 |
Family
ID=57287727
Family Applications (3)
| Application Number | Title | Priority Date | Filing Date |
|---|---|---|---|
| US14/304,487 Active US9665662B1 (en) | 2013-06-13 | 2014-06-13 | Methods and system for providing real-time business intelligence using natural language queries |
| US14/304,490 Active US9501585B1 (en) | 2013-06-13 | 2014-06-13 | Methods and system for providing real-time business intelligence using search-based analytics engine |
| US15/587,751 Active 2035-05-04 US10657125B1 (en) | 2013-06-13 | 2017-05-05 | Methods and system for providing real-time business intelligence using natural language queries |
Family Applications Before (1)
| Application Number | Title | Priority Date | Filing Date |
|---|---|---|---|
| US14/304,487 Active US9665662B1 (en) | 2013-06-13 | 2014-06-13 | Methods and system for providing real-time business intelligence using natural language queries |
Family Applications After (1)
| Application Number | Title | Priority Date | Filing Date |
|---|---|---|---|
| US15/587,751 Active 2035-05-04 US10657125B1 (en) | 2013-06-13 | 2017-05-05 | Methods and system for providing real-time business intelligence using natural language queries |
Country Status (1)
| Country | Link |
|---|---|
| US (3) | US9665662B1 (en) |
Cited By (66)
| Publication number | Priority date | Publication date | Assignee | Title |
|---|---|---|---|---|
| US20160092572A1 (en) * | 2014-09-25 | 2016-03-31 | Oracle International Corporation | Semantic searches in a business intelligence system |
| US20160098479A1 (en) * | 2014-10-02 | 2016-04-07 | Shahbaz Anwar | System and process for natural language processing and reporting |
| US20160253380A1 (en) * | 2015-02-26 | 2016-09-01 | Red Hat, Inc. | Database query optimization |
| CN106713455A (en) * | 2016-12-22 | 2017-05-24 | 北京锐安科技有限公司 | System, method and device for processing client requests |
| US20170177660A1 (en) * | 2015-12-16 | 2017-06-22 | Adobe Systems Incorporated | Natural language embellishment generation and summarization for question-answering systems |
| CN107122491A (en) * | 2017-05-19 | 2017-09-01 | 深圳市优必选科技有限公司 | Method for data interaction |
| CN107203506A (en) * | 2017-06-06 | 2017-09-26 | 山东浪潮通软信息科技有限公司 | A kind of report form generation method and device |
| US20180046720A1 (en) * | 2016-02-14 | 2018-02-15 | Ousmane Conde | XoomDat, real-time search and analytics information system |
| US10055421B1 (en) * | 2017-04-14 | 2018-08-21 | Xactly Corporation | Pre-execution query optimization |
| US20180349473A1 (en) * | 2017-06-06 | 2018-12-06 | Mastercard International Incorporated | Method and system for conversational input device with intelligent crowd-sourced options |
| CN109086396A (en) * | 2018-07-28 | 2018-12-25 | 重庆柚瓣家科技有限公司 | Endowment big data analysis platform |
| US20190138648A1 (en) * | 2017-11-09 | 2019-05-09 | Adobe Inc. | Intelligent analytics interface |
| US10346139B2 (en) * | 2016-02-23 | 2019-07-09 | Bank Of America Corporation | Rules engine having an interactive, dual, side-by-side display |
| WO2019144192A1 (en) * | 2018-01-24 | 2019-08-01 | Eqstats Pty Ltd | System and method for the automated interpretation of operational data |
| US10417247B2 (en) | 2014-09-25 | 2019-09-17 | Oracle International Corporation | Techniques for semantic searching |
| CN110399438A (en) * | 2018-04-24 | 2019-11-01 | 北京视联动力国际信息技术有限公司 | A kind of GIS point information query method and device |
| CN110489476A (en) * | 2019-08-22 | 2019-11-22 | 金瓜子科技发展(北京)有限公司 | Data processing method, system and server |
| US10516980B2 (en) | 2015-10-24 | 2019-12-24 | Oracle International Corporation | Automatic redisplay of a user interface including a visualization |
| CN110737850A (en) * | 2019-09-10 | 2020-01-31 | 苏宁云计算有限公司 | chart generation method and device |
| US10558686B2 (en) * | 2016-12-05 | 2020-02-11 | Sap Se | Business intelligence system dataset navigation based on user interests clustering |
| US10621172B2 (en) * | 2016-07-10 | 2020-04-14 | Sisense Ltd. | System and method for efficiently generating responses to queries |
| WO2020191353A1 (en) | 2019-03-20 | 2020-09-24 | Promethium, Inc. | Natural language based processing of data stored across heterogeneous data sources |
| US10795902B1 (en) * | 2016-04-12 | 2020-10-06 | Tableau Software, Inc. | Applying natural language pragmatics in a data visualization user interface |
| US10817527B1 (en) * | 2016-04-12 | 2020-10-27 | Tableau Software, Inc. | Systems and methods of using natural language processing for visual analysis of a data set |
| US20200356225A1 (en) * | 2016-11-07 | 2020-11-12 | Tableau Software, Inc. | Data Preparation User Interface with Conglomerate Heterogeneous Process Flow Elements |
| US10846481B2 (en) * | 2018-06-29 | 2020-11-24 | FinancialForce.com, Inc. | Method and system for bridging disparate platforms to automate a natural language interface |
| CN112052256A (en) * | 2020-09-02 | 2020-12-08 | 平安资产管理有限责任公司 | Multi-version request returning method and device, computer equipment and readable storage medium |
| CN112347200A (en) * | 2020-11-24 | 2021-02-09 | 武汉烽火众智数字技术有限责任公司 | Vehicle simultaneous analysis method based on big data |
| US10917587B2 (en) | 2017-06-02 | 2021-02-09 | Oracle International Corporation | Importing and presenting data |
| US10956237B2 (en) | 2017-06-02 | 2021-03-23 | Oracle International Corporation | Inter-application sharing of business intelligence data |
| US10997217B1 (en) | 2019-11-10 | 2021-05-04 | Tableau Software, Inc. | Systems and methods for visualizing object models of database tables |
| US11010396B1 (en) * | 2016-04-12 | 2021-05-18 | Tableau Software, Inc. | Data visualization user interface using cohesion of sequential natural language commands |
| CN112926006A (en) * | 2020-12-23 | 2021-06-08 | 江苏园上园智能科技有限公司 | Application system based on AIE engine platform and implementation method |
| US11030207B1 (en) * | 2016-04-12 | 2021-06-08 | Tableau Software, Inc. | Updating displayed data visualizations according to identified conversation centers in natural language commands |
| US11030255B1 (en) | 2019-04-01 | 2021-06-08 | Tableau Software, LLC | Methods and systems for inferring intent and utilizing context for natural language expressions to generate data visualizations in a data visualization interface |
| US11042558B1 (en) * | 2019-09-06 | 2021-06-22 | Tableau Software, Inc. | Determining ranges for vague modifiers in natural language commands |
| US20210191923A1 (en) * | 2019-12-24 | 2021-06-24 | Sap Se | Platform for conversation-based insight search in analytics systems |
| US11048871B2 (en) * | 2018-09-18 | 2021-06-29 | Tableau Software, Inc. | Analyzing natural language expressions in a data visualization user interface |
| US11048396B2 (en) * | 2017-10-02 | 2021-06-29 | Fisher-Rosemount Systems, Inc. | Systems and methods for configuring and presenting a display navigation hierarchy in a process plant |
| US11055489B2 (en) * | 2018-10-08 | 2021-07-06 | Tableau Software, Inc. | Determining levels of detail for data visualizations using natural language constructs |
| CN113094034A (en) * | 2021-04-02 | 2021-07-09 | 上海中通吉网络技术有限公司 | Enterprise BI platform based on rule engine and construction method and equipment thereof |
| CN113392228A (en) * | 2021-08-03 | 2021-09-14 | 广域铭岛数字科技有限公司 | Abnormity prediction and tracing method, system, equipment and medium based on automobile production |
| CN113448931A (en) * | 2021-07-01 | 2021-09-28 | 京东科技控股股份有限公司 | Data processing method, service transaction platform and service providing platform |
| CN113468246A (en) * | 2021-07-20 | 2021-10-01 | 上海齐屹信息科技有限公司 | Intelligent data counting and subscribing system and method based on OLTP |
| CN113721976A (en) * | 2021-07-31 | 2021-11-30 | 远光软件股份有限公司 | BI analysis software-based data migration method and device, storage medium and electronic equipment |
| US11232088B2 (en) * | 2019-04-12 | 2022-01-25 | Adp, Llc | Method and system for interactive search indexing |
| US11244006B1 (en) | 2016-04-12 | 2022-02-08 | Tableau Software, Inc. | Using natural language processing for visual analysis of a data set |
| US11301631B1 (en) | 2020-10-05 | 2022-04-12 | Tableau Software, LLC | Visually correlating individual terms in natural language input to respective structured phrases representing the natural language input |
| US20220129450A1 (en) * | 2020-10-23 | 2022-04-28 | Royal Bank Of Canada | System and method for transferable natural language interface |
| US11334565B1 (en) * | 2016-10-28 | 2022-05-17 | Intuit, Inc. | System to convert natural-language financial questions into database queries |
| US20220261412A1 (en) * | 2018-12-14 | 2022-08-18 | Sisense Ltd. | System and method for partitioning data based on authorization rules |
| US11429264B1 (en) | 2018-10-22 | 2022-08-30 | Tableau Software, Inc. | Systems and methods for visually building an object model of database tables |
| US11429271B2 (en) | 2019-11-11 | 2022-08-30 | Tableau Software, LLC | Methods and user interfaces for generating level of detail calculations for data visualizations |
| US20230023134A1 (en) * | 2021-07-26 | 2023-01-26 | Microstrategy Incorporated | Lookup and relationship caches for dynamic fetching |
| US11614857B2 (en) | 2017-06-02 | 2023-03-28 | Oracle International Corporation | Importing, interpreting, and presenting data |
| US11640500B2 (en) | 2019-07-10 | 2023-05-02 | FinancialForce.com, Inc. | Platform interpretation of user input converted into standardized input |
| US11651312B2 (en) | 2016-06-23 | 2023-05-16 | FinancialForce.com, Inc. | Combining batch and queueable technologies in a platform for large volume parallel processing |
| US11698933B1 (en) | 2020-09-18 | 2023-07-11 | Tableau Software, LLC | Using dynamic entity search during entry of natural language commands for visual data analysis |
| US11704319B1 (en) | 2021-10-14 | 2023-07-18 | Tableau Software, LLC | Table calculations for visual analytics using concise level of detail semantics |
| US11782997B2 (en) * | 2020-02-13 | 2023-10-10 | Verity Platforms Inc. | Information platform systems and methods |
| US11792177B2 (en) | 2016-06-22 | 2023-10-17 | Certinia Inc. | Seamless authentication for an application development platform |
| US11790182B2 (en) | 2017-12-13 | 2023-10-17 | Tableau Software, Inc. | Identifying intent in visual analytical conversations |
| US11868231B2 (en) | 2019-01-08 | 2024-01-09 | Certinia Inc. | System and method for evaluating code by a hybrid of local and cloud-based computers |
| US11870909B2 (en) | 2018-03-01 | 2024-01-09 | Certinia Inc. | Efficient block chain generation |
| US11886806B2 (en) | 2016-09-21 | 2024-01-30 | Certinia Inc. | Templating process for a multi-page formatted document |
| US11921979B2 (en) | 2018-10-22 | 2024-03-05 | Tableau Software, Inc. | Data preparation user interface with configurable process flow elements |
Families Citing this family (89)
| Publication number | Priority date | Publication date | Assignee | Title |
|---|---|---|---|---|
| US9318108B2 (en) | 2010-01-18 | 2016-04-19 | Apple Inc. | Intelligent automated assistant |
| US8977255B2 (en) | 2007-04-03 | 2015-03-10 | Apple Inc. | Method and system for operating a multi-function portable electronic device using voice-activation |
| US8676904B2 (en) | 2008-10-02 | 2014-03-18 | Apple Inc. | Electronic devices with voice command and contextual data processing capabilities |
| US20120311585A1 (en) | 2011-06-03 | 2012-12-06 | Apple Inc. | Organizing task items that represent tasks to perform |
| US10417037B2 (en) | 2012-05-15 | 2019-09-17 | Apple Inc. | Systems and methods for integrating third party services with a digital assistant |
| KR102516577B1 (en) | 2013-02-07 | 2023-04-03 | 애플 인크. | Voice trigger for a digital assistant |
| US10652394B2 (en) | 2013-03-14 | 2020-05-12 | Apple Inc. | System and method for processing voicemail |
| US10748529B1 (en) | 2013-03-15 | 2020-08-18 | Apple Inc. | Voice activated device for use with a voice-based digital assistant |
| US10176167B2 (en) | 2013-06-09 | 2019-01-08 | Apple Inc. | System and method for inferring user intent from speech inputs |
| US10255320B1 (en) | 2014-01-27 | 2019-04-09 | Microstrategy Incorporated | Search integration |
| US11921715B2 (en) * | 2014-01-27 | 2024-03-05 | Microstrategy Incorporated | Search integration |
| US11386085B2 (en) | 2014-01-27 | 2022-07-12 | Microstrategy Incorporated | Deriving metrics from queries |
| US10170123B2 (en) | 2014-05-30 | 2019-01-01 | Apple Inc. | Intelligent assistant for home automation |
| US9715875B2 (en) | 2014-05-30 | 2017-07-25 | Apple Inc. | Reducing the need for manual start/end-pointing and trigger phrases |
| EP3149728B1 (en) | 2014-05-30 | 2019-01-16 | Apple Inc. | Multi-command single utterance input method |
| US9338493B2 (en) | 2014-06-30 | 2016-05-10 | Apple Inc. | Intelligent automated assistant for TV user interactions |
| US10733619B1 (en) | 2015-01-27 | 2020-08-04 | Wells Fargo Bank, N.A. | Semantic processing of customer communications |
| US9886953B2 (en) | 2015-03-08 | 2018-02-06 | Apple Inc. | Virtual assistant activation |
| BR112017019015A2 (en) * | 2015-03-09 | 2018-04-17 | Koninklijke Philips N.V. | system that facilitates the use of user-entered keywords to search for related clinical concepts, and method for facilitating the use of user-entered keywords to search for related clinical concepts |
| US10200824B2 (en) | 2015-05-27 | 2019-02-05 | Apple Inc. | Systems and methods for proactively identifying and surfacing relevant content on a touch-sensitive device |
| US10268449B1 (en) * | 2015-06-25 | 2019-04-23 | EMC IP Holding Company LLC | Natural order in API calls |
| US20160378747A1 (en) | 2015-06-29 | 2016-12-29 | Apple Inc. | Virtual assistant for media playback |
| US10740384B2 (en) | 2015-09-08 | 2020-08-11 | Apple Inc. | Intelligent automated assistant for media search and playback |
| US10671428B2 (en) | 2015-09-08 | 2020-06-02 | Apple Inc. | Distributed personal assistant |
| US10747498B2 (en) | 2015-09-08 | 2020-08-18 | Apple Inc. | Zero latency digital assistant |
| US10331312B2 (en) | 2015-09-08 | 2019-06-25 | Apple Inc. | Intelligent automated assistant in a media environment |
| US10691473B2 (en) | 2015-11-06 | 2020-06-23 | Apple Inc. | Intelligent automated assistant in a messaging environment |
| US10956666B2 (en) | 2015-11-09 | 2021-03-23 | Apple Inc. | Unconventional virtual assistant interactions |
| US20170177701A1 (en) * | 2015-12-21 | 2017-06-22 | Sap Se | Systems and methods for smart analytics interface |
| US10223066B2 (en) | 2015-12-23 | 2019-03-05 | Apple Inc. | Proactive assistance based on dialog communication between devices |
| US10311049B2 (en) * | 2016-05-16 | 2019-06-04 | Sap Se | Pattern-based query result enhancement |
| US10586535B2 (en) | 2016-06-10 | 2020-03-10 | Apple Inc. | Intelligent digital assistant in a multi-tasking environment |
| DK201670540A1 (en) | 2016-06-11 | 2018-01-08 | Apple Inc | Application integration with a digital assistant |
| DK179415B1 (en) | 2016-06-11 | 2018-06-14 | Apple Inc | Intelligent device arbitration and control |
| US10650621B1 (en) | 2016-09-13 | 2020-05-12 | Iocurrents, Inc. | Interfacing with a vehicular controller area network |
| US10754969B2 (en) | 2016-09-22 | 2020-08-25 | International Business Machines Corporation | Method to allow for question and answer system to dynamically return different responses based on roles |
| US10382440B2 (en) * | 2016-09-22 | 2019-08-13 | International Business Machines Corporation | Method to allow for question and answer system to dynamically return different responses based on roles |
| US10423631B2 (en) * | 2017-01-13 | 2019-09-24 | International Business Machines Corporation | Automated data exploration and validation |
| DK180048B1 (en) | 2017-05-11 | 2020-02-04 | Apple Inc. | MAINTAINING THE DATA PROTECTION OF PERSONAL INFORMATION |
| US10726832B2 (en) | 2017-05-11 | 2020-07-28 | Apple Inc. | Maintaining privacy of personal information |
| DK179496B1 (en) | 2017-05-12 | 2019-01-15 | Apple Inc. | USER-SPECIFIC Acoustic Models |
| DK201770429A1 (en) | 2017-05-12 | 2018-12-14 | Apple Inc. | Low-latency intelligent automated assistant |
| DK179745B1 (en) | 2017-05-12 | 2019-05-01 | Apple Inc. | SYNCHRONIZATION AND TASK DELEGATION OF A DIGITAL ASSISTANT |
| US20180336892A1 (en) | 2017-05-16 | 2018-11-22 | Apple Inc. | Detecting a trigger of a digital assistant |
| US20180336275A1 (en) | 2017-05-16 | 2018-11-22 | Apple Inc. | Intelligent automated assistant for media exploration |
| US11107139B1 (en) * | 2017-08-10 | 2021-08-31 | Intuit Inc. | Computing system learning of a merchant category code |
| US10733163B2 (en) * | 2017-09-14 | 2020-08-04 | International Business Machines Corporation | Record insertion by generating unique index bases |
| CN108132933A (en) * | 2017-12-28 | 2018-06-08 | 中译语通科技(青岛)有限公司 | A kind of generation method across language analysis report |
| US10818288B2 (en) | 2018-03-26 | 2020-10-27 | Apple Inc. | Natural assistant interaction |
| US10909331B2 (en) * | 2018-03-30 | 2021-02-02 | Apple Inc. | Implicit identification of translation payload with neural machine translation |
| US11145294B2 (en) | 2018-05-07 | 2021-10-12 | Apple Inc. | Intelligent automated assistant for delivering content from user experiences |
| US10928918B2 (en) | 2018-05-07 | 2021-02-23 | Apple Inc. | Raise to speak |
| US10892996B2 (en) | 2018-06-01 | 2021-01-12 | Apple Inc. | Variable latency device coordination |
| DK180639B1 (en) | 2018-06-01 | 2021-11-04 | Apple Inc | DISABILITY OF ATTENTION-ATTENTIVE VIRTUAL ASSISTANT |
| DK179822B1 (en) | 2018-06-01 | 2019-07-12 | Apple Inc. | Voice interaction at a primary device to access call functionality of a companion device |
| US10963492B2 (en) * | 2018-06-14 | 2021-03-30 | Google Llc | Generation of domain-specific models in networked system |
| US11157704B2 (en) | 2018-06-18 | 2021-10-26 | DataChat.ai | Constrained natural language processing |
| US11462215B2 (en) | 2018-09-28 | 2022-10-04 | Apple Inc. | Multi-modal inputs for voice commands |
| US11348573B2 (en) | 2019-03-18 | 2022-05-31 | Apple Inc. | Multimodality in digital assistant systems |
| CN110033851B (en) * | 2019-04-02 | 2022-07-26 | 腾讯科技(深圳)有限公司 | Information recommendation method and device, storage medium and server |
| US11120788B2 (en) * | 2019-05-02 | 2021-09-14 | Microsoft Technology Licensing, Llc | Organizational-based language model generation |
| DK201970509A1 (en) | 2019-05-06 | 2021-01-15 | Apple Inc | Spoken notifications |
| US11307752B2 (en) | 2019-05-06 | 2022-04-19 | Apple Inc. | User configurable task triggers |
| US11263264B2 (en) * | 2019-05-17 | 2022-03-01 | GraphSQL, Inc. | Management of graphs using secondary index vertices |
| US11140099B2 (en) | 2019-05-21 | 2021-10-05 | Apple Inc. | Providing message response suggestions |
| DK201970510A1 (en) | 2019-05-31 | 2021-02-11 | Apple Inc | Voice identification in digital assistant systems |
| DK180129B1 (en) | 2019-05-31 | 2020-06-02 | Apple Inc. | User activity shortcut suggestions |
| US11468890B2 (en) | 2019-06-01 | 2022-10-11 | Apple Inc. | Methods and user interfaces for voice-based control of electronic devices |
| US20210064775A1 (en) * | 2019-09-03 | 2021-03-04 | International Business Machines Corporation | Nlp workspace collaborations |
| US11614970B2 (en) | 2019-12-06 | 2023-03-28 | Microstrategy Incorporated | High-throughput parallel data transmission |
| US11100128B2 (en) * | 2020-01-03 | 2021-08-24 | Capital One Services, Llc | Cascading data impact visualization tool |
| US11061543B1 (en) | 2020-05-11 | 2021-07-13 | Apple Inc. | Providing relevant data items based on context |
| US11183193B1 (en) | 2020-05-11 | 2021-11-23 | Apple Inc. | Digital assistant hardware abstraction |
| US11490204B2 (en) | 2020-07-20 | 2022-11-01 | Apple Inc. | Multi-device audio adjustment coordination |
| US11438683B2 (en) | 2020-07-21 | 2022-09-06 | Apple Inc. | User identification using headphones |
| JP2022065502A (en) * | 2020-10-15 | 2022-04-27 | 株式会社日立製作所 | ETL workflow recommendation device, ETL workflow recommendation method and ETL workflow recommendation system |
| US11630833B2 (en) * | 2020-10-29 | 2023-04-18 | International Business Machines Corporation | Extract-transform-load script generation |
| AU2020104100A4 (en) * | 2020-10-30 | 2021-02-25 | Grafa Pty Ltd | An Electronic Data Analysis System and Method |
| US11500865B1 (en) * | 2021-03-31 | 2022-11-15 | Amazon Technologies, Inc. | Multiple stage filtering for natural language query processing pipelines |
| US11604794B1 (en) | 2021-03-31 | 2023-03-14 | Amazon Technologies, Inc. | Interactive assistance for executing natural language queries to data sets |
| US11726994B1 (en) | 2021-03-31 | 2023-08-15 | Amazon Technologies, Inc. | Providing query restatements for explaining natural language query results |
| US11334223B1 (en) | 2021-04-14 | 2022-05-17 | DataChat.ai | User interface for data analytics systems |
| US20220342873A1 (en) * | 2021-04-21 | 2022-10-27 | Virtualitics, Inc. | Systems and Methods for Natural Language Querying |
| US11610690B2 (en) | 2021-07-13 | 2023-03-21 | Iqvia Inc. | Machine reasoning as a service |
| KR20230079729A (en) * | 2021-11-29 | 2023-06-07 | 주식회사 포티투마루 | Method for converting natural language query to sql and device thereof |
| CN114860737B (en) * | 2022-06-28 | 2022-09-20 | 北京世纪好未来教育科技有限公司 | Processing method, device, equipment and medium of teaching and research data |
| US20240020538A1 (en) * | 2022-07-18 | 2024-01-18 | SuSea, Inc. | Systems and methods for real-time search based generative artificial intelligence |
| CN115271648B (en) * | 2022-07-19 | 2023-10-10 | 广东省投资和信用中心(广东省发展和改革事务中心) | Project visual supervision system, method, equipment and storage medium |
| US11748392B1 (en) * | 2022-09-30 | 2023-09-05 | N. Harris Computer Corporation | Systems and methods for substantially real-time adaptive report generation |
Citations (30)
| Publication number | Priority date | Publication date | Assignee | Title |
|---|---|---|---|---|
| US5809499A (en) | 1995-10-20 | 1998-09-15 | Pattern Discovery Software Systems, Ltd. | Computational method for discovering patterns in data sets |
| US6101491A (en) * | 1995-07-07 | 2000-08-08 | Sun Microsystems, Inc. | Method and apparatus for distributed indexing and retrieval |
| US20020049747A1 (en) * | 2000-06-06 | 2002-04-25 | Shigekazu Inohara | Method for integrating and accessing of heterogeneous data sources |
| US20040088158A1 (en) * | 2002-10-31 | 2004-05-06 | Phillip Sheu | Structured natural language query and knowledge system |
| US20050149496A1 (en) | 2003-12-22 | 2005-07-07 | Verity, Inc. | System and method for dynamic context-sensitive federated search of multiple information repositories |
| US20080071772A1 (en) | 2006-09-14 | 2008-03-20 | Thomson Global Resources | Information-retrieval systems, methods, and software with content relevancy enhancements |
| US20080235199A1 (en) | 2007-03-19 | 2008-09-25 | Yunyao Li | Natural language query interface, systems, and methods for a database |
| US7548909B2 (en) | 2006-06-13 | 2009-06-16 | Microsoft Corporation | Search engine dash-board |
| US7606835B2 (en) | 2006-02-14 | 2009-10-20 | Oracle International Corporation | Automatic rules driven data visualization selection |
| US7606805B2 (en) | 2000-07-28 | 2009-10-20 | EasyAsk Acquisition, LLC | Distributed search system and method |
| US20100063981A1 (en) | 2000-05-09 | 2010-03-11 | Thomsen David J | System and method for retrieving and displaying data, such as economic data relating to salaries, cost of living and employee benefits |
| US7716174B2 (en) | 2005-01-18 | 2010-05-11 | International Business Machines Corporation | System and method for planning and generating queries for multi-dimensional analysis using domain models and data federation |
| US20110035744A1 (en) * | 2006-12-29 | 2011-02-10 | Sanjay Bhatia | Self-service database reporting systems and methods |
| US7953762B2 (en) | 2008-04-09 | 2011-05-31 | American Express Travel Related Services Company, Inc. | Infrastructure and architecture for development and execution of predictive models |
| US20110191361A1 (en) | 2010-01-30 | 2011-08-04 | International Business Machines Corporation | System and method for building a cloud aware massive data analytics solution background |
| US8006197B1 (en) | 2003-09-29 | 2011-08-23 | Google Inc. | Method and apparatus for output of search results |
| US20110246439A1 (en) * | 2010-04-06 | 2011-10-06 | Microsoft Corporation | Augmented query search |
| US20110270829A1 (en) | 2005-12-20 | 2011-11-03 | Araicom Research Llc | System, method and computer program product for information sorting and retrieval using a language-modeling kernal function |
| US20120047164A1 (en) * | 2010-08-23 | 2012-02-23 | Nokia Corporation | Method and apparatus for processing search request for a partitioned index |
| US20120226676A1 (en) | 2010-06-11 | 2012-09-06 | Doat Media Ltd. | System and methods thereof for adaptation of a free text query to a customized query set |
| US20120254143A1 (en) | 2011-03-31 | 2012-10-04 | Infosys Technologies Ltd. | Natural language querying with cascaded conditional random fields |
| US20130013329A1 (en) * | 2011-05-10 | 2013-01-10 | Ims Health Incorporated | Analytic services portal |
| US8370352B2 (en) | 2007-10-18 | 2013-02-05 | Siemens Medical Solutions Usa, Inc. | Contextual searching of electronic records and visual rule construction |
| US8370375B2 (en) | 2005-12-08 | 2013-02-05 | International Business Machines Corporation | Method for presenting database query result sets using polymorphic output formats |
| US8386456B1 (en) | 2000-02-24 | 2013-02-26 | Richard Paiz | Codex search patterns |
| US8396859B2 (en) | 2000-06-26 | 2013-03-12 | Oracle International Corporation | Subject matter context search engine |
| US20130103677A1 (en) | 2011-10-25 | 2013-04-25 | International Business Machines Corporation | Contextual data visualization |
| US8606739B2 (en) | 2010-06-30 | 2013-12-10 | Microsoft Corporation | Using computational engines to improve search relevance |
| US20140095505A1 (en) * | 2012-10-01 | 2014-04-03 | Longsand Limited | Performance and scalability in an intelligent data operating layer system |
| US20140122455A1 (en) | 2012-10-26 | 2014-05-01 | Equifax, Inc. | Systems and Methods for Intelligent Parallel Searching |
Family Cites Families (5)
| Publication number | Priority date | Publication date | Assignee | Title |
|---|---|---|---|---|
| US7523462B1 (en) * | 2003-05-27 | 2009-04-21 | International Business Machines Corporation | Method for providing a real time view of heterogeneous enterprise data |
| US7395256B2 (en) * | 2003-06-20 | 2008-07-01 | Agency For Science, Technology And Research | Method and platform for term extraction from large collection of documents |
| US20080250450A1 (en) * | 2007-04-06 | 2008-10-09 | Adisn, Inc. | Systems and methods for targeted advertising |
| US8832091B1 (en) * | 2012-10-08 | 2014-09-09 | Amazon Technologies, Inc. | Graph-based semantic analysis of items |
| US11336596B2 (en) * | 2013-06-11 | 2022-05-17 | International Business Machines Corporation | Personalized low latency communication |
-
2014
- 2014-06-13 US US14/304,487 patent/US9665662B1/en active Active
- 2014-06-13 US US14/304,490 patent/US9501585B1/en active Active
-
2017
- 2017-05-05 US US15/587,751 patent/US10657125B1/en active Active
Patent Citations (30)
| Publication number | Priority date | Publication date | Assignee | Title |
|---|---|---|---|---|
| US6101491A (en) * | 1995-07-07 | 2000-08-08 | Sun Microsystems, Inc. | Method and apparatus for distributed indexing and retrieval |
| US5809499A (en) | 1995-10-20 | 1998-09-15 | Pattern Discovery Software Systems, Ltd. | Computational method for discovering patterns in data sets |
| US8386456B1 (en) | 2000-02-24 | 2013-02-26 | Richard Paiz | Codex search patterns |
| US20100063981A1 (en) | 2000-05-09 | 2010-03-11 | Thomsen David J | System and method for retrieving and displaying data, such as economic data relating to salaries, cost of living and employee benefits |
| US20020049747A1 (en) * | 2000-06-06 | 2002-04-25 | Shigekazu Inohara | Method for integrating and accessing of heterogeneous data sources |
| US8396859B2 (en) | 2000-06-26 | 2013-03-12 | Oracle International Corporation | Subject matter context search engine |
| US7606805B2 (en) | 2000-07-28 | 2009-10-20 | EasyAsk Acquisition, LLC | Distributed search system and method |
| US20040088158A1 (en) * | 2002-10-31 | 2004-05-06 | Phillip Sheu | Structured natural language query and knowledge system |
| US8006197B1 (en) | 2003-09-29 | 2011-08-23 | Google Inc. | Method and apparatus for output of search results |
| US20050149496A1 (en) | 2003-12-22 | 2005-07-07 | Verity, Inc. | System and method for dynamic context-sensitive federated search of multiple information repositories |
| US7716174B2 (en) | 2005-01-18 | 2010-05-11 | International Business Machines Corporation | System and method for planning and generating queries for multi-dimensional analysis using domain models and data federation |
| US8370375B2 (en) | 2005-12-08 | 2013-02-05 | International Business Machines Corporation | Method for presenting database query result sets using polymorphic output formats |
| US20110270829A1 (en) | 2005-12-20 | 2011-11-03 | Araicom Research Llc | System, method and computer program product for information sorting and retrieval using a language-modeling kernal function |
| US7606835B2 (en) | 2006-02-14 | 2009-10-20 | Oracle International Corporation | Automatic rules driven data visualization selection |
| US7548909B2 (en) | 2006-06-13 | 2009-06-16 | Microsoft Corporation | Search engine dash-board |
| US20080071772A1 (en) | 2006-09-14 | 2008-03-20 | Thomson Global Resources | Information-retrieval systems, methods, and software with content relevancy enhancements |
| US20110035744A1 (en) * | 2006-12-29 | 2011-02-10 | Sanjay Bhatia | Self-service database reporting systems and methods |
| US20080235199A1 (en) | 2007-03-19 | 2008-09-25 | Yunyao Li | Natural language query interface, systems, and methods for a database |
| US8370352B2 (en) | 2007-10-18 | 2013-02-05 | Siemens Medical Solutions Usa, Inc. | Contextual searching of electronic records and visual rule construction |
| US7953762B2 (en) | 2008-04-09 | 2011-05-31 | American Express Travel Related Services Company, Inc. | Infrastructure and architecture for development and execution of predictive models |
| US20110191361A1 (en) | 2010-01-30 | 2011-08-04 | International Business Machines Corporation | System and method for building a cloud aware massive data analytics solution background |
| US20110246439A1 (en) * | 2010-04-06 | 2011-10-06 | Microsoft Corporation | Augmented query search |
| US20120226676A1 (en) | 2010-06-11 | 2012-09-06 | Doat Media Ltd. | System and methods thereof for adaptation of a free text query to a customized query set |
| US8606739B2 (en) | 2010-06-30 | 2013-12-10 | Microsoft Corporation | Using computational engines to improve search relevance |
| US20120047164A1 (en) * | 2010-08-23 | 2012-02-23 | Nokia Corporation | Method and apparatus for processing search request for a partitioned index |
| US20120254143A1 (en) | 2011-03-31 | 2012-10-04 | Infosys Technologies Ltd. | Natural language querying with cascaded conditional random fields |
| US20130013329A1 (en) * | 2011-05-10 | 2013-01-10 | Ims Health Incorporated | Analytic services portal |
| US20130103677A1 (en) | 2011-10-25 | 2013-04-25 | International Business Machines Corporation | Contextual data visualization |
| US20140095505A1 (en) * | 2012-10-01 | 2014-04-03 | Longsand Limited | Performance and scalability in an intelligent data operating layer system |
| US20140122455A1 (en) | 2012-10-26 | 2014-05-01 | Equifax, Inc. | Systems and Methods for Intelligent Parallel Searching |
Non-Patent Citations (7)
| Title |
|---|
| Office Action for U.S Appl. No. 14/304,487 dated Apr. 14, 2016. |
| Office Action for U.S Appl. No. 14/304,487 dated Aug. 22, 2014. |
| Office Action for U.S Appl. No. 14/304,487 dated May 14, 2015. |
| Sun et al. "Articulate: A Semi-automated Model for Translating Natural Language Queries into Meaningful Visualizations" [online], Tretrieved from the internet: , 2010. |
| Sun et al. "Articulate: A Semi-automated Model for Translating Natural Language Queries into Meaningful Visualizations" [online], Tretrieved from the internet: <URL: http://link.springer.com/chater/10.1007%2F978-3-642-13544-6-18#page-1>, 2010. |
| Wiza et al. "Periscope -A System for Adaptive 3D Visualization of Search Results" [online], Retrieved from the internet: , 2004. |
| Wiza et al. "Periscope -A System for Adaptive 3D Visualization of Search Results" [online], Retrieved from the internet: <URL: http://dl.acm.org/citation.cfm?id+9855045>, 2004. |
Cited By (104)
| Publication number | Priority date | Publication date | Assignee | Title |
|---|---|---|---|---|
| US10664488B2 (en) * | 2014-09-25 | 2020-05-26 | Oracle International Corporation | Semantic searches in a business intelligence system |
| US11334583B2 (en) | 2014-09-25 | 2022-05-17 | Oracle International Corporation | Techniques for semantic searching |
| US20160092572A1 (en) * | 2014-09-25 | 2016-03-31 | Oracle International Corporation | Semantic searches in a business intelligence system |
| US10417247B2 (en) | 2014-09-25 | 2019-09-17 | Oracle International Corporation | Techniques for semantic searching |
| US20160098479A1 (en) * | 2014-10-02 | 2016-04-07 | Shahbaz Anwar | System and process for natural language processing and reporting |
| US9619555B2 (en) * | 2014-10-02 | 2017-04-11 | Shahbaz Anwar | System and process for natural language processing and reporting |
| US20160253380A1 (en) * | 2015-02-26 | 2016-09-01 | Red Hat, Inc. | Database query optimization |
| US10516980B2 (en) | 2015-10-24 | 2019-12-24 | Oracle International Corporation | Automatic redisplay of a user interface including a visualization |
| US11956701B2 (en) * | 2015-10-24 | 2024-04-09 | Oracle International Corporation | Content display and interaction according to estimates of content usefulness |
| US20170177660A1 (en) * | 2015-12-16 | 2017-06-22 | Adobe Systems Incorporated | Natural language embellishment generation and summarization for question-answering systems |
| US10909111B2 (en) * | 2015-12-16 | 2021-02-02 | Adobe Inc. | Natural language embellishment generation and summarization for question-answering systems |
| US20180046720A1 (en) * | 2016-02-14 | 2018-02-15 | Ousmane Conde | XoomDat, real-time search and analytics information system |
| US10346139B2 (en) * | 2016-02-23 | 2019-07-09 | Bank Of America Corporation | Rules engine having an interactive, dual, side-by-side display |
| US11010396B1 (en) * | 2016-04-12 | 2021-05-18 | Tableau Software, Inc. | Data visualization user interface using cohesion of sequential natural language commands |
| US11030207B1 (en) * | 2016-04-12 | 2021-06-08 | Tableau Software, Inc. | Updating displayed data visualizations according to identified conversation centers in natural language commands |
| US11244006B1 (en) | 2016-04-12 | 2022-02-08 | Tableau Software, Inc. | Using natural language processing for visual analysis of a data set |
| US20210303558A1 (en) * | 2016-04-12 | 2021-09-30 | Tableau Software, Inc. | Applying Natural Language Pragmatics in a Data Visualization User Interface |
| US11874877B2 (en) | 2016-04-12 | 2024-01-16 | Tableau Software, Inc. | Using natural language processing for visual analysis of a data set |
| US11934461B2 (en) * | 2016-04-12 | 2024-03-19 | Tableau Software, Inc. | Applying natural language pragmatics in a data visualization user interface |
| US10817527B1 (en) * | 2016-04-12 | 2020-10-27 | Tableau Software, Inc. | Systems and methods of using natural language processing for visual analysis of a data set |
| US10795902B1 (en) * | 2016-04-12 | 2020-10-06 | Tableau Software, Inc. | Applying natural language pragmatics in a data visualization user interface |
| US11792177B2 (en) | 2016-06-22 | 2023-10-17 | Certinia Inc. | Seamless authentication for an application development platform |
| US11651312B2 (en) | 2016-06-23 | 2023-05-16 | FinancialForce.com, Inc. | Combining batch and queueable technologies in a platform for large volume parallel processing |
| US10621172B2 (en) * | 2016-07-10 | 2020-04-14 | Sisense Ltd. | System and method for efficiently generating responses to queries |
| US11886806B2 (en) | 2016-09-21 | 2024-01-30 | Certinia Inc. | Templating process for a multi-page formatted document |
| US11334565B1 (en) * | 2016-10-28 | 2022-05-17 | Intuit, Inc. | System to convert natural-language financial questions into database queries |
| US11809419B2 (en) | 2016-10-28 | 2023-11-07 | Intuit, Inc. | System to convert natural-language financial questions into database queries |
| US20200356225A1 (en) * | 2016-11-07 | 2020-11-12 | Tableau Software, Inc. | Data Preparation User Interface with Conglomerate Heterogeneous Process Flow Elements |
| US10558686B2 (en) * | 2016-12-05 | 2020-02-11 | Sap Se | Business intelligence system dataset navigation based on user interests clustering |
| CN106713455A (en) * | 2016-12-22 | 2017-05-24 | 北京锐安科技有限公司 | System, method and device for processing client requests |
| US10055421B1 (en) * | 2017-04-14 | 2018-08-21 | Xactly Corporation | Pre-execution query optimization |
| CN107122491B (en) * | 2017-05-19 | 2020-12-15 | 深圳市优必选科技有限公司 | Method for data interaction |
| CN107122491A (en) * | 2017-05-19 | 2017-09-01 | 深圳市优必选科技有限公司 | Method for data interaction |
| US10917587B2 (en) | 2017-06-02 | 2021-02-09 | Oracle International Corporation | Importing and presenting data |
| US10956237B2 (en) | 2017-06-02 | 2021-03-23 | Oracle International Corporation | Inter-application sharing of business intelligence data |
| US11614857B2 (en) | 2017-06-02 | 2023-03-28 | Oracle International Corporation | Importing, interpreting, and presenting data |
| US20180349473A1 (en) * | 2017-06-06 | 2018-12-06 | Mastercard International Incorporated | Method and system for conversational input device with intelligent crowd-sourced options |
| CN109002465B (en) * | 2017-06-06 | 2022-03-22 | 万事达卡国际公司 | Method and system for dialog input device with intelligent crowd-sourced options |
| CN109002465A (en) * | 2017-06-06 | 2018-12-14 | 万事达卡国际公司 | For having the method and system of the dialogue input equipment of intelligent crowdsourcing option |
| US11537644B2 (en) * | 2017-06-06 | 2022-12-27 | Mastercard International Incorporated | Method and system for conversational input device with intelligent crowd-sourced options |
| CN107203506A (en) * | 2017-06-06 | 2017-09-26 | 山东浪潮通软信息科技有限公司 | A kind of report form generation method and device |
| US11048396B2 (en) * | 2017-10-02 | 2021-06-29 | Fisher-Rosemount Systems, Inc. | Systems and methods for configuring and presenting a display navigation hierarchy in a process plant |
| US10546003B2 (en) * | 2017-11-09 | 2020-01-28 | Adobe Inc. | Intelligent analytics interface |
| US20190138648A1 (en) * | 2017-11-09 | 2019-05-09 | Adobe Inc. | Intelligent analytics interface |
| US11321373B2 (en) | 2017-11-09 | 2022-05-03 | Adobe Inc. | Natural-language based intelligent analytics interface |
| US11790182B2 (en) | 2017-12-13 | 2023-10-17 | Tableau Software, Inc. | Identifying intent in visual analytical conversations |
| WO2019144192A1 (en) * | 2018-01-24 | 2019-08-01 | Eqstats Pty Ltd | System and method for the automated interpretation of operational data |
| US11870909B2 (en) | 2018-03-01 | 2024-01-09 | Certinia Inc. | Efficient block chain generation |
| CN110399438A (en) * | 2018-04-24 | 2019-11-01 | 北京视联动力国际信息技术有限公司 | A kind of GIS point information query method and device |
| US11373046B2 (en) | 2018-06-29 | 2022-06-28 | FinancialForce.com, Inc. | Method and system for bridging disparate platforms to automate a natural language interface |
| US11741311B2 (en) | 2018-06-29 | 2023-08-29 | Certinia Inc. | Method and system for bridging disparate platforms to automate a natural language interface |
| US10846481B2 (en) * | 2018-06-29 | 2020-11-24 | FinancialForce.com, Inc. | Method and system for bridging disparate platforms to automate a natural language interface |
| CN109086396A (en) * | 2018-07-28 | 2018-12-25 | 重庆柚瓣家科技有限公司 | Endowment big data analysis platform |
| CN109086396B (en) * | 2018-07-28 | 2022-04-22 | 重庆柚瓣家科技有限公司 | Old people-care big data analysis platform |
| US11048871B2 (en) * | 2018-09-18 | 2021-06-29 | Tableau Software, Inc. | Analyzing natural language expressions in a data visualization user interface |
| US11244114B2 (en) * | 2018-10-08 | 2022-02-08 | Tableau Software, Inc. | Analyzing underspecified natural language utterances in a data visualization user interface |
| US20210319186A1 (en) * | 2018-10-08 | 2021-10-14 | Tableau Software, Inc. | Using natural language constructs for data visualizations |
| US11694036B2 (en) * | 2018-10-08 | 2023-07-04 | Tableau Software, Inc. | Using natural language constructs for data visualizations |
| US20220164540A1 (en) * | 2018-10-08 | 2022-05-26 | Tableau Software, Inc. | Analyzing Underspecified Natural Language Utterances in a Data Visualization User Interface |
| US11055489B2 (en) * | 2018-10-08 | 2021-07-06 | Tableau Software, Inc. | Determining levels of detail for data visualizations using natural language constructs |
| US11921979B2 (en) | 2018-10-22 | 2024-03-05 | Tableau Software, Inc. | Data preparation user interface with configurable process flow elements |
| US11429264B1 (en) | 2018-10-22 | 2022-08-30 | Tableau Software, Inc. | Systems and methods for visually building an object model of database tables |
| US20220261412A1 (en) * | 2018-12-14 | 2022-08-18 | Sisense Ltd. | System and method for partitioning data based on authorization rules |
| US11868231B2 (en) | 2019-01-08 | 2024-01-09 | Certinia Inc. | System and method for evaluating code by a hybrid of local and cloud-based computers |
| EP3942425A4 (en) * | 2019-03-20 | 2023-03-01 | Promethium, Inc. | Natural language based processing of data stored across heterogeneous data sources |
| US11709827B2 (en) | 2019-03-20 | 2023-07-25 | Promethium, Inc. | Using stored execution plans for efficient execution of natural language questions |
| US11609903B2 (en) | 2019-03-20 | 2023-03-21 | Promethium, Inc. | Ranking data assets for processing natural language questions based on data stored across heterogeneous data sources |
| WO2020191353A1 (en) | 2019-03-20 | 2020-09-24 | Promethium, Inc. | Natural language based processing of data stored across heterogeneous data sources |
| US11790010B2 (en) | 2019-04-01 | 2023-10-17 | Tableau Software, LLC | Inferring intent and utilizing context for natural language expressions in a data visualization user interface |
| US11030255B1 (en) | 2019-04-01 | 2021-06-08 | Tableau Software, LLC | Methods and systems for inferring intent and utilizing context for natural language expressions to generate data visualizations in a data visualization interface |
| US11314817B1 (en) | 2019-04-01 | 2022-04-26 | Tableau Software, LLC | Methods and systems for inferring intent and utilizing context for natural language expressions to modify data visualizations in a data visualization interface |
| US11734358B2 (en) | 2019-04-01 | 2023-08-22 | Tableau Software, LLC | Inferring intent and utilizing context for natural language expressions in a data visualization user interface |
| US11232088B2 (en) * | 2019-04-12 | 2022-01-25 | Adp, Llc | Method and system for interactive search indexing |
| US11640500B2 (en) | 2019-07-10 | 2023-05-02 | FinancialForce.com, Inc. | Platform interpretation of user input converted into standardized input |
| CN110489476A (en) * | 2019-08-22 | 2019-11-22 | 金瓜子科技发展(北京)有限公司 | Data processing method, system and server |
| US11734359B2 (en) | 2019-09-06 | 2023-08-22 | Tableau Software, Inc. | Handling vague modifiers in natural language commands |
| US11550853B2 (en) | 2019-09-06 | 2023-01-10 | Tableau Software, Inc. | Using natural language expressions to define data visualization calculations that span across multiple rows of data from a database |
| US11455339B1 (en) | 2019-09-06 | 2022-09-27 | Tableau Software, LLC | Incremental updates to natural language expressions in a data visualization user interface |
| US11416559B2 (en) | 2019-09-06 | 2022-08-16 | Tableau Software, Inc. | Determining ranges for vague modifiers in natural language commands |
| US11042558B1 (en) * | 2019-09-06 | 2021-06-22 | Tableau Software, Inc. | Determining ranges for vague modifiers in natural language commands |
| US11797614B2 (en) | 2019-09-06 | 2023-10-24 | Tableau Software, LLC | Incremental updates to natural language expressions in a data visualization user interface |
| CN110737850A (en) * | 2019-09-10 | 2020-01-31 | 苏宁云计算有限公司 | chart generation method and device |
| US10997217B1 (en) | 2019-11-10 | 2021-05-04 | Tableau Software, Inc. | Systems and methods for visualizing object models of database tables |
| US11429271B2 (en) | 2019-11-11 | 2022-08-30 | Tableau Software, LLC | Methods and user interfaces for generating level of detail calculations for data visualizations |
| US11625163B2 (en) | 2019-11-11 | 2023-04-11 | Tableau Software, LLC | Methods and user interfaces for generating level of detail calculations for data visualizations |
| US20210191923A1 (en) * | 2019-12-24 | 2021-06-24 | Sap Se | Platform for conversation-based insight search in analytics systems |
| US11714807B2 (en) * | 2019-12-24 | 2023-08-01 | Sap Se | Platform for conversation-based insight search in analytics systems |
| US11782997B2 (en) * | 2020-02-13 | 2023-10-10 | Verity Platforms Inc. | Information platform systems and methods |
| CN112052256A (en) * | 2020-09-02 | 2020-12-08 | 平安资产管理有限责任公司 | Multi-version request returning method and device, computer equipment and readable storage medium |
| US11698933B1 (en) | 2020-09-18 | 2023-07-11 | Tableau Software, LLC | Using dynamic entity search during entry of natural language commands for visual data analysis |
| US11301631B1 (en) | 2020-10-05 | 2022-04-12 | Tableau Software, LLC | Visually correlating individual terms in natural language input to respective structured phrases representing the natural language input |
| US11842154B2 (en) | 2020-10-05 | 2023-12-12 | Tableau Software, LLC | Visually correlating individual terms in natural language input to respective structured phrases representing the natural language input |
| US20220129450A1 (en) * | 2020-10-23 | 2022-04-28 | Royal Bank Of Canada | System and method for transferable natural language interface |
| CN112347200A (en) * | 2020-11-24 | 2021-02-09 | 武汉烽火众智数字技术有限责任公司 | Vehicle simultaneous analysis method based on big data |
| CN112926006A (en) * | 2020-12-23 | 2021-06-08 | 江苏园上园智能科技有限公司 | Application system based on AIE engine platform and implementation method |
| CN113094034A (en) * | 2021-04-02 | 2021-07-09 | 上海中通吉网络技术有限公司 | Enterprise BI platform based on rule engine and construction method and equipment thereof |
| CN113448931A (en) * | 2021-07-01 | 2021-09-28 | 京东科技控股股份有限公司 | Data processing method, service transaction platform and service providing platform |
| CN113468246A (en) * | 2021-07-20 | 2021-10-01 | 上海齐屹信息科技有限公司 | Intelligent data counting and subscribing system and method based on OLTP |
| US20230023134A1 (en) * | 2021-07-26 | 2023-01-26 | Microstrategy Incorporated | Lookup and relationship caches for dynamic fetching |
| CN113721976B (en) * | 2021-07-31 | 2024-02-06 | 远光软件股份有限公司 | Data migration method and device based on BI analysis software, storage medium and electronic equipment |
| CN113721976A (en) * | 2021-07-31 | 2021-11-30 | 远光软件股份有限公司 | BI analysis software-based data migration method and device, storage medium and electronic equipment |
| CN113392228B (en) * | 2021-08-03 | 2023-07-21 | 广域铭岛数字科技有限公司 | Anomaly prediction and tracing method, system, equipment and medium based on automobile production |
| CN113392228A (en) * | 2021-08-03 | 2021-09-14 | 广域铭岛数字科技有限公司 | Abnormity prediction and tracing method, system, equipment and medium based on automobile production |
| US11704319B1 (en) | 2021-10-14 | 2023-07-18 | Tableau Software, LLC | Table calculations for visual analytics using concise level of detail semantics |
Also Published As
| Publication number | Publication date |
|---|---|
| US9665662B1 (en) | 2017-05-30 |
| US10657125B1 (en) | 2020-05-19 |
Similar Documents
| Publication | Publication Date | Title |
|---|---|---|
| US9501585B1 (en) | Methods and system for providing real-time business intelligence using search-based analytics engine | |
| US11797532B1 (en) | Dashboard display using panel templates | |
| US11928596B2 (en) | Platform management of integrated access of public and privately-accessible datasets utilizing federated query generation and query schema rewriting optimization | |
| US20180039399A1 (en) | Interactive user interface for dynamically updating data and data analysis and query processing | |
| US8965915B2 (en) | Assisted query formation, validation, and result previewing in a database having a complex schema | |
| US9626453B2 (en) | Analytic solution with a self-learning and context-sensitive semantic layer | |
| US11138241B2 (en) | Metric definition and visualization | |
| US9275121B2 (en) | Interoperable shared query based on heterogeneous data sources | |
| US20230177078A1 (en) | Conversational Database Analysis | |
| WO2016018942A1 (en) | Systems and methods for an sql-driven distributed operating system | |
| US20180165336A1 (en) | Expert System And Data Analysis Tool Utilizing Data As A Concept | |
| US20200364221A1 (en) | Systems and methods for dynamic computer aided innovation via multidimensional complementary difference recommendation and exploration | |
| US20160342604A1 (en) | Apparatus and Method for Collaboratively Analyzing Data Snapshot Visualizations from Disparate Data Sources Using State Based Visual Data Link Recommendations | |
| US20110202534A1 (en) | Storage Model for Information Related to Decision Making Process | |
| US10452679B2 (en) | Systems and methods for context-sensitive data annotation and annotation visualization | |
| US20140047377A1 (en) | Retrieving data from an external data source | |
| US11354515B2 (en) | Discovery and recommendation of online learning resources | |
| US20230252022A1 (en) | Secure And Efficient Database Command Execution Support | |
| US20140359742A1 (en) | Apparatus and Method for Agent Based Ingestion of Data | |
| US20230185818A1 (en) | Systems and methods for generation and display of query visualizations | |
| US11379495B2 (en) | Search guidance | |
| Singh et al. | Manage data with pyspark | |
| US11200236B2 (en) | Server-side cross-model filtering | |
| US20220124072A1 (en) | Methods And Systems For Improved Analytics | |
| US20240126776A1 (en) | System and method for finding segments in a dataset within a data analytics environment |
Legal Events
| Date | Code | Title | Description |
|---|---|---|---|
| AS | Assignment |
Owner name: DATARPM CORPORATION, VIRGINIA Free format text: ASSIGNMENT OF ASSIGNORS INTEREST;ASSIGNORS:PHUKAN, RUBAN;GAUTAM, SHYAMANTAK;SANGHAVI, SUNDEEP;AND OTHERS;SIGNING DATES FROM 20040715 TO 20140925;REEL/FRAME:033854/0955 |
|
| STCF | Information on status: patent grant |
Free format text: PATENTED CASE |
|
| AS | Assignment |
Owner name: JPMORGAN CHASE BANK, N.A., AS ADMINISTRATIVE AGENT, NEW YORK Free format text: SECURITY INTEREST;ASSIGNOR:PROGRESS SOFTWARE CORPORATION;REEL/FRAME:044889/0325 Effective date: 20171130 Owner name: JPMORGAN CHASE BANK, N.A., AS ADMINISTRATIVE AGENT Free format text: SECURITY INTEREST;ASSIGNOR:PROGRESS SOFTWARE CORPORATION;REEL/FRAME:044889/0325 Effective date: 20171130 |
|
| AS | Assignment |
Owner name: PROGRESS SOFTWARE CORPORATION, MASSACHUSETTS Free format text: ASSIGNMENT OF ASSIGNORS INTEREST;ASSIGNOR:DATARPM CORPORATION;REEL/FRAME:045124/0837 Effective date: 20180226 |
|
| AS | Assignment |
Owner name: JPMORGAN CHASE BANK, N.A., ADMINISTRATIVE AGENT, N Free format text: SECURITY INTEREST;ASSIGNOR:PROGRESS SOFTWARE CORPORATION;REEL/FRAME:049031/0684 Effective date: 20190430 Owner name: JPMORGAN CHASE BANK, N.A., ADMINISTRATIVE AGENT, NEW YORK Free format text: SECURITY INTEREST;ASSIGNOR:PROGRESS SOFTWARE CORPORATION;REEL/FRAME:049031/0684 Effective date: 20190430 |
|
| FEPP | Fee payment procedure |
Free format text: ENTITY STATUS SET TO UNDISCOUNTED (ORIGINAL EVENT CODE: BIG.); ENTITY STATUS OF PATENT OWNER: LARGE ENTITY |
|
| MAFP | Maintenance fee payment |
Free format text: PAYMENT OF MAINTENANCE FEE, 4TH YEAR, LARGE ENTITY (ORIGINAL EVENT CODE: M1551); ENTITY STATUS OF PATENT OWNER: LARGE ENTITY Year of fee payment: 4 |
|
| AS | Assignment |
Owner name: JPMORGAN CHASE BANK, N.A., AS ADMINISTRATIVE AGENT, ILLINOIS Free format text: SECURITY INTEREST;ASSIGNOR:PROGRESS SOFTWARE CORPORATION;REEL/FRAME:058840/0099 Effective date: 20220125 |
|
| AS | Assignment |
Owner name: JPMORGAN CHASE BANK, N.A., AS ADMINISTRATIVE AGENT, ILLINOIS Free format text: SECURITY INTEREST;ASSIGNOR:PROGRESS SOFTWARE CORPORATION;REEL/FRAME:066762/0833 Effective date: 20240307 |