WO2003034074A1 - Sensitivity controls for blood serology prepared from modified cells - Google Patents
Sensitivity controls for blood serology prepared from modified cells Download PDFInfo
- Publication number
- WO2003034074A1 WO2003034074A1 PCT/NZ2002/000214 NZ0200214W WO03034074A1 WO 2003034074 A1 WO2003034074 A1 WO 2003034074A1 NZ 0200214 W NZ0200214 W NZ 0200214W WO 03034074 A1 WO03034074 A1 WO 03034074A1
- Authority
- WO
- WIPO (PCT)
- Prior art keywords
- cells
- antigen
- transformed
- glycolipid
- solution
- Prior art date
Links
- 210000004369 blood Anatomy 0.000 title claims abstract description 71
- 239000008280 blood Substances 0.000 title claims abstract description 71
- 230000035945 sensitivity Effects 0.000 title claims abstract description 37
- 210000004027 cell Anatomy 0.000 claims abstract description 172
- 239000000427 antigen Substances 0.000 claims abstract description 90
- 102000036639 antigens Human genes 0.000 claims abstract description 90
- 108091007433 antigens Proteins 0.000 claims abstract description 90
- 238000003780 insertion Methods 0.000 claims abstract description 43
- 230000037431 insertion Effects 0.000 claims abstract description 43
- 210000000170 cell membrane Anatomy 0.000 claims abstract description 11
- 239000012528 membrane Substances 0.000 claims abstract description 11
- XLYOFNOQVPJJNP-UHFFFAOYSA-N water Substances O XLYOFNOQVPJJNP-UHFFFAOYSA-N 0.000 claims abstract description 8
- 238000005406 washing Methods 0.000 claims abstract description 7
- 238000004519 manufacturing process Methods 0.000 claims abstract description 4
- 229930186217 Glycolipid Natural products 0.000 claims description 104
- 210000003743 erythrocyte Anatomy 0.000 claims description 94
- HVCOBJNICQPDBP-UHFFFAOYSA-N 3-[3-[3,5-dihydroxy-6-methyl-4-(3,4,5-trihydroxy-6-methyloxan-2-yl)oxyoxan-2-yl]oxydecanoyloxy]decanoic acid;hydrate Chemical compound O.OC1C(OC(CC(=O)OC(CCCCCCC)CC(O)=O)CCCCCCC)OC(C)C(O)C1OC1C(O)C(O)C(O)C(C)O1 HVCOBJNICQPDBP-UHFFFAOYSA-N 0.000 claims description 77
- 239000003153 chemical reaction reagent Substances 0.000 claims description 69
- 238000000034 method Methods 0.000 claims description 48
- 239000000243 solution Substances 0.000 claims description 45
- 238000012360 testing method Methods 0.000 claims description 45
- 230000004520 agglutination Effects 0.000 claims description 38
- 230000008569 process Effects 0.000 claims description 25
- 150000001720 carbohydrates Chemical class 0.000 claims description 13
- 230000009257 reactivity Effects 0.000 claims description 12
- 150000002632 lipids Chemical class 0.000 claims description 10
- 210000004102 animal cell Anatomy 0.000 claims description 8
- 239000007864 aqueous solution Substances 0.000 claims description 8
- 102000004190 Enzymes Human genes 0.000 claims description 6
- 108090000790 Enzymes Proteins 0.000 claims description 6
- 150000003839 salts Chemical class 0.000 claims description 5
- 150000002339 glycosphingolipids Chemical class 0.000 claims description 4
- 239000000592 Artificial Cell Substances 0.000 claims description 3
- 230000001580 bacterial effect Effects 0.000 claims description 3
- 230000002285 radioactive effect Effects 0.000 claims description 2
- 210000005260 human cell Anatomy 0.000 claims 2
- 230000009466 transformation Effects 0.000 description 24
- 238000000684 flow cytometry Methods 0.000 description 21
- 241000700159 Rattus Species 0.000 description 20
- LOKCTEFSRHRXRJ-UHFFFAOYSA-I dipotassium trisodium dihydrogen phosphate hydrogen phosphate dichloride Chemical compound P(=O)(O)(O)[O-].[K+].P(=O)(O)([O-])[O-].[Na+].[Na+].[Cl-].[K+].[Cl-].[Na+] LOKCTEFSRHRXRJ-UHFFFAOYSA-I 0.000 description 17
- 239000002953 phosphate buffered saline Substances 0.000 description 16
- 238000011534 incubation Methods 0.000 description 13
- OKKJLVBELUTLKV-UHFFFAOYSA-N Methanol Chemical compound OC OKKJLVBELUTLKV-UHFFFAOYSA-N 0.000 description 12
- 238000001727 in vivo Methods 0.000 description 10
- 239000013642 negative control Substances 0.000 description 10
- 238000002474 experimental method Methods 0.000 description 9
- 238000000338 in vitro Methods 0.000 description 9
- 230000001131 transforming effect Effects 0.000 description 9
- 229960000074 biopharmaceutical Drugs 0.000 description 8
- 238000010790 dilution Methods 0.000 description 8
- 239000012895 dilution Substances 0.000 description 8
- 150000002270 gangliosides Chemical class 0.000 description 8
- 108090001008 Avidin Proteins 0.000 description 7
- 239000000872 buffer Substances 0.000 description 7
- 230000000052 comparative effect Effects 0.000 description 7
- 238000001514 detection method Methods 0.000 description 7
- 238000006243 chemical reaction Methods 0.000 description 6
- 239000000203 mixture Substances 0.000 description 6
- 230000000405 serological effect Effects 0.000 description 6
- 206010018910 Haemolysis Diseases 0.000 description 5
- 241000283973 Oryctolagus cuniculus Species 0.000 description 5
- FAPWRFPIFSIZLT-UHFFFAOYSA-M Sodium chloride Chemical compound [Na+].[Cl-] FAPWRFPIFSIZLT-UHFFFAOYSA-M 0.000 description 5
- 238000004458 analytical method Methods 0.000 description 5
- 230000021615 conjugation Effects 0.000 description 5
- 230000003247 decreasing effect Effects 0.000 description 5
- 230000008588 hemolysis Effects 0.000 description 5
- 230000007935 neutral effect Effects 0.000 description 5
- 210000004976 peripheral blood cell Anatomy 0.000 description 5
- 239000013641 positive control Substances 0.000 description 5
- 238000003860 storage Methods 0.000 description 5
- 230000003442 weekly effect Effects 0.000 description 5
- IJGRMHOSHXDMSA-UHFFFAOYSA-N Atomic nitrogen Chemical compound N#N IJGRMHOSHXDMSA-UHFFFAOYSA-N 0.000 description 4
- 101000874347 Streptococcus agalactiae IgA FC receptor Proteins 0.000 description 4
- 238000009582 blood typing Methods 0.000 description 4
- 230000006866 deterioration Effects 0.000 description 4
- 229910001873 dinitrogen Inorganic materials 0.000 description 4
- 239000011521 glass Substances 0.000 description 4
- 238000002156 mixing Methods 0.000 description 4
- 239000003755 preservative agent Substances 0.000 description 4
- 230000002335 preservative effect Effects 0.000 description 4
- 238000003908 quality control method Methods 0.000 description 4
- 239000000725 suspension Substances 0.000 description 4
- PEDCQBHIVMGVHV-UHFFFAOYSA-N Glycerine Chemical compound OCC(O)CO PEDCQBHIVMGVHV-UHFFFAOYSA-N 0.000 description 3
- 241001465754 Metazoa Species 0.000 description 3
- 229910019142 PO4 Inorganic materials 0.000 description 3
- 238000003556 assay Methods 0.000 description 3
- 229960002685 biotin Drugs 0.000 description 3
- 239000011616 biotin Substances 0.000 description 3
- 239000008367 deionised water Substances 0.000 description 3
- NBIIXXVUZAFLBC-UHFFFAOYSA-K phosphate Chemical compound [O-]P([O-])([O-])=O NBIIXXVUZAFLBC-UHFFFAOYSA-K 0.000 description 3
- 239000010452 phosphate Substances 0.000 description 3
- 238000002360 preparation method Methods 0.000 description 3
- 210000002966 serum Anatomy 0.000 description 3
- 239000011780 sodium chloride Substances 0.000 description 3
- 239000011550 stock solution Substances 0.000 description 3
- YBJHBAHKTGYVGT-ZKWXMUAHSA-N (+)-Biotin Chemical compound N1C(=O)N[C@@H]2[C@H](CCCCC(=O)O)SC[C@@H]21 YBJHBAHKTGYVGT-ZKWXMUAHSA-N 0.000 description 2
- HEDRZPFGACZZDS-UHFFFAOYSA-N Chloroform Chemical compound ClC(Cl)Cl HEDRZPFGACZZDS-UHFFFAOYSA-N 0.000 description 2
- LFQSCWFLJHTTHZ-UHFFFAOYSA-N Ethanol Chemical compound CCO LFQSCWFLJHTTHZ-UHFFFAOYSA-N 0.000 description 2
- WSFSSNUMVMOOMR-UHFFFAOYSA-N Formaldehyde Chemical compound O=C WSFSSNUMVMOOMR-UHFFFAOYSA-N 0.000 description 2
- 102000004856 Lectins Human genes 0.000 description 2
- 108090001090 Lectins Proteins 0.000 description 2
- 108010008038 Synthetic Vaccines Proteins 0.000 description 2
- 208000003441 Transfusion reaction Diseases 0.000 description 2
- 230000008901 benefit Effects 0.000 description 2
- 239000003795 chemical substances by application Substances 0.000 description 2
- 238000000502 dialysis Methods 0.000 description 2
- 238000007865 diluting Methods 0.000 description 2
- 239000003085 diluting agent Substances 0.000 description 2
- 239000003814 drug Substances 0.000 description 2
- 238000001704 evaporation Methods 0.000 description 2
- 230000008020 evaporation Effects 0.000 description 2
- 239000012530 fluid Substances 0.000 description 2
- 238000001802 infusion Methods 0.000 description 2
- 239000002523 lectin Substances 0.000 description 2
- IJJWOSAXNHWBPR-UHFFFAOYSA-N n-(6-hydrazinyl-6-oxohexyl)-5-(2-oxo-1,3,3a,4,6,6a-hexahydrothieno[3,4-d]imidazol-4-yl)pentanamide Chemical compound N1C(=O)NC2C(CCCCC(=O)NCCCCCC(=O)NN)SCC21 IJJWOSAXNHWBPR-UHFFFAOYSA-N 0.000 description 2
- 238000000527 sonication Methods 0.000 description 2
- 210000003462 vein Anatomy 0.000 description 2
- IIZPXYDJLKNOIY-JXPKJXOSSA-N 1-palmitoyl-2-arachidonoyl-sn-glycero-3-phosphocholine Chemical compound CCCCCCCCCCCCCCCC(=O)OC[C@H](COP([O-])(=O)OCC[N+](C)(C)C)OC(=O)CCC\C=C/C\C=C/C\C=C/C\C=C/CCCCC IIZPXYDJLKNOIY-JXPKJXOSSA-N 0.000 description 1
- QCVGEOXPDFCNHA-UHFFFAOYSA-N 5,5-dimethyl-2,4-dioxo-1,3-oxazolidine-3-carboxamide Chemical compound CC1(C)OC(=O)N(C(N)=O)C1=O QCVGEOXPDFCNHA-UHFFFAOYSA-N 0.000 description 1
- 101710186708 Agglutinin Proteins 0.000 description 1
- 206010002091 Anaesthesia Diseases 0.000 description 1
- OZIOWHWTZWIMCZ-MPUPURDASA-N B-Trisaccharide Chemical compound O[C@H]1[C@H](O)[C@H](O)[C@H](C)O[C@H]1O[C@@H](C=O)[C@H]([C@@H](O)[C@H](O)CO)O[C@@H]1[C@H](O)[C@@H](O)[C@@H](O)[C@@H](CO)O1 OZIOWHWTZWIMCZ-MPUPURDASA-N 0.000 description 1
- 108010000912 Egg Proteins Proteins 0.000 description 1
- 102000002322 Egg Proteins Human genes 0.000 description 1
- 241000282412 Homo Species 0.000 description 1
- 101710146024 Horcolin Proteins 0.000 description 1
- 101710189395 Lectin Proteins 0.000 description 1
- 101710179758 Mannose-specific lectin Proteins 0.000 description 1
- 101710150763 Mannose-specific lectin 1 Proteins 0.000 description 1
- 101710150745 Mannose-specific lectin 2 Proteins 0.000 description 1
- 108010090804 Streptavidin Proteins 0.000 description 1
- 230000004523 agglutinating effect Effects 0.000 description 1
- 239000000910 agglutinin Substances 0.000 description 1
- ANBQYFIVLNNZCU-CQCLMDPOSA-N alpha-L-Fucp-(1->2)-[alpha-D-GalpNAc-(1->3)]-beta-D-Galp-(1->3)-[alpha-L-Fucp-(1->4)]-beta-D-GlcpNAc-(1->3)-beta-D-Galp Chemical compound O[C@H]1[C@H](O)[C@H](O)[C@H](C)O[C@H]1O[C@H]1[C@H](O[C@H]2[C@@H]([C@@H](O[C@@H]3[C@@H]([C@@H](O)[C@@H](O)[C@@H](CO)O3)NC(C)=O)[C@@H](O)[C@@H](CO)O2)O[C@H]2[C@H]([C@H](O)[C@H](O)[C@H](C)O2)O)[C@@H](NC(C)=O)[C@H](O[C@H]2[C@H]([C@@H](CO)O[C@@H](O)[C@@H]2O)O)O[C@@H]1CO ANBQYFIVLNNZCU-CQCLMDPOSA-N 0.000 description 1
- 238000001949 anaesthesia Methods 0.000 description 1
- 230000037005 anaesthesia Effects 0.000 description 1
- 230000000890 antigenic effect Effects 0.000 description 1
- 210000003719 b-lymphocyte Anatomy 0.000 description 1
- 230000015572 biosynthetic process Effects 0.000 description 1
- 235000020958 biotin Nutrition 0.000 description 1
- 210000004556 brain Anatomy 0.000 description 1
- 238000004113 cell culture Methods 0.000 description 1
- 239000006285 cell suspension Substances 0.000 description 1
- 238000005119 centrifugation Methods 0.000 description 1
- 230000009920 chelation Effects 0.000 description 1
- RNFNDJAIBTYOQL-UHFFFAOYSA-N chloral hydrate Chemical compound OC(O)C(Cl)(Cl)Cl RNFNDJAIBTYOQL-UHFFFAOYSA-N 0.000 description 1
- 229960002327 chloral hydrate Drugs 0.000 description 1
- 238000011109 contamination Methods 0.000 description 1
- 238000004132 cross linking Methods 0.000 description 1
- 230000009089 cytolysis Effects 0.000 description 1
- 230000034994 death Effects 0.000 description 1
- 235000014113 dietary fatty acids Nutrition 0.000 description 1
- 238000003113 dilution method Methods 0.000 description 1
- 201000010099 disease Diseases 0.000 description 1
- 208000037265 diseases, disorders, signs and symptoms Diseases 0.000 description 1
- 238000004090 dissolution Methods 0.000 description 1
- 238000001035 drying Methods 0.000 description 1
- 230000000694 effects Effects 0.000 description 1
- 235000014103 egg white Nutrition 0.000 description 1
- 210000000969 egg white Anatomy 0.000 description 1
- 238000005516 engineering process Methods 0.000 description 1
- 229930195729 fatty acid Natural products 0.000 description 1
- 239000000194 fatty acid Substances 0.000 description 1
- 150000004665 fatty acids Chemical class 0.000 description 1
- 239000007850 fluorescent dye Substances 0.000 description 1
- 238000001215 fluorescent labelling Methods 0.000 description 1
- 238000010438 heat treatment Methods 0.000 description 1
- 230000002949 hemolytic effect Effects 0.000 description 1
- 238000004128 high performance liquid chromatography Methods 0.000 description 1
- 239000012535 impurity Substances 0.000 description 1
- 239000003978 infusion fluid Substances 0.000 description 1
- 238000013383 initial experiment Methods 0.000 description 1
- 229940028435 intralipid Drugs 0.000 description 1
- 238000002955 isolation Methods 0.000 description 1
- 239000000644 isotonic solution Substances 0.000 description 1
- 210000004731 jugular vein Anatomy 0.000 description 1
- 239000000787 lecithin Substances 0.000 description 1
- 229940067606 lecithin Drugs 0.000 description 1
- 235000010445 lecithin Nutrition 0.000 description 1
- 238000011694 lewis rat Methods 0.000 description 1
- 230000007774 longterm Effects 0.000 description 1
- GBMDVOWEEQVZKZ-UHFFFAOYSA-N methanol;hydrate Chemical compound O.OC GBMDVOWEEQVZKZ-UHFFFAOYSA-N 0.000 description 1
- 238000012986 modification Methods 0.000 description 1
- 230000004048 modification Effects 0.000 description 1
- VYQNWZOUAUKGHI-UHFFFAOYSA-N monobenzone Chemical compound C1=CC(O)=CC=C1OCC1=CC=CC=C1 VYQNWZOUAUKGHI-UHFFFAOYSA-N 0.000 description 1
- 230000003287 optical effect Effects 0.000 description 1
- 210000000056 organ Anatomy 0.000 description 1
- 230000007170 pathology Effects 0.000 description 1
- 229940021222 peritoneal dialysis isotonic solution Drugs 0.000 description 1
- 150000002978 peroxides Chemical class 0.000 description 1
- 150000003904 phospholipids Chemical group 0.000 description 1
- 230000002035 prolonged effect Effects 0.000 description 1
- 238000000275 quality assurance Methods 0.000 description 1
- 230000009467 reduction Effects 0.000 description 1
- 230000002441 reversible effect Effects 0.000 description 1
- 238000002390 rotary evaporation Methods 0.000 description 1
- 238000012216 screening Methods 0.000 description 1
- 238000013207 serial dilution Methods 0.000 description 1
- 210000000813 small intestine Anatomy 0.000 description 1
- JQWHASGSAFIOCM-UHFFFAOYSA-M sodium periodate Chemical compound [Na+].[O-]I(=O)(=O)=O JQWHASGSAFIOCM-UHFFFAOYSA-M 0.000 description 1
- 238000002560 therapeutic procedure Methods 0.000 description 1
- 238000011426 transformation method Methods 0.000 description 1
- 238000002054 transplantation Methods 0.000 description 1
- 238000010792 warming Methods 0.000 description 1
Classifications
-
- C—CHEMISTRY; METALLURGY
- C12—BIOCHEMISTRY; BEER; SPIRITS; WINE; VINEGAR; MICROBIOLOGY; ENZYMOLOGY; MUTATION OR GENETIC ENGINEERING
- C12N—MICROORGANISMS OR ENZYMES; COMPOSITIONS THEREOF; PROPAGATING, PRESERVING, OR MAINTAINING MICROORGANISMS; MUTATION OR GENETIC ENGINEERING; CULTURE MEDIA
- C12N5/00—Undifferentiated human, animal or plant cells, e.g. cell lines; Tissues; Cultivation or maintenance thereof; Culture media therefor
- C12N5/0006—Modification of the membrane of cells, e.g. cell decoration
-
- G—PHYSICS
- G01—MEASURING; TESTING
- G01N—INVESTIGATING OR ANALYSING MATERIALS BY DETERMINING THEIR CHEMICAL OR PHYSICAL PROPERTIES
- G01N33/00—Investigating or analysing materials by specific methods not covered by groups G01N1/00 - G01N31/00
- G01N33/48—Biological material, e.g. blood, urine; Haemocytometers
- G01N33/50—Chemical analysis of biological material, e.g. blood, urine; Testing involving biospecific ligand binding methods; Immunological testing
- G01N33/80—Chemical analysis of biological material, e.g. blood, urine; Testing involving biospecific ligand binding methods; Immunological testing involving blood groups or blood types or red blood cells
-
- G—PHYSICS
- G01—MEASURING; TESTING
- G01N—INVESTIGATING OR ANALYSING MATERIALS BY DETERMINING THEIR CHEMICAL OR PHYSICAL PROPERTIES
- G01N33/00—Investigating or analysing materials by specific methods not covered by groups G01N1/00 - G01N31/00
- G01N33/48—Biological material, e.g. blood, urine; Haemocytometers
- G01N33/50—Chemical analysis of biological material, e.g. blood, urine; Testing involving biospecific ligand binding methods; Immunological testing
- G01N33/96—Chemical analysis of biological material, e.g. blood, urine; Testing involving biospecific ligand binding methods; Immunological testing involving blood or serum control standard
-
- C—CHEMISTRY; METALLURGY
- C12—BIOCHEMISTRY; BEER; SPIRITS; WINE; VINEGAR; MICROBIOLOGY; ENZYMOLOGY; MUTATION OR GENETIC ENGINEERING
- C12N—MICROORGANISMS OR ENZYMES; COMPOSITIONS THEREOF; PROPAGATING, PRESERVING, OR MAINTAINING MICROORGANISMS; MUTATION OR GENETIC ENGINEERING; CULTURE MEDIA
- C12N2503/00—Use of cells in diagnostics
-
- Y—GENERAL TAGGING OF NEW TECHNOLOGICAL DEVELOPMENTS; GENERAL TAGGING OF CROSS-SECTIONAL TECHNOLOGIES SPANNING OVER SEVERAL SECTIONS OF THE IPC; TECHNICAL SUBJECTS COVERED BY FORMER USPC CROSS-REFERENCE ART COLLECTIONS [XRACs] AND DIGESTS
- Y10—TECHNICAL SUBJECTS COVERED BY FORMER USPC
- Y10T—TECHNICAL SUBJECTS COVERED BY FORMER US CLASSIFICATION
- Y10T436/00—Chemistry: analytical and immunological testing
- Y10T436/10—Composition for standardization, calibration, simulation, stabilization, preparation or preservation; processes of use in preparation for chemical testing
- Y10T436/107497—Preparation composition [e.g., lysing or precipitation, etc.]
-
- Y—GENERAL TAGGING OF NEW TECHNOLOGICAL DEVELOPMENTS; GENERAL TAGGING OF CROSS-SECTIONAL TECHNOLOGIES SPANNING OVER SEVERAL SECTIONS OF THE IPC; TECHNICAL SUBJECTS COVERED BY FORMER USPC CROSS-REFERENCE ART COLLECTIONS [XRACs] AND DIGESTS
- Y10—TECHNICAL SUBJECTS COVERED BY FORMER USPC
- Y10T—TECHNICAL SUBJECTS COVERED BY FORMER US CLASSIFICATION
- Y10T436/00—Chemistry: analytical and immunological testing
- Y10T436/25—Chemistry: analytical and immunological testing including sample preparation
Definitions
- This invention relates to the use of artificially modified cells which express blood group (or blood group related) antigens to give cells useful in immunohaematology/haematology/immunology/serology assays as sensitivity controls.
- the invention relates to sensitivity controls for use in transfusion medicine which have been prepared from cells into which A and/or B antigens have been inserted.
- a critical function of blood centres is the testing of blood to accurately determine the blood group type of the individual from whom the blood (or other product) was obtained.
- Knowledge of the blood group type is essential for a variety of therapies including blood transfusion, organ transplantation, and the treatment of haemolytic diseases of the newborn.
- an individual's blood group type must be determined prior to being given a blood transfusion.
- a mismatch of blood group types can have disastrous consequences potentially leading to the death of the transfused individual.
- the ABO blood group system represents the most important of the antigens on human red blood cells (RBCs) for blood transfusion serology.
- Humans belong to one of four major groups: A, B, AB, and O.
- the RBCs of each group respectively carry the A antigen, the B antigen, both A and B antigens, or neither.
- Natural antibodies are present in the blood against the blood group antigen which is absent from the RBCs.
- individuals of group A have anti-B
- those of group B have anti-A
- those of group O have anti-A and anti-B
- those of group AB have neither.
- the blood Before blood transfusion the blood must be cross-matched (either by testing the donor blood against the serum of the recipient or by electronically matching the blood against records) to ensure that RBCs of one group are not given to an individual possessing antibodies against them. RBCs are tested against reagents containing known antibodies (known as forward grouping) and serum is tested against RBCs possessing known antigens (known as reverse grouping).
- Monoclonal antibodies have been used as blood typing reagents since the 1980's. When compared with traditional polyclonal antisera, monoclonal reagents offer increased specificity, consistent reactivity, and, in most cases, increased potency.
- Routine quality control of blood group systems for example, gel cards
- reagents is essential in any blood bank laboratory.
- Reagents and blood grouping systems may suffer reductions in specificity or potency during shipping, storage, or as a result of contamination during storage and use.
- Monoclonal reagents are required to identify all natural variations of ABO blood groups including subgroups of A and B. To ensure correct identification, monoclonal blood grouping reagents and blood grouping systems in blood bank laboratories are tested against RBC reagent controls. For this purpose, RBCs with a weak antigen expression are preferred as the control reagent. This is because such RBCs can provide a better indication of an antiserum's potency for the identification of weak phenotypes.
- weak phenotyping RBCs as control reagents is difficult in practice, due to the very low frequency of subgroup phenotype individuals. For example, the Ax phenotype is estimated as 0.003% of group A and other subgroups have even lower frequency. Artificial weak phenotype RBCs may therefore be useful for this purpose.
- Group O RBCs transformed into artificial group A RBCs or group B RBCs or group AB RBCs appear to resemble weak phenotypes serologically.
- Expression of these antigens can be controlled by changing the insertion conditions, such as the concentration of inserted antigen, and/or the ratio of RBC to antigen for insertion or amount of synthetic antigen added etc.
- the inserted antigens can be stable in the RBC membrane in certain conditions for at least six weeks, and possibly longer.
- serological sensitivity of monoclonal antibodies (antisera) used for the detection of cells that poorly express carbohydrate antigens can be determined in one of several ways: 1. Testing against natural weak subgroups. This involves finding a rare subgroup, preparing cells of this subgroup ready for use, and then using them as controls. 2. Testing against normal cells. This involves testing common cells and does not give any indication of sensitivity. 3. Diluting antisera to determine potency. This involves diluting antibodies and testing against normal antigens. This is the most common practice in the absence of true controls.
- Natural cells due to their frequency, are very difficult to obtain and maintain supply. In addition, they vary between individuals. Constant supply would be difficult, if not impractical. Further, different populations have different frequencies of weak subgroups.
- Normal cells express high levels of antigen, for example in the region of >500,000 copies per red cell.
- the reagents are typically diluted to show that at low dilution they can still react with RBCs and give a serologically positive result.
- This dilution sensitivity method is time consuming. The results are then extrapolated to determine the detection level of antigen at normal dilution.
- This flawed methodology is unfortunately the practice in most places. Detection of reagent deterioration would only be possible if regular time consuming dilution studies were undertaken or weak subgroups were tested.
- sensitivity control reagents which have a known predetermined amount of antigen expression and are therefore capable of being used to calibrate testing reagents or testing systems to give accurate and standardised determinations of blood group types.
- a process for preparing a sensitivity control for blood group determination including: • dissolving an amount of an antigen in water optionally containing one or more dissolved salts to give an antigen solution of known concentration; and
- the cells of the aqueous solution are not modified and the transformed cells comprise antigen molecules inserted directly into the cell membranes.
- the cells of the aqueous solution are modified by the insertion of a linker molecule and the transformed cells comprise antigen molecules attached to the cell membranes via the linker molecules.
- the cells used may be any cell type including animal cells, plant cells, bacterial cells, or cells or vesicles having an artificial cell membrane. However, it is preferred that the cells used are animal cells. It is further preferred that the animal cells are human red blood cells.
- the linker molecule includes a lipid tail and a bridge that joins the lipid tail to the antigen.
- the linker molecule preferably contains a biotinylated glycolipid.
- One example of the bridge is a biotin-avidin bridge.
- the antigen is a glycolipid or a biotinylated carbohydrate.
- the glycolipid is a blood group-related glycolipid such as an A, B, H, Lewis, or Gal(alpha) glycosphingolipid.
- the biotinylated carbohydrate is a biotinylated blood group-related carbohydrate such as A, B, H,
- a process for the determination of the sensitivity of a blood group testing reagent or testing system including:
- the assessment of the level of antigen-antibody reactivity may be by assessing direct agglutination or by induced agglutination. Induced agglutination includes potentiation or the use of antiglobulin molecules or by using enzymes. Preferably the assessment is by the use of enzyme labels, radioactive labels, or fluorescence labels.
- a sensitivity control obtained by the process of the first aspect of the invention for measuring the effectiveness of one or more reagents or testing systems used in blood group determinations.
- kits containing components suitable for carrying out a blood group determination where the kit includes a sensitivity control obtained by the process of the first aspect of this invention.
- Figure 1 shows the flow cytometry results of varying the amount of glycolipid Le on in vivo transformation of rat peripheral blood cells using anti-Le b as the primary antibody
- Figure 2 shows the flow cytometry results of varying the time between 1 to 12 days on in vivo transformation of rat peripheral blood cells using anti-Le b as the primary antibody.
- Figure 3 shows the flow cytometry results of varying the time between 16 to 28 days on in vivo transformation of rat peripheral blood cells using anti-Le b as the primary antibody.
- Figure 4 shows the flow cytometry results of varying the time of in vitro transformation of red cells between 0 and 8 hours at 37°C using two different anti-Le b primary reagents.
- Figure 5 shows the flow cytometry results of varying the time of in vitro transformation of red cells between 0 and 8 hours at 22°C (RT) using two different anti-Le b primary reagents.
- Figure 6 shows the flow cytometry results of varying the time of in vitro transformation of red cells between 0 to 7 hours at 4 ° C using two different anti- Le b primary reagents.
- glycosphingolipid antigens Although much of the following description refers to glycosphingolipid antigens, it is to be appreciated that other antigens, including other glycolipids and synthetic antigens are also encompassed by the invention. It is also to be appreciated that the term "antigen" includes modified antigens such as antigens having an attached molecule enabling binding to a linker molecule. For example, in the case of a linker molecule ending in an avidin, the antigen will be a biotinylated antigen.
- Linker molecules may be any molecules capable of linking an antigen to a lipid which is inserted into the membrane of a cell.
- a linker molecule will typically have a carbohydrate part joined to the lipid by a bridge, such as a biotin-avidin bridge.
- Other bridges may, however, be used such as any bridge based on chelation binding.
- any reference in this specification to a solution of cells is intended to include a suspension of cells.
- Glycolipids as blood group antigens can be taken up by RBCs from plasma. This knowledge came partly from studies of the Lewis system. Plasma lipids exchange with lipids in the RBC membrane and the composition of phospholipids and fatty acids in RBC membranes resembles that in plasma. Consequently, plasma glycosphingolipids bearing Lewis or ABH structures become incorporated into the RBC membrane.
- Insertion technologies are based on established principles that glycolipid antigens can insert into the red cell membrane without damaging the cell.
- the amount of antigen inserted/expressed can be controlled thereby creating cells with specific performance characteristics. These cells can either resemble natural weak subgroups or unnatural (not naturally occurring) blood group expressing cells.
- the amount of antigen expressed on the cells can be set according to the requirements of the users. Different levels of expression are possible, for example 5 %, 10 %, 20 %, or 1000 copies, 5000 copies, etc per red cell.
- One control may be set at the clinical threshold at which failure to detect an antigen may result in a clinically significant transfusion reaction.
- Other controls can be set at levels that will ensure confidence in the detection of weak subgroups. These controls can validate the performance of ABO blood grouping tests by making the sensitivity levels measurable. This can ensure the provision of safer ABO grouped blood.
- the sensitivity control of the invention is useful for determining the sensitivity of blood group testing reagents and/or testing systems, including gel cards.
- Weak subgroup sensitivity controls for use in transfusion medicine are made from group O cells into which specific amounts of A and/or B antigens are inserted to give specific reaction scores in antigen detection assays.
- the assays may include tile, tube, gel card, and microplate methods, and any manual or automated platform which uses agglutination, or any other method of antigen detection (for example, enzyme linked immunoassasy, flow cytometry etc).
- RBCs Although it is preferred to use human RBCs for the invention, the RBCs of other animals can be used.
- RBCs of other animals can be used.
- RBCs it is to be appreciated that other cells such as platelets, white cells, plant cells, cell culture cells, bacterial cells and artificial cell membranes may be used.
- Red blood cells expressing inserted antigens can be created either in vitro or in vivo using human or other animal cells. Creating cells in vivo requires injecting specific amounts of antigen into the circulation system of a human or other animal and then obtaining the blood either immediately or over timed periods. The latter produces decreasing amounts of expressed antigen (effectively a natural titre). This method can be used to create cells expressing some antigens but not others. For example, animal RBCs can be used to create ABO typing RBCs which are negative for the human Kell, Duffy, Rhesus, or Kidd antigens.
- Agglutination is one measure for antigen detection. Agglutination is the clumping of red cells caused by antibody or lectin crosslinking the antigens on different cells. Agglutination can be visualised manually (by eye) or in automated techniques by blood group analysers. Manual agglutination reactions can be scored according to the following scheme:
- the amount of inserted antigens is proportional to the concentration of the glycolipid insertion solution and/or temperature and/or time of contact. RBCs can be transformed with short or long chain glycolipids.
- RBCs can be transformed with specific components of the ABO system.
- RBCs expressing components of the A antigens such as ALe b or A type 3 can be created. Such cells would be important for determining the specificity of certain antibodies and in the screening of monoclonal antibody panels.
- ratio of RBC concentration to glycolipid concentration is that a ratio of between 1 :1 and 3:1 leads to efficient transformation of group O RBCs and strong agglutination scores with anti-A or anti-B.
- a ratio of 4:1 or greater leads to less insertion of antigens.
- 3:1 is the most economical ratio to give a strong serological score.
- RBCs may be used if a weak phenotype is desired.
- Concentrated glycolipid solutions can effectively insert antigens into RBCs within two hours. Longer incubation times result in better insertion, although after extended times (32 hours) the serology deteriorates (see Example 5). This deterioration is considered to be due to the deterioration of the RBCs after prolonged incubation at 37 °C, rather than the loss of antigen.
- the time taken for insertion of antigen molecules into the membranes of the cells depends on the relative concentrations of the antigen solution and the cell solution and temperature. However, it is preferred that for an antigen solution with a concentration of approximately 10 mg/ml and a ratio of packed red blood cells of 3:1 at 25 °C, the insertion time is approximately 4 hours.
- Changes in the insertion conditions can allow the controlling of antigen expression on RBCs. If weak A or weak B cells are desired, then low glycolipid concentration or high RBC:glycolipid ratios can be used for insertion. If strongly agglutinating phenotypes are needed, high concentrations of glycolipid solution or lower RBOglycolipid ratios can give the strongest serology. By manipulating glycolipid concentrations, RBCs can be "created" which express more than 20 times the amount of antigen normally found in the RBC membrane.
- the primary advantage of the invention is that the amount of antigen expression can be controlled to meet specific sensitivity requirement. For example, one cell could contain the number of antigens which correlates with a clinical significance level. Therefore, if this cell produces a positive serology result then the user can be assured they will not miss any clinically significant subtypes.
- Another cell could be set at specific antigen thresholds, for example one for each of the different subtypes thereby allowing for known levels of sensitivity. Such cells could also be used to calibrate highly sensitive machines or could even be used in flow cytometry analysis for antigen quantitation curves.
- the methodology allows cells to be standardised and be consistent worldwide.
- the sensitivity control of this invention preferably is a set of a group A (weak) phenotype and a group B (weak) phenotype. It is further preferred that one would also be Rh DCce (R1 r) and the other Rh ce(rr). This would ensure that both the ABO and RhD grouping reagents could be quality controlled by the same set of cells. Additionally, another set with a range of weak AB antigens may be useful for more specialised laboratories. Alternatively, animal cells lacking specific human antigens could be used. For example, some animal cells would be the equivalent of Rh null (i.e. lacking Rh antigens). Some laboratories perform ABO and RhD quality control effectively, but others do not.
- a further advantage of the invention is that the insertion fluid containing the antigen may be dried and stored without deterioration for long periods of time. Reconstitution of the transforming solution and its addition to cells could allow for the creation of small volumes of specialised cells as required, for example, acquired B. Such products do not currently exist.
- Glycolipid insertion solutions were prepared according to the following method:
- the tube was marked at the 100 ⁇ l level, and the glycolipid solution was dried at 60 °C with nitrogen gas to below the mark. This step evaporates most of the methanol in the solution and leaves the glycolipid dissolved in water.
- Glycolipids were inserted into RBCs according to the following method:
- Celpresol is an RBC preservative solution (obtained from CSL Biosciences, Sydney, Australia). However, saline or other isotonic solutions, or cell storage solutions (e.g. CellStab) may be used.
- the RBC suspension (25 ⁇ L) was added to a small glass tube. Antiserum (25 ⁇ L) was then added. 3. The RBC suspension and the antiserum were mixed well and spun in an immunofuge for 15 seconds. 4. The amount of agglutination was read and scored.
- serological phenotyping antibodies available which can be tested using the controls of this invention are shown below. This list of examples is not exhaustive and other antibodies may be applicable to this invention. Some of these reagents tested were expired and were used for demonstrative purposes only.
- the incubation time of glycolipid insertion was investigated by adding 180 ⁇ l of packed group O RBCs to 60 ⁇ l of 9.6, 4.8, 2.4, 1.2 and 0.6 mg/ml long chain A or short chain B glycolipid solutions, respectively. A 25 ⁇ l aliquot was removed after incubation with glycolipids for 1 , 2, 4, 8, 24, 48 and 72 hours. Serology tests were performed on the cells. The results are summarised in Table 1 and Table 2. Table 1. Study on insertion incubation time: group O RBCs transformed with neutral A glycolipids and tested against Bioclone anti-A
- Anti-A Bioclone
- Anti-B CSL.
- anti-A, anti-B and anti-AB reagents were tested for their potency against RBCs transformed with neutral A and B glycolipids using the method of this invention.
- the RBCs were tested on the day of insertion.
- glycolipid concentration of transformation media (mg/ml)
- glycolipid concentration of transformation media (mg/ml)
- Le b glycolipid can insert into RBCs when the Le glycolipid is suspended in Le(b-) plasma and mixed with RBCs of the same type in different ratios and incubated for two hours at 37 °C. The results are shown in Table 8.
- This example describes the procedure used for flow cytometry analysis.
- Washed rat red cells were fixed by adding one part of red cells to 20 parts of 10% formalin and incubating overnight at room temperature. The fixed cells were washed 4 times in PBS and diluted in 0.5% BSA in buffer 1 (phosphate buffered 50mM NaCI, pH 8.0) to a final concentration of 5 * 10 6 cells/ml before incubation with the Lewis antibodies. Fluorescent labelling conditions used were based on the work of Murai et al. (Clinica Chimica Acta, 1994, 226, 21-28).
- Labelled cells were then washed twice in 1 ml of buffer 2 and incubated at 4°C for 10 minutes with 100 ⁇ l of RPE- Streptavidin (R0438 Dako A/S, diluted " 1 :15 in buffer 3, phosphate buffered 200 mM NaCI, pH 7.0), washed once in and then suspended in 500 ⁇ l of buffer 3.
- RPE- Streptavidin R0438 Dako A/S, diluted " 1 :15 in buffer 3, phosphate buffered 200 mM NaCI, pH 7.0
- Flow cytometric analysis was within 1 hour, with 5000 cells being counted for each sample.
- Glycolipids were emulsified into Emulsan ® , a parenteral lipid infusion fluid which contains 20% soy oil fraction, 1.2% lecithin/egg white, and 22% glycerol, w/v.
- Serial dilutions with glycolipid concentrations ranging from 0.03 to 2.0 mg/150 ⁇ l were prepared from a stock solution (13.3 ⁇ g/ ⁇ l) of glycolipid in Emulsan ® . After anaesthesia (8% chloralhydrate at a dose of 3.3 ml/kg) the jugular vein of rats was surgically exposed and 150 ⁇ l of a glycolipid/ Emulsan ® dilution was infused. The operation site was then sutured.
- red cells were obtained by warming the rats under heat lamps, applying a tourniquet to the tail, and making a small puncture of a tail vein with a microlance and obtaining blood. Red cells were obtained from the whole blood by centrifugation and washing three times.
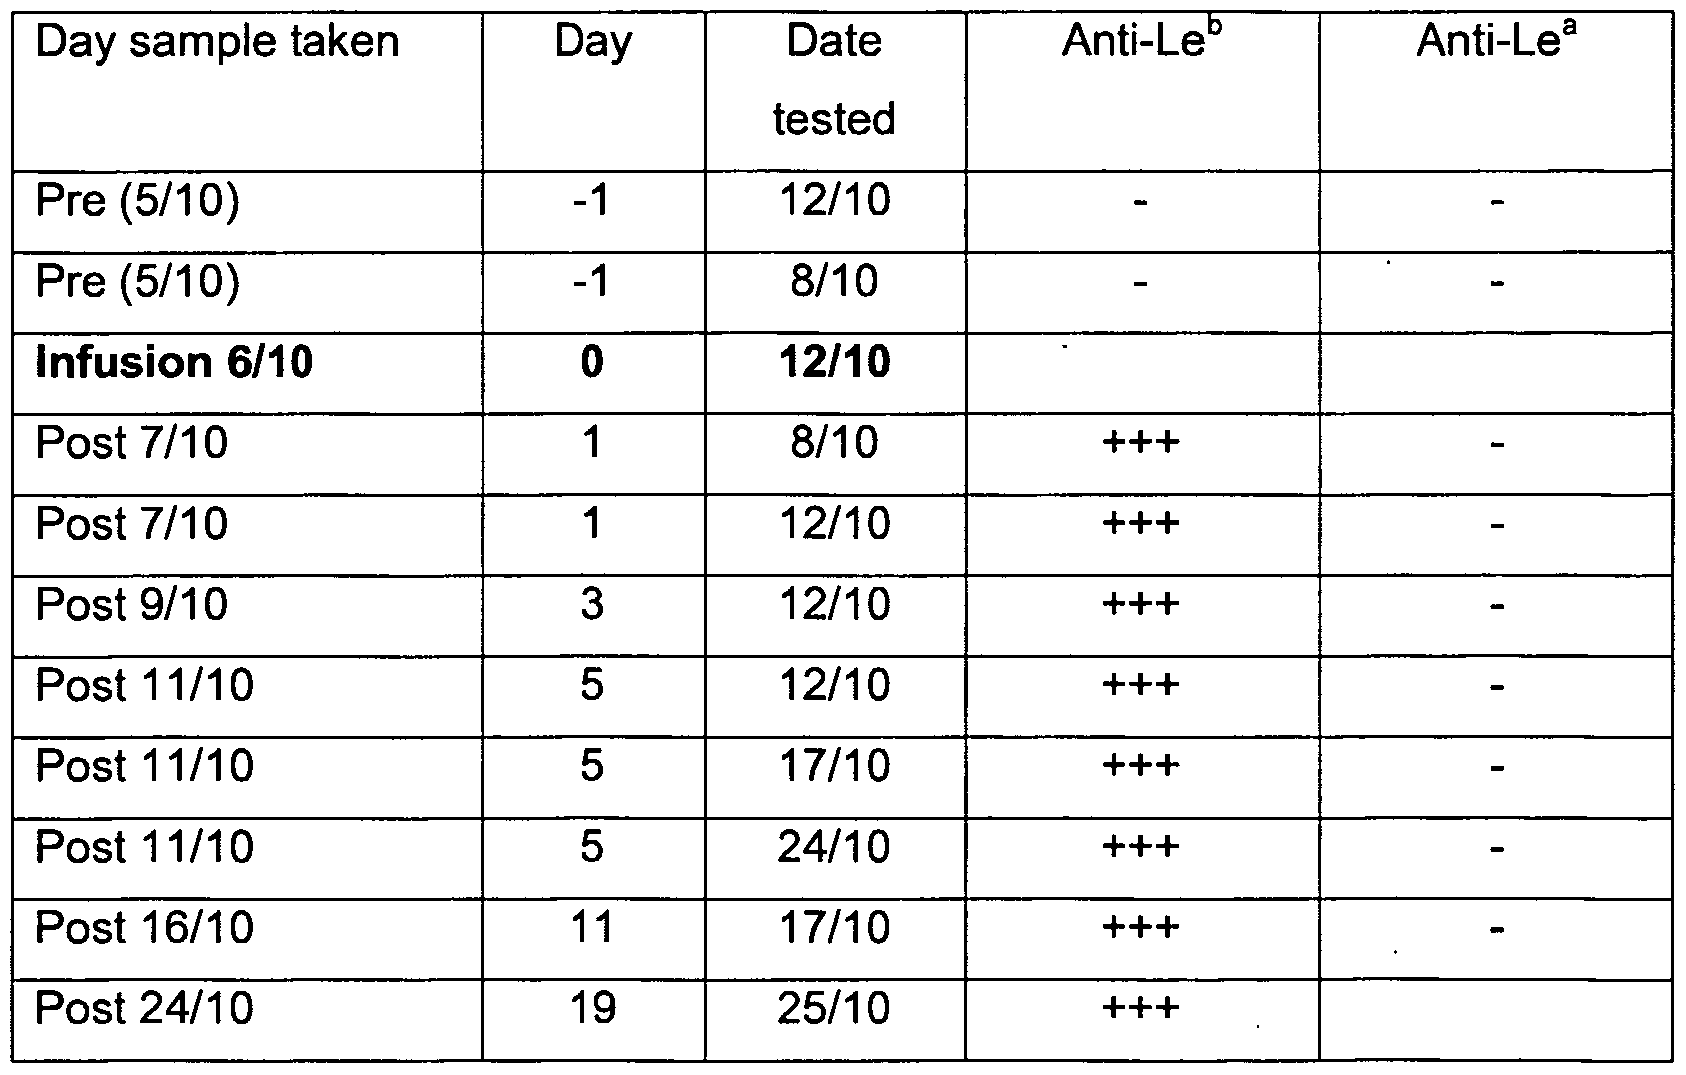
- Serology with anti-Le b analysis of in vivo transformation of rat red cells Rats were injected intravenously with different doses of Le b -6 glycolipids. Blood samples were taken on the days indicated in Table 9. Serological direct agglutination with anti-Le b was graded from negative (-) to very strongly positive ( ++ ++).
- Rabbit peripheral blood cells were transformed in vivo using the following method.
- Glycolipids were prepared by dissolving 200 mg of total glycolipids (group ALe(a- b+)) from small intestine in 100 ⁇ l of warm ethanol. Warm (37°C) intralipid (Pharmacia) (2 ml) was added followed by brief sonication. Glycolipid was infused into a marginal ear vein (slow infusion). Rabbits were bled pre and post infusion (about 0.2-0.5 ml) and serology tested with anti-Lewis reagents (anti-Le b Gamma Biological LBM26-1 and sometimes anti-Le a Gamma Biologicals LAM25- 1 ) (see Example D). Testing at later dates also involved retesting earlier samples as controls of stability of stored cells. Cells were stored at 4°C in red cell preservative solution (Celpresol, CSL Australia).
- Rat red cells were transformed in vitro according to the following method.
- glycolipid diluent Normal rat plasma was used as the glycolipid diluent (although any other diluent can be used).
- a 250 ⁇ g Le b per ml stock solution of glycolipid in plasma was prepared in 1 ml of plasma. Further dilutions of this stock solution in rat plasma were prepared as required.
- Transformed red cells were prepared by adding an equal volume of plasma containing Lewis glycolipids (600 ⁇ l) to an equal volume of washed packed red cells (600 ⁇ l) and incubated as appropriate. At timed intervals, 75 ⁇ l of mixture was removed and any reactions stopped by washing the cells three times with saline and then suspended in saline. Cells were stored at 4°C until serology was tested (against anti-Le b ) (Example E).
- Dried glycolipid samples with PBS salts were prepared and reconstituted using the following methods:
- Glycolipid samples were prepared and dried as follows:
- the solution periodically separated out into two phases, and a small amount of methanol was added to return it to one phase to facilitate evaporation.
- the glycolipid sample could be fully dried in this way.
- the glycolipid sample can be frozen at minus 85°C and freeze-dried.
- the dried glycolipid samples were redissolved as follows:
- Deionised water 500 ⁇ l was added to the dried glycolipid samples to produce a 50 mg/ml solution of glycolipid in PBS. The tube was sonicated for 2 min to ensure that the sample was completely dissolved. The sample could then be further diluted to desired concentrations with working strength PBS.
- the transformed RBCs were washed 3x with PBS and then suspended in a cell preservative solution at a concentration suitable for serology.
- Tube serology results from glycolipid insertion experiments at day 1 and after 25 and 62 days storage at 4 °C are shown in Table 14 below.
- Cell agglutination was assessed using the Diamed-ID Micro Typing System in addition to using conventional tube serology.
- the cards used were NaCI, enzyme test and cold agglutinin cards, which are not pre-loaded with any antisera or other reagents. This allows the use of specific antisera.
- Tables 15 and 16 below show the agglutination results obtained with this system.
- the antibody used is a Seraclone anti- A (experiment KIL2202 E16-1 ).
- Diamed-ID Micro Typing System agglutination results for group O cells transformed 17 days previously with A glycolipid.
- the antibody used is a Seraclone anti-A (experiment KIL2202 E41-2).
- a glycolipid (mg/mL)
- the stability of the glycolipid insertion was investigated according to the following method.
- Biotinylated gangliosides were prepared using a modified procedure described by Wilchek and Bayer (1987):
- BioG samples 50 mg/ml were diluted to the desired concentration in working strength PBS.
- the synthetic transformation system occurs in three sequential stages. The first is the insertion of the biotinylated gangliosides (BioG) into the RBC membrane, followed by the conjugation of avidin (Av) onto the biotin of the ganglioside, and finishing with the conjugation of a biotinylated saccharide (eg A-PAA or B-PAA) onto the avidin molecule. All initial experiments were conducted with A-PAA.
- BioG (20 ⁇ l, 0.01 mg/ml for cells intended for A-PAA conjugation) and washed packed group O RBCs (60 ⁇ l) were added to an eppendorf tube.
- Biotinylated saccharides 60 ⁇ l, 0.001 mg/mL were added to the eppendorf tube containing the washed Av-BioG RBCs (approximately 60 ⁇ l of red cells).
- a block titre was carried out to determine the minimum concentrations of both BioG and A-PAA required to generate RBCs that produce positive agglutination when tested against anti-A. The results are shown in Tables 19 and 20 below. Table 19. Block Titre Results for A-PAA saccharide using a Seraclone anti-A.
- BioG concentrations were analysed by the following methods. Cells were prepared using BioG concentrations of 0.5 mg/ml, 0.25 mg/ml, 0.12 mg/ml and 0.05 mg/ml with an A-PAA saccharide concentration of 0.01 and
- Seraclone and Albaclone anti-A sera were equivalent.
- the cells were transformed with the concentrations of BioG shown and A-PAA saccharide 0.01 mg/ml.
- a trial of several expired antisera was carried out on cells transformed with 0.5 mg/ml, 0.25 mg/ml, 0.12 mg/ml and 0.05 mg/ml of BioG in block titre combination with 10 ⁇ g/ml, 7.5 ⁇ g/ml and 5 ⁇ g/ml of A-PAA.
- the antisera used are shown in Table 23 and results are given in Table 24.
- Negative control 0 0 (+) 0 0 0 0 0 0 0 0 0 0 0 0 0
- Diamed-ID Micro Typing System agglutination results for group O cells transformed with the indicated concentrations of BioG and A-PAA.
- the antibody used is the Albaclone anti-A (experiment KIL2403 E93-1-1 ).
- Table 26 Diamed-ID Micro Typing System agglutination results for group O cells transformed with the indicated concentrations of BioG and A-PAA.
- the antibody used is the Albaclone anti-A (experiment KIL2403 E93-1-2).
- O cells were synthetically transformed with a biotinylated B-trisaccharide with the PAA linker (B-PAA).
- B-PAA biotinylated B-trisaccharide with the PAA linker
- BioG concentrations used were 0.5 mg/ml, 0.25 mg/ml, 0.12 mg/ml and 0.05 mg/ml
- the B-PAA concentrations were 10 ⁇ g/ml, 7.5 ⁇ g/ml and 5 ⁇ g/ml as for the A-PAA.
- the B antisera used are shown in Table 28, and the results of the trial are presented in Table 29.
Abstract
Description


Claims
Priority Applications (10)
| Application Number | Priority Date | Filing Date | Title |
|---|---|---|---|
| AT02780208T ATE444494T1 (en) | 2001-10-16 | 2002-10-16 | BLOOD SEROLOGY SENSITIVITY CONTROLS PREPARED FROM MODIFIED CELLS |
| EA200400553A EA006577B1 (en) | 2001-10-16 | 2002-10-16 | Sensitivity controls for blood serology prepared from modified cells |
| JP2003536757A JP4428628B2 (en) | 2001-10-16 | 2002-10-16 | Serological sensitivity control produced from modified cells |
| EP02780208A EP1442305B1 (en) | 2001-10-16 | 2002-10-16 | Sensitivity controls for blood serology prepared from modified cells |
| US10/492,863 US7678574B2 (en) | 2001-10-16 | 2002-10-16 | Sensitivity controls for blood serology prepared from modified cells |
| AU2002343279A AU2002343279B2 (en) | 2001-10-16 | 2002-10-16 | Sensitivity controls for blood serology prepared from modified cells |
| CA2463693A CA2463693C (en) | 2001-10-16 | 2002-10-16 | Sensitivity controls for blood serology prepared from modified cells |
| IL16134102A IL161341A0 (en) | 2001-10-16 | 2002-10-16 | Sensitivity controls for blood serology prepared from modified cells |
| DE60233885T DE60233885D1 (en) | 2001-10-16 | 2002-10-16 | FROM MODIFIED CELLS PREPARED SENSITIVITY CHECKS FOR BLOOD SEROLOGY |
| IL161341A IL161341A (en) | 2001-10-16 | 2004-04-13 | Sensitivity controls for blood serology prepared from modified cells |
Applications Claiming Priority (4)
| Application Number | Priority Date | Filing Date | Title |
|---|---|---|---|
| NZ51484901 | 2001-10-16 | ||
| NZ514849 | 2001-10-16 | ||
| NZ516901 | 2002-01-29 | ||
| NZ51690102 | 2002-01-29 |
Publications (1)
| Publication Number | Publication Date |
|---|---|
| WO2003034074A1 true WO2003034074A1 (en) | 2003-04-24 |
Family
ID=26652288
Family Applications (1)
| Application Number | Title | Priority Date | Filing Date |
|---|---|---|---|
| PCT/NZ2002/000214 WO2003034074A1 (en) | 2001-10-16 | 2002-10-16 | Sensitivity controls for blood serology prepared from modified cells |
Country Status (11)
| Country | Link |
|---|---|
| US (1) | US7678574B2 (en) |
| EP (1) | EP1442305B1 (en) |
| JP (1) | JP4428628B2 (en) |
| CN (1) | CN100458445C (en) |
| AT (1) | ATE444494T1 (en) |
| AU (1) | AU2002343279B2 (en) |
| CA (1) | CA2463693C (en) |
| DE (1) | DE60233885D1 (en) |
| EA (1) | EA006577B1 (en) |
| IL (2) | IL161341A0 (en) |
| WO (1) | WO2003034074A1 (en) |
Cited By (6)
| Publication number | Priority date | Publication date | Assignee | Title |
|---|---|---|---|---|
| JP2005233935A (en) * | 2003-12-19 | 2005-09-02 | Beckman Coulter Inc | Hematological control of reticulocyte and nucleated red blood cell |
| US8183214B2 (en) | 2005-09-21 | 2012-05-22 | Kode Biotech Limited | Cell surface coating with hyaluronic acid oligomer derivative |
| US8637473B2 (en) | 2004-03-22 | 2014-01-28 | Kode Biotech Limited | Synthetic membrane anchors |
| EP2698636A1 (en) | 2012-08-13 | 2014-02-19 | Fundació Institut d'Investigació Biomèdica de Bellvitge | Methods and reagents for prevention and/or treatment of transplant rejection |
| WO2014068408A2 (en) | 2012-10-23 | 2014-05-08 | Caris Life Sciences Switzerland Holdings, S.A.R.L. | Aptamers and uses thereof |
| US10858384B2 (en) | 2004-03-22 | 2020-12-08 | Kode Biotech Limited | Synthetic molecule constructs |
Families Citing this family (5)
| Publication number | Priority date | Publication date | Assignee | Title |
|---|---|---|---|---|
| US20070287196A1 (en) * | 2004-06-11 | 2007-12-13 | Adeka Corporation | Enzymatic Modification of Cell-Surface H Antigen by Glycosyltransferases |
| US10942184B2 (en) | 2012-10-23 | 2021-03-09 | Caris Science, Inc. | Aptamers and uses thereof |
| WO2014100434A1 (en) | 2012-12-19 | 2014-06-26 | Caris Science, Inc. | Compositions and methods for aptamer screening |
| CN109239372A (en) * | 2018-11-02 | 2019-01-18 | 上海市血液中心 | Abo blood group antigen detectability verifies product and its application |
| CN115343485B (en) * | 2022-10-18 | 2023-01-06 | 天津德祥生物技术股份有限公司 | Application of blood group antigen-trisaccharide conjugate in blood group antibody detection |
Citations (3)
| Publication number | Priority date | Publication date | Assignee | Title |
|---|---|---|---|---|
| US5512485A (en) * | 1992-02-24 | 1996-04-30 | Coulter Corporation | Hematology control composition including leukocyte analogs; and methods for their preparation and use |
| US5677176A (en) * | 1987-06-30 | 1997-10-14 | Hapgood, C.V. | Animal derived cell with antigenic protein introduced therein |
| JP2001089494A (en) * | 1999-07-16 | 2001-04-03 | Wako Pure Chem Ind Ltd | Sugar chain compound and its use |
Family Cites Families (4)
| Publication number | Priority date | Publication date | Assignee | Title |
|---|---|---|---|---|
| US4609627A (en) * | 1983-08-01 | 1986-09-02 | New York Blood Center, Inc. | Enzymatic conversion of certain sub-type A and AB erythrocytes |
| US6440736B1 (en) * | 1998-10-16 | 2002-08-27 | U-Bisys B.V. | Altering the properties of cells or of particles with membranes derived from cells by means of lipid-modified proteinaceous molecules |
| JP2001089484A (en) | 1999-09-22 | 2001-04-03 | Kankyo Meneki Gijutsu Kenkyusho:Kk | Hapten compound of tricyclazole, antibody and assay |
| US6316256B1 (en) * | 2000-01-03 | 2001-11-13 | Tr Associates, L.L.C. | Method for protein transfer |
-
2002
- 2002-10-16 EA EA200400553A patent/EA006577B1/en not_active IP Right Cessation
- 2002-10-16 CN CNB028205251A patent/CN100458445C/en not_active Expired - Fee Related
- 2002-10-16 CA CA2463693A patent/CA2463693C/en not_active Expired - Fee Related
- 2002-10-16 IL IL16134102A patent/IL161341A0/en unknown
- 2002-10-16 AT AT02780208T patent/ATE444494T1/en not_active IP Right Cessation
- 2002-10-16 JP JP2003536757A patent/JP4428628B2/en not_active Expired - Lifetime
- 2002-10-16 AU AU2002343279A patent/AU2002343279B2/en not_active Ceased
- 2002-10-16 DE DE60233885T patent/DE60233885D1/en not_active Expired - Lifetime
- 2002-10-16 EP EP02780208A patent/EP1442305B1/en not_active Expired - Lifetime
- 2002-10-16 US US10/492,863 patent/US7678574B2/en not_active Expired - Fee Related
- 2002-10-16 WO PCT/NZ2002/000214 patent/WO2003034074A1/en active Application Filing
-
2004
- 2004-04-13 IL IL161341A patent/IL161341A/en not_active IP Right Cessation
Patent Citations (3)
| Publication number | Priority date | Publication date | Assignee | Title |
|---|---|---|---|---|
| US5677176A (en) * | 1987-06-30 | 1997-10-14 | Hapgood, C.V. | Animal derived cell with antigenic protein introduced therein |
| US5512485A (en) * | 1992-02-24 | 1996-04-30 | Coulter Corporation | Hematology control composition including leukocyte analogs; and methods for their preparation and use |
| JP2001089494A (en) * | 1999-07-16 | 2001-04-03 | Wako Pure Chem Ind Ltd | Sugar chain compound and its use |
Non-Patent Citations (4)
| Title |
|---|
| CIVENNI G. ET AL: "In vitro incorporation of GPI-anchored proteins into human erythrocytes and their fate in the membrane", BLOOD, vol. 91, no. 5, 1 March 1998 (1998-03-01), pages 1784 - 1792, XP002977992 * |
| DATABASE WPI Week 200136, Derwent World Patents Index; Class BO3, AN 2001-338580, XP002977993 * |
| MOUNEIMNE Y. ET AL: "Electroinsertion of xeno proteins in red blood cell membranes yields a long lived protein carrier in circulation", BIOCHIMICA ET BIOPHYSICA ACTA, vol. 1066, 1991, pages 83 - 89, XP002977991 * |
| TOLVANEN M. ET AL: "In vitro attachment of mono- and oligosaccharides to surface glycoconjugates of intact cells", THE JOURNAL OF BIOLOGICAL CHEMISTRY, vol. 261, no. 20, July 1986 (1986-07-01), pages 9546 - 9511, XP002977994 * |
Cited By (10)
| Publication number | Priority date | Publication date | Assignee | Title |
|---|---|---|---|---|
| JP2005233935A (en) * | 2003-12-19 | 2005-09-02 | Beckman Coulter Inc | Hematological control of reticulocyte and nucleated red blood cell |
| US8637473B2 (en) | 2004-03-22 | 2014-01-28 | Kode Biotech Limited | Synthetic membrane anchors |
| US9353349B2 (en) | 2004-03-22 | 2016-05-31 | Kode Biotech Limited | Synthetic membrane anchors |
| US9809614B2 (en) | 2004-03-22 | 2017-11-07 | Kode Biotech Limited | Synthetic membrane anchors |
| US10414786B2 (en) | 2004-03-22 | 2019-09-17 | Kode Biotech Limited | Synthetic membrane anchors |
| US10858384B2 (en) | 2004-03-22 | 2020-12-08 | Kode Biotech Limited | Synthetic molecule constructs |
| US8183214B2 (en) | 2005-09-21 | 2012-05-22 | Kode Biotech Limited | Cell surface coating with hyaluronic acid oligomer derivative |
| EP2698636A1 (en) | 2012-08-13 | 2014-02-19 | Fundació Institut d'Investigació Biomèdica de Bellvitge | Methods and reagents for prevention and/or treatment of transplant rejection |
| WO2014068408A2 (en) | 2012-10-23 | 2014-05-08 | Caris Life Sciences Switzerland Holdings, S.A.R.L. | Aptamers and uses thereof |
| EP4170031A1 (en) | 2012-10-23 | 2023-04-26 | Caris Science, Inc. | Aptamers and uses thereof |
Also Published As
| Publication number | Publication date |
|---|---|
| EP1442305A1 (en) | 2004-08-04 |
| DE60233885D1 (en) | 2009-11-12 |
| JP4428628B2 (en) | 2010-03-10 |
| EP1442305A4 (en) | 2004-12-15 |
| AU2002343279B2 (en) | 2008-09-25 |
| IL161341A0 (en) | 2004-09-27 |
| EA006577B1 (en) | 2006-02-24 |
| US7678574B2 (en) | 2010-03-16 |
| CN1571927A (en) | 2005-01-26 |
| EP1442305B1 (en) | 2009-09-30 |
| CN100458445C (en) | 2009-02-04 |
| JP2005505779A (en) | 2005-02-24 |
| IL161341A (en) | 2010-11-30 |
| EA200400553A1 (en) | 2004-12-30 |
| ATE444494T1 (en) | 2009-10-15 |
| CA2463693A1 (en) | 2003-04-24 |
| CA2463693C (en) | 2012-08-28 |
| US20050042697A1 (en) | 2005-02-24 |
Similar Documents
| Publication | Publication Date | Title |
|---|---|---|
| JP5768371B2 (en) | Multiple analysis of blood samples | |
| US8802385B2 (en) | Suspension medium for red blood cells comprising amino acids | |
| US7678574B2 (en) | Sensitivity controls for blood serology prepared from modified cells | |
| AU2002343279A1 (en) | Sensitivity controls for blood serology prepared from modified cells | |
| PT88615B (en) | EQUIPMENT AND METHOD OF IMMUNOMETRIC DOSAGE APPLICABLE TO COMPLETE CELLS | |
| EP0000102B1 (en) | Immunologic compositions, methods for preparing them and methods for conducting haemagglutination tests | |
| US4320111A (en) | Immunologic compositions methods of preparation and use | |
| US20110312005A1 (en) | Enzymatic modification of cell-surface H antigen by glycosyltransferases | |
| CA2573311A1 (en) | Method of removing adhesive microvesicles | |
| Alving et al. | The preparation and properties of liposomes in the LA and LAC states | |
| Cowley et al. | Biotinylation modifies red cell antigens | |
| CA2148971A1 (en) | Calibrator matrix | |
| CA2516123A1 (en) | Preparation of red blood cells with a modified level of blood group antigen expression and their use in the quality control of blood typing reagents | |
| US10444240B2 (en) | Rare cell concentration | |
| Ballas et al. | Erythrocyte Rh antigens increase with red cell age | |
| JP2005505755A (en) | Cat blood type determination method and determination kit | |
| CA2138594C (en) | Process for preparing clear sera which are stable over a long period | |
| Valbonesi et al. | Two further examples of IgG thimerosal-dependent antibodies and their serological characteristics | |
| JP3166764B2 (en) | Rapid measurement of trace components | |
| Branch | Blood transfusion in autoimmune hemolytic anemias | |
| Wenz et al. | Improved method for detecting hemagglutination by centrifugal analysis. | |
| Boyle | Immunochemical studies of mammalian cell membranes | |
| JPH10260187A (en) | Measuring method and measuring reagent for antibody specific to common antigen determinant of antigen in which a plurality of subtype exists | |
| Gowland | Antibodies in delayed-type hypersensitivity | |
| Telen et al. | Evidence that several high-frequency human blood group antigens |
Legal Events
| Date | Code | Title | Description |
|---|---|---|---|
| AK | Designated states |
Kind code of ref document: A1 Designated state(s): AE AG AL AM AT AU AZ BA BB BG BY BZ CA CH CN CO CR CU CZ DE DM DZ EC EE ES FI GB GD GE GH HR HU ID IL IN IS JP KE KG KP KR LC LK LR LS LT LU LV MA MD MG MN MW MX MZ NO NZ OM PH PL PT RU SD SE SG SI SK SL TJ TM TN TR TZ UA UG US UZ VC VN YU ZA ZM |
|
| AL | Designated countries for regional patents |
Kind code of ref document: A1 Designated state(s): GH GM KE LS MW MZ SD SL SZ UG ZM ZW AM AZ BY KG KZ RU TJ TM AT BE BG CH CY CZ DK EE ES FI FR GB GR IE IT LU MC PT SE SK TR BF BJ CF CG CI GA GN GQ GW ML MR NE SN TD TG |
|
| DFPE | Request for preliminary examination filed prior to expiration of 19th month from priority date (pct application filed before 20040101) | ||
| 121 | Ep: the epo has been informed by wipo that ep was designated in this application | ||
| WWE | Wipo information: entry into national phase |
Ref document number: 161341 Country of ref document: IL |
|
| WWE | Wipo information: entry into national phase |
Ref document number: 2463693 Country of ref document: CA |
|
| WWE | Wipo information: entry into national phase |
Ref document number: 2003536757 Country of ref document: JP Ref document number: 20028205251 Country of ref document: CN |
|
| WWE | Wipo information: entry into national phase |
Ref document number: 2002780208 Country of ref document: EP |
|
| WWE | Wipo information: entry into national phase |
Ref document number: 2002343279 Country of ref document: AU |
|
| WWE | Wipo information: entry into national phase |
Ref document number: 200400553 Country of ref document: EA |
|
| WWP | Wipo information: published in national office |
Ref document number: 2002780208 Country of ref document: EP |
|
| WWE | Wipo information: entry into national phase |
Ref document number: 10492863 Country of ref document: US |