US8051162B2 - Data assurance in server consolidation - Google Patents
Data assurance in server consolidation Download PDFInfo
- Publication number
- US8051162B2 US8051162B2 US11/495,365 US49536506A US8051162B2 US 8051162 B2 US8051162 B2 US 8051162B2 US 49536506 A US49536506 A US 49536506A US 8051162 B2 US8051162 B2 US 8051162B2
- Authority
- US
- United States
- Prior art keywords
- data
- input
- predetermined
- trace
- missing
- Prior art date
- Legal status (The legal status is an assumption and is not a legal conclusion. Google has not performed a legal analysis and makes no representation as to the accuracy of the status listed.)
- Active, expires
Links
Images


Classifications
-
- G—PHYSICS
- G06—COMPUTING; CALCULATING OR COUNTING
- G06F—ELECTRIC DIGITAL DATA PROCESSING
- G06F11/00—Error detection; Error correction; Monitoring
- G06F11/30—Monitoring
- G06F11/34—Recording or statistical evaluation of computer activity, e.g. of down time, of input/output operation ; Recording or statistical evaluation of user activity, e.g. usability assessment
- G06F11/3452—Performance evaluation by statistical analysis
-
- G—PHYSICS
- G06—COMPUTING; CALCULATING OR COUNTING
- G06F—ELECTRIC DIGITAL DATA PROCESSING
- G06F11/00—Error detection; Error correction; Monitoring
- G06F11/30—Monitoring
- G06F11/34—Recording or statistical evaluation of computer activity, e.g. of down time, of input/output operation ; Recording or statistical evaluation of user activity, e.g. usability assessment
- G06F11/3409—Recording or statistical evaluation of computer activity, e.g. of down time, of input/output operation ; Recording or statistical evaluation of user activity, e.g. usability assessment for performance assessment
-
- G—PHYSICS
- G06—COMPUTING; CALCULATING OR COUNTING
- G06F—ELECTRIC DIGITAL DATA PROCESSING
- G06F11/00—Error detection; Error correction; Monitoring
- G06F11/30—Monitoring
- G06F11/34—Recording or statistical evaluation of computer activity, e.g. of down time, of input/output operation ; Recording or statistical evaluation of user activity, e.g. usability assessment
- G06F11/3466—Performance evaluation by tracing or monitoring
- G06F11/3476—Data logging
-
- H—ELECTRICITY
- H04—ELECTRIC COMMUNICATION TECHNIQUE
- H04L—TRANSMISSION OF DIGITAL INFORMATION, e.g. TELEGRAPHIC COMMUNICATION
- H04L41/00—Arrangements for maintenance, administration or management of data switching networks, e.g. of packet switching networks
- H04L41/06—Management of faults, events, alarms or notifications
- H04L41/0681—Configuration of triggering conditions
-
- H—ELECTRICITY
- H04—ELECTRIC COMMUNICATION TECHNIQUE
- H04L—TRANSMISSION OF DIGITAL INFORMATION, e.g. TELEGRAPHIC COMMUNICATION
- H04L41/00—Arrangements for maintenance, administration or management of data switching networks, e.g. of packet switching networks
- H04L41/50—Network service management, e.g. ensuring proper service fulfilment according to agreements
- H04L41/5003—Managing SLA; Interaction between SLA and QoS
- H04L41/5009—Determining service level performance parameters or violations of service level contracts, e.g. violations of agreed response time or mean time between failures [MTBF]
-
- H—ELECTRICITY
- H04—ELECTRIC COMMUNICATION TECHNIQUE
- H04L—TRANSMISSION OF DIGITAL INFORMATION, e.g. TELEGRAPHIC COMMUNICATION
- H04L43/00—Arrangements for monitoring or testing data switching networks
- H04L43/08—Monitoring or testing based on specific metrics, e.g. QoS, energy consumption or environmental parameters
-
- H—ELECTRICITY
- H04—ELECTRIC COMMUNICATION TECHNIQUE
- H04L—TRANSMISSION OF DIGITAL INFORMATION, e.g. TELEGRAPHIC COMMUNICATION
- H04L43/00—Arrangements for monitoring or testing data switching networks
- H04L43/10—Active monitoring, e.g. heartbeat, ping or trace-route
- H04L43/106—Active monitoring, e.g. heartbeat, ping or trace-route using time related information in packets, e.g. by adding timestamps
-
- H—ELECTRICITY
- H04—ELECTRIC COMMUNICATION TECHNIQUE
- H04L—TRANSMISSION OF DIGITAL INFORMATION, e.g. TELEGRAPHIC COMMUNICATION
- H04L67/00—Network arrangements or protocols for supporting network services or applications
- H04L67/01—Protocols
- H04L67/10—Protocols in which an application is distributed across nodes in the network
- H04L67/1001—Protocols in which an application is distributed across nodes in the network for accessing one among a plurality of replicated servers
- H04L67/1004—Server selection for load balancing
- H04L67/1008—Server selection for load balancing based on parameters of servers, e.g. available memory or workload
-
- H—ELECTRICITY
- H04—ELECTRIC COMMUNICATION TECHNIQUE
- H04L—TRANSMISSION OF DIGITAL INFORMATION, e.g. TELEGRAPHIC COMMUNICATION
- H04L67/00—Network arrangements or protocols for supporting network services or applications
- H04L67/01—Protocols
- H04L67/10—Protocols in which an application is distributed across nodes in the network
- H04L67/1001—Protocols in which an application is distributed across nodes in the network for accessing one among a plurality of replicated servers
- H04L67/1004—Server selection for load balancing
- H04L67/1012—Server selection for load balancing based on compliance of requirements or conditions with available server resources
-
- G—PHYSICS
- G06—COMPUTING; CALCULATING OR COUNTING
- G06F—ELECTRIC DIGITAL DATA PROCESSING
- G06F11/00—Error detection; Error correction; Monitoring
- G06F11/30—Monitoring
- G06F11/34—Recording or statistical evaluation of computer activity, e.g. of down time, of input/output operation ; Recording or statistical evaluation of user activity, e.g. usability assessment
- G06F11/3466—Performance evaluation by tracing or monitoring
- G06F11/3495—Performance evaluation by tracing or monitoring for systems
-
- G—PHYSICS
- G06—COMPUTING; CALCULATING OR COUNTING
- G06F—ELECTRIC DIGITAL DATA PROCESSING
- G06F2201/00—Indexing scheme relating to error detection, to error correction, and to monitoring
- G06F2201/81—Threshold
-
- G—PHYSICS
- G06—COMPUTING; CALCULATING OR COUNTING
- G06F—ELECTRIC DIGITAL DATA PROCESSING
- G06F2201/00—Indexing scheme relating to error detection, to error correction, and to monitoring
- G06F2201/835—Timestamp
-
- G—PHYSICS
- G06—COMPUTING; CALCULATING OR COUNTING
- G06F—ELECTRIC DIGITAL DATA PROCESSING
- G06F2201/00—Indexing scheme relating to error detection, to error correction, and to monitoring
- G06F2201/88—Monitoring involving counting
-
- H—ELECTRICITY
- H04—ELECTRIC COMMUNICATION TECHNIQUE
- H04L—TRANSMISSION OF DIGITAL INFORMATION, e.g. TELEGRAPHIC COMMUNICATION
- H04L43/00—Arrangements for monitoring or testing data switching networks
- H04L43/02—Capturing of monitoring data
- H04L43/022—Capturing of monitoring data by sampling
-
- H—ELECTRICITY
- H04—ELECTRIC COMMUNICATION TECHNIQUE
- H04L—TRANSMISSION OF DIGITAL INFORMATION, e.g. TELEGRAPHIC COMMUNICATION
- H04L67/00—Network arrangements or protocols for supporting network services or applications
- H04L67/01—Protocols
- H04L67/10—Protocols in which an application is distributed across nodes in the network
- H04L67/1001—Protocols in which an application is distributed across nodes in the network for accessing one among a plurality of replicated servers
- H04L67/1029—Protocols in which an application is distributed across nodes in the network for accessing one among a plurality of replicated servers using data related to the state of servers by a load balancer
Definitions
- information technology encompasses all forms of technology, including but not limited to the design, development, installation, and implementation of hardware and software information systems and software applications, used to create, store, exchange and utilize information in its various forms including but not limited to business data, conversations, still images, motion pictures and multimedia presentations technology and with the design, development, installation, and implementation of information systems and applications.
- a server is a computer or network of computers. Examples of a server include but are not limited to one or more desktop computers, one or more laptop computers, one or more mainframe computers, one or more networked computers, one or more processor-based devices, or any similar types of systems and devices.
- a server includes one or more processors of any of a number of computer processors, such as processors from Intel, Motorola, AMD, Cyrix. Each processor is coupled to or includes at least one memory device, such as a computer readable medium (CRM).
- the processor is operable to execute computer-executable program instructions stored in the CRM, such as program code of applications, to run the applications.
- the computer-executable program instructions include code from any suitable computer-programming language, such as C, C++, C#, Java, or the like.
- Embodiments of a CRM include, but are not limited to, an electronic, optical, magnetic, or other storage or transmission device capable of providing a processor of the server with computer-readable instructions.
- Other examples of a suitable CRM include, but are not limited to, a floppy disk, CD-ROM, DVD, magnetic disk, memory chip, ROM, RAM, an ASIC, a configured processor, any optical medium, any magnetic tape or any other magnetic medium, or any other medium from which a computer processor can read instructions.
- FIG. 1 illustrates a high-level architecture 100 for server consolidation, in accordance with one embodiment.
- FIG. 2 illustrates a data aggregation module that is applicable in the architecture 100 depicted FIG. 1 , in accordance with one embodiment.
- FIG. 3 illustrates a possible timing problem in server consolidation, in accordance with one embodiment.
- FIG. 4 illustrates a process flow for data assurance rules, in accordance with one embodiment.
- FIG. 5 illustrates Stage 1 of the process flow depicted in FIG. 4 , in accordance with one embodiment.
- FIG. 6 illustrates an example of a time stamp offset, in accordance with one embodiment.
- FIGS. 7A-B illustrate Stage 2 of the process flow depicted in FIG. 4 , in accordance with one embodiment.
- FIG. 8 illustrates an example of a time difference between an actual time stamp in an input trace and a time stamp in an expected output trace, in accordance with one embodiment.
- FIG. 9 illustrates an example of CPU utilization, in accordance with one embodiment.
- FIG. 10 illustrates Stage 3 of the process flow depicted in FIG. 4 , in accordance with one embodiment.
- FIGS. 11A-E illustrates Stage 4 of the process flow depicted in FIG. 4 , in accordance with one embodiment.
- consolidation recommendations are empirically driven, and they typically are based on a large amount of data as aforementioned. For example, it is possible to have consolidation recommendations that are based on recording the values of 8 performance metrics for 1000 systems for 2 months at 5-minute intervals (over 100 million values). Due to the large amount of data involved, it is very inefficient for users to manually and consistently check the monitored data, correct any problems with the data, and assess the overall quality of such data.
- users are IT consultants, IT managers, system administrators, or any other entities that are interested in consolidating servers, rebalancing workloads of the servers, or planning future server capacity.
- Described herein are methods and systems for automatically detecting a number of imperfections in the monitoring of data about usage patterns of the computing resources, correcting the imperfections, and quantifying their impact on a consolidation analysis to thereby improve the quality of recommendations for server consolidation in a desired IT environment, and hence, the trust placed in such recommendations. Also described herein are embodiments that allow users to diagnose performance issues with existing IT systems, whereby such large-scale diagnosis is helpful in identifying important system configurations.
- a server consolidation tool that is operable with any data collectors, wherein it is possible to conduct data analyses in the user's environment.
- a server consolidation tool is provided to the user with a combined checklist (or summary) and navigator with a graphical user interface (GUI) to enable the user to achieve server consolidation with the desired quality and consistency.
- GUI graphical user interface
- Other embodiments offer users a high degree of flexibility in server consolidation by allowing the users to skip steps, come back to a step, choose a singular or plural forms (for example, in one or more selected groups of servers, scenarios, and consolidation constraints), and select numerous options and choices in the process.
- Users are also offered choices in defining groups and scenarios, designating or marking servers with one of a plurality of usability statuses to indicate how each marked server is to be used in the server consolidation.
- the usability statuses include a Replace status, a Reuse status, an Undecided (or don't know) status, and an Unchanged (or don't touch) status, as described later.
- users are offered choices in articulating consolidation constraints and many other key elements of the analysis, as also described later.
- the user gets results back through reports.
- the user has direct access to data in a repository for data mining and creating further reports.
- users are IT consultants, IT managers, system administrators, or any other entities that are interested in consolidating servers, rebalancing workloads of the servers, planning future server capacity, or providing server consolidation services with any combination of the first three.
- FIG. 1 illustrates a high-level system architecture 100 for server consolidation in accordance with one embodiment.
- one or more data collectors are employed for the data collection module 110 .
- a data collector is one or more software programs, applications, or modules. The data collectors are used to discover and inventory those servers within a desired environment that need to be consolidated and to collect raw performance data of such source servers (hereinafter, “source servers”).
- source servers For example, a desired environment is the entire information technology (IT) infrastructure of a company, and the servers that are detected and inventoried are those that are parts of or belong to such IT infrastructure.
- IT information technology
- any known data collector or collectors for the data collection module 110 because of the flexibility of the server consolidation architecture 100 to independently operate with any and all data collectors, so long as the collected data is collected appropriately by the data collector for input into the server consolidation tool.
- Examples of possible data collectors include but are not limited to: HP ASSET and OPENVIEW softwares from Hewlett Packard Company of Palo Alto, Calif., BMC DISCOVERY EXPRESS from BMC Software, Inc. of Houston, Tex.; and those data collectors available in the AOG CAPACITYPLANNER software and CDAT software from IBM Corporation of Amonk, N.Y.
- the inventory 114 of the source servers and the raw performance data 112 are processed separately, wherein the raw performance data 112 is subjected to processing by the data assurance module 120 to generate clean performance data 122 , and the server inventory 114 is subjected to processing by server categorization module 130 .
- data assurance is automatically performed by the data assurance module 120 , which is one or more software programs, applications, or modules having computer-executable program instructions that include code from any suitable computer-programming language, such as C, C++, C#, Java, or the like.
- data assurance is performed manually by a user reviewing the collected raw performance data based on predefined data assurance rules (for example, specifying data conditions that are considered abnormal performance) and deciding to include or exclude servers in the consolidation based on data or performance issues gathered from the review.
- predefined data assurance rules for example, specifying data conditions that are considered abnormal performance
- the clean performance data 122 is collected, it is fed to the consolidation engine 140 .
- the clean performance data 122 is saved in an accessible storage space, such as a database, for access by the consolidation engine 140 as required or desired.
- the data assurance module 120 is further described later.
- the server inventory 114 is processed for further categorization to generate a categorized server inventory 132 .
- the server categorization module 130 is performed by one or more categorization software programs, applications, or modules 131 , wherein the user is provided with a graphical user interface (GUI) 133 to select predetermined fields of criteria or filters for the server categorization or fill in additional categorization fields as desired or needed for the server categorization.
- GUI graphical user interface
- the criteria or filters for server categorization are potentially determined by the user and based on, for example, server characteristics such as server location, functionality, environment, specification, or any combination thereof.
- the GUI 133 is operable to allow the user to select individual servers from a list in the server inventory 114 .
- those tasks or functions performed by the server categorization 130 are performed by the underlying categorization software application; whereas, any interactions between server categorization module 130 and users are done via the GUI 133 .
- target servers data module 180 data relating to the user-selected target platform for new servers to be used for server consolidation (hereinafter, “target server” or “consolidated server”) is generated.
- a target platform is the underlying hardware, and associated software, used to implement a server.
- the target platform is, for example, a particular type of computer or type(s) of network of computers used to implement the server.
- the target servers data module 180 includes one or more software programs, applications, or modules 181 , wherein the user is provided with a GUI 183 to allow the user to select a target hardware or platform from a list of candidate server models, available from one or more server manufacturers, for new servers to be used in the server consolidation.
- the user relies on automated, predetermined policies, as programmed in the software application 181 , to select a target platform based on the user's input of one or more conditions or specifications. For example, the user specifies one or more criteria for selecting a target platform, such as selecting a target platform based on power specifications.
- the selected target platform and its characteristics are output as the target servers data 150 .
- the GUI 183 of the target servers data module 180 is integrated with the GUI 143 of the consolidation engine 140 . Alternatively, the GUI 183 is separate and distinct from the GUI 143 .
- the clean performance data 122 , the categorized server inventory data 132 , and the target servers data 150 are fed into a consolidation engine 140 , which is used to further define and analyze a proposed server consolidation scenario, as will be described later.
- the consolidation engine 140 includes a scenario selection module 145 and a consolidation analysis module 147 that interface with users via a GUI 143 .
- each of the modules 145 and 147 includes one or more software programs, applications, or modules.
- the GUI 143 is menu-based or screen-based to display different menus or screens (for example, web pages) to allow different inputs from users for various server consolidation tasks performed by the underlying modules 145 and 147 .
- the GUI 143 is operable to allow the user to select a particular consolidation algorithm and set optional input parameters with the selected algorithm such as the initial number of new servers.
- those tasks or functions performed by the consolidation engine 140 are performed by the underlying modules 145 and 147 , and any interactions between the consolidation engine 140 and users are done via the GUI 143 .
- the server consolidation tasks are further described below.
- the results of the consolidation analysis is output from consolidation engine 140 to a report software module 160 for the generation of reports for the user to review.
- the results are also saved in a consolidation central repository 170 , such as a CRM, for future reference.
- the server consolidation process and tasks are further described in the aforementioned U.S. application Ser. No. 11/412,347, which is herein incorporated by reference in its entirety.
- the quality of the monitored raw performance data 112 is assessed to determine whether such data is of sufficient quality for use in a consolidation analysis.
- This quality assessment includes the use of the data assurance module 120 to clean the raw performance data 112 of the source servers.
- the data assurance module (DAM) 120 is desirable because, as mentioned earlier, in practice a number of imperfections exist in the collected raw performance data 112 , and such imperfections affect the quality of consolidation analyses and recommendations.
- the data assurance module 120 implements a set of error rules, or data assurance rules, for checking and correcting the monitored data 112 and assessing its quality before such data is used for a consolidation analysis.
- the error rules check the monitored data for a predefined set of imperfections, correct at least some of the monitored data, assess the quality of the monitored data, and generate recommendations as to whether it is of sufficient quality to use in a consolidation analysis.
- the aforementioned error rules and the order in which they are applied to the monitored data are described below, wherein the monitored data is extracted from the monitored computing resources into a data file for processing.
- the monitored data is first saved in a database, whereby the monitored data 112 potentially represents such a database, from which the monitored data is subsequently retrieved for processing by the data assurance module 120 .
- the monitored data is represented as a time series with rows (T i , a 1i , a 2i , . . . , a ni ) for each source server, where T i is the time stamp for time interval i, and a 1i , a 2i , . . . , a ni are the corresponding values of the desired performance metrics at time interval i.
- T i is the time stamp for time interval i
- a 1i , a 2i , . . . , a ni are the corresponding values of the desired performance metrics at time interval i.
- an error-free time series hereinafter referred to as a “trace,” has monotonically or linearly increasing time stamps that are separated by a constant time increment or time step, for example, five (5) minutes.
- the monitored data is represented as chronologically-ordered sequences of the monitored data rather than time series.
- each set of data is not separated by a constant time increment T i .
- a chronologically-ordered sequence can be represented by (a, b, c, d, e, f, . . . ), where a, b, c, d, e are chronologically-ordered (in time) sequence of performance metrics, such as a log of events.
- the monitored data is represented as multiple chronologically-ordered sequences, or multiple logs of events, with the logs not separated by a time constant T i but by the necessary time it takes to accumulate such log.
- the data assurance module (DAM) 120 receives an input trace of each server from the monitored raw performance data 112 , processes the input trace to check for imperfections and correct at least one or more such imperfections, and produces a corresponding output trace as clean performance data 122 .
- All output traces have the same sequence of time stamps, T 1 , T 2 , . . . , T m , that is, all output traces have the same time base.
- Each data row in the output trace is expected to have a time stamp that is greater than the time stamp of the preceding row by a constant amount.
- the value of Trace_DataRowInterval is provided as part of the metadata in the monitored raw performance data 112 and verified by the above equation. Alternatively, when such a value is not provided, the most common interval in a trace is chosen as the nominal value for Trace_DataRowInterval.
- the error rules as implemented by the DAM 120 are based on an understanding of the various different data collection problems and imperfections that may be encountered in data collection. These rules then can be uniformly applied by any user, whether or not such a user is familiar with the various different data collection problems that rules seek to address. Thus, it is important to determine these problems and imperfections prior to crafting appropriate error rules to address such problems and imperfections. For instance, a number of data collection problems arise from timing problems in the data collection process. In turn, these timing problems are related to either the local time on each server from which performance data is collected or the way in which such data is collected. Such timing problems impact the consolidation analysis by the consolidation engine 140 in a number of ways, as discussed below. Embodiments of error rules for addressing these timing problems are also discussed below.
- data aggregation module (hereinafter, “data aggregator”) 210 , which pulls or retrieves performance data from the data collection module 110 and stores such data in a database.
- the data aggregator 210 is operable to query each server for its local time when it retrieves the input trace from the server, and rewrites the time stamps, T i , in the input trace, factoring out the difference T in time stamps.
- Timing problems There are a number of possible timing problems relating to the way in which performance data of servers is collected.
- One of such timing problems results from a data collector in the data collection module 110 time-stamping the input traces with the local time and not a universal time zone, such as Greenwich Mean Time (GMT).
- GTT Greenwich Mean Time
- Another possible timing problem relating to data collection occurs when there are multiple data collectors in the data collection module 110 being used to collect performance data from multiple servers, and there is no agreement among the data collectors about the time to assign to the data rows in a trace.
- the modulus or mod(time-stamp-for-first-data-row, Sampling Interval) is not a global constant, where Sampling Interval is the expected time between samples in each input trace, regardless whether the local clocks at the servers are synchronized.
- this timing problem is ignored and the time stamps are rewritten.
- the time stamps for the second data collector are rewritten from 12:07 PM to 12:05 PM, 12:12 PM to 12:10 PM, and so on.
- each of the input traces is sampled using the output trace's expected series of time stamps, and the maximum data value within each sample window is set as the performance data collected at that particular time interval.
- Still another possible timing problem relating to data collection occurs when the time between samples for a given server is not constant, one or more servers use a sampling interval that is not equal to Trace_DataRowInterval, or both.
- This timing problem potentially occurs because of a bug in a given data collector, the way in which it is designed to operate, or because the load on the system under study is such that the data collector cannot always run at the programmed desired intervals.
- Consolidation analysis at the consolidation engine 140 is affected because, as mentioned earlier, the output traces of all servers are expected to have the same time base.
- One solution to this particular timing problem is to rewrite the time stamps and reject any resulting extra rows.
- Another solution is to sample each input trace using the output trace's expected series of time stamps, and take the maximum value within each sample window as the performance data collected at that particular time interval, as again shown in FIG. 3 .
- Other solutions linear interpolations, extrapolation, etc. may be used to rewrite the trace.
- the process 400 is potentially performed by users who are, for example, in-house IT personnel in an organization wishing to consolidate the organization's IT assets, IT consultants providing consolidation services to their customers, or a combination of both in-house IT personnel and outside IT consultants.
- the data assurance rules are organized into four stages.
- Stage 1 , 410 the data structure of each input trace is evaluated and checked before any data rows therein are examined.
- Stage 2 , 420 predetermined time stamp rules, other checks, and statistics computation are applied to each input trace that comes out of Stage 1 .
- Stage 3 , 430 data is created or generated to fill in any missing data rows of each input trace that comes out of Stage 2 .
- Stage 4 , 440 the data quality of each input trace that comes out of Stage 3 is further evaluated.
- Stages 1 - 4 are further described below, with references to additional figures in the present application. Stages 1 - 4 can be performed in succession (for example, to reduce the required computational power) or concurrently (for example, to improve efficiency by reducing time required to perform data assurance).
- FIG. 5 illustrates a process flow 500 that provides further details of Stage 1 shown in FIG. 4 , in accordance with one embodiment.
- the metadata or meta information of each input trace is checked or verified to ensure that there are no unexpected problems. For example, a check is made to ensure that a field, such as a time zone, is in a specified format and valid, and the descriptions of the performance metrics contained in the trace are valid descriptions. In other words, the meta information is checked to make sure that each input trace is structured correctly and includes specified types of data.
- each input trace is checked for missing performance metrics, for example, by checking the metadata in the raw performance data 112 to determine if all the required or desired metrics for use in server consolidation are listed therein and consequently their values are supposed to be found in each trace.
- a source server is excluded in the server consolidation analysis, that is, marked with “Unchanged”, when its trace is missing at least one required performance metric. For each required performance metric that is missing data, an error message is created.
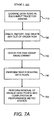
- FIG. 7A illustrates further details of Stage 2 shown in FIG. 4 , in accordance with one embodiment.
- the goal of this stage is to examine and process each input trace for a given server and to produce an intermediate version of the output trace.
- Stage 2 is applied in a single pass through the data in the input trace.
- the data rows in each input trace are first examined for errors. If an error occurs when reading a data row, the examination of such data row is stopped, a fatal error is recorded, and the server from which the input trace originates is excluded.
- An example of this type of error is that there are too few fields in the current data row. In other words, a metric value is missing or there is no data for one or more required performance metric.
- the term “no data” herein refers to a lack of any data value for the particular performance metric. Thus, a performance metric has a data value even when such data value is NULL or zero.
- the DAM 120 examines the data rows (i.e., each time T i ) in each input trace to check, report, and delete those rows that are out of order.
- the time stamp of each data row is checked to see if it is less than the time stamp of an adjacent previous data row. If the time stamp of a current data row is indeed less than the time stamp of an adjacent previous data row, the current row is deemed to be out of order. An informational message is then generated to report the current row as being out of order, and the row is deleted. Otherwise, no reporting or row deletion is performed.
- time stamp misalignment is checked, wherein the time stamps for the data rows in each input trace are checked against those time stamps defined by the predetermined time base in the expected output trace.
- the DAM 120 is to: (a) align and rewrite the actual time stamps of each input trace to the time base of the expected output trace; or (b) construct a new input trace by resampling the old input trace.
- align and rewrite the actual time stamps each of such time stamps is rewritten to the nearest time stamp in the expected time series of the output trace. The rewriting is operable to position a data row earlier in time than is indicated by its actual (original) time stamp, as shown, for example, in row 5 of Table 1.
- the aforementioned resampling scheme is used to construct a new input trace.
- the time stamps are rewritten as also aforementioned, trading implementation simplicity for a potential reduction in accuracy.
- the DAM 120 performs a test for any extra data rows in an input trace using the aligned time stamps that are output from 730 above.
- the algorithm for the extra-data-row test is described in Table 2 with examples from Table 1 to further elaborate its operation.
- the DAM 120 next performs a removal of invalid data points and computation of statistics used in step 440 to evaluate the quality of the data trace.
- some of the evaluation statistics are computed prior to the removal of invalid data points, while others are computed afterwards because such removal potentially affects some of the statistics.
- the removal of invalid data points and computation of performance metric statistics are now described with reference to FIG. 7B .
- the DAM 120 checks for invalid data points by comparing the actual value of a performance metric to the expected minimum and maximum values, as found in the metadata included in the raw performance data 112 , for the performance metric.
- the DAM 120 computes a summation used to evaluate whether a performance metric a is missing from an input trace.
- the summation assigns a value of 1 for each data row that the performance metric a has a NULL value sums up the number of 1's to generate a value called NumMetricDataPointNull(a). This value is compiled incrementally, one data row at a time.
- the summation assigns a value of 1 for each data row that the performance metric a has a value other than a Null value and sums up the number of 1's to generate a value called NumMetricDataPoint(a).
- the Null value is represented by some predetermined character, indicator, or value other than a zero. Accordingly, the NumMetricDataPointNull and NumMetricDataPoint values are computed for each metric as follows.
- the DAM 120 reports an error message indicating the outlier problem (including information about the server, time stamp, metric, actual value, comparison value, ⁇ min, or >max):
- the actual value is set to the minimum value. Likewise, if the metric value is greater than the maximum value predetermined for the metric, the actual value is set to the maximum value.
- 7410 - 7460 describe a detection scheme and 7470 describes a correction scheme. Alternative embodiments are contemplated, however, wherein for the correction scheme in 7470 any actual metric value outside the predetermined range is set to a predetermined value, such as zero.
- a histogram in essence counts the number of times a given metric value appears in the trace (e.g., how many times the value of the metric XYZ equals to 5).
- CPU utilization which is typically expressed as a percentage between 0 and 100%. If a particular CPU utilization value is 100%, there is no knowledge of whether the application running on the system could have used more CPU resources if a more powerful CPU was in the system.
- a key premise of the server consolidation is that the past behavior of a workload is an indication of its future behavior on a more powerful system.
- a monitored high metric value could be an indication that the input data does not provide an accurate reflection of the past behavior.
- the user should be made aware of the above per-metric threshold problems. If a sufficient number of those problems occur, the DAM 120 can recommend that the server not be included, as further described in Stage 4 below.
- FIG. 10 illustrates further details of Stage 3 as described below.
- the DAM 120 calculates a time difference between each data row and a previous one in the input trace, starting with the second data row in a trace.
- Stage 3 uses the output generated by Stage 2 , and assumes that the time stamps of successive rows monotonically increase.
- the DAM 120 determines whether the calculated time difference is greater than Trace_DataRowInterval. If no, the DAM 120 proceeds to 870 for another data row in the trace, as described later.
- the DAM 120 generates an error message indicating the begin and end times of the missing rows and the number of missing rows.
- the DAM 120 proceeds to create artificial data for the metrics in each missing row in accordance with one of many possible embodiments. For example, in one embodiment, the DAM 120 determines whether the time difference is also less than a predetermined value called MissingDataInterval_InterpolateThreshold? If it is, the DAM 120 applies linear interpolation to create the metrics in the missing row, using as the start and end points the metric value of the previous existing data row and the current data row.
- the reason for this threshold is that some techniques are to be used only in certain situations. For example, if there are two missing observations (5 minute), linear interpolation is one possible technique. However, if one day of data is missing, linear interpolation may not be a good technique.
- the DAM 120 uses the most popular value, that is, the statistical mode value, which is a “bucket” in the “Histogram of data values (a)”, as described earlier, that contains the greatest count. If the bucket corresponds to more than one value, then, for example, the mid-point value is used.
- an error message is generated if more than this number of rows are missing in succession. For example, if the threshold is 10 and there is gap where 3 rows are missing, an error message is not generated. However, if 13 consecutive rows are missing, an error message is generated.
- the conditional determination for the aforementioned Missing Rows is further described with reference to Stage 4 , FIG. 11B , later.
- the process from 810 through 860 is iterated for each data row until there is no data row left in the trace, at which point, the DAM 120 proceeds to 880 .
- Missing Rows Missing Rows+(“number of missing data rows”/MissingRows_ConsecutiveRowsThreshold);
- Stage 4 further evaluates the data quality of the trace produced in Stage 2 (with created data from Stage 3 ).
- Stage 4 is executed once for each server.
- data quality evaluation in Stage 4 includes a number of separate rules, as illustrated in FIGS. 11A-E and described below.
- FIG. 11A illustrates the first rule in Stage 4 for evaluating missing metrics.
- required metrics are those metrics without which server consolidation cannot be performed.
- optional metrics are those metrics not required for server consolidation, but with which server consolidation can be further improved.
- the required metrics include, for example, CPU utilization & Memory residency, while the optional ones include CPU queue, paging, disk busy, disk queue, network bytes.
- the DAM 120 determines whether the metric is required and the % Ratio is greater than the predetermined value, MissingMetricValues_PercentThreshForReq. In other words, if more than a given percentage of the metric values of a source server are missing for a required metric, such a server is not to be included in a consolidation scenario. A different threshold value is used for the required and optional metrics. If yes, at 930 A, the DAM 120 generates an error message detailing the finding and excludes the server, that is, marking the server as “Unchanged.” If no, at 940 A, the DAM 120 proceeds to the next metric and makes the same determination.
- the DAM 120 determines whether the metric optional, and the % Ratio is greater than the predetermined value, MissingMetricValues_PercentThreshForOpt? (threshold value for the optional metrics). If yes, at 960 A, the DAM 120 again generates an error message detailing the finding but now recommends to the user to exclude the server, that is, marking the server as “Unchanged.” If no, at 970 A, the DAM 120 proceeds to the next metric and makes the same determination.
- the DAM 120 proceeds to the second rule, as illustrated in FIG. 11B , for evaluating missing rows.
- the DAM 120 determines whether the missing rows (as calculated at 860 in FIG. 10 ) are greater than a predetermined MissingRows_ErrorThreshold. If yes, at 920 B, the DAM 120 generates an error message with the number of missing rows, suggests to the user to exclude the server, and asks the user to decide on server exclusion. If no, at 930 B, the DAM 120 proceeds to the Third Rule.
- FIG. 11C illustrates the third rule of Stage 4 .
- the DAM 120 determines whether the number of Extra Rows (as calculated in FIG. 7B ) is greater than the predetermined value, ExtraRows_ErrorThreshold. If yes, at 920 C, the DAM 120 generates an error message and excludes the server (that is, marked as Unchanged), and the user cannot override this action. If no, at 930 C, the DAM 120 proceeds to the fourth Rule.
- FIG. 11D illustrates the fourth rule of Stage 4 , which is a test for invalid data points for each metric.
- the DAM 120 determines the percentage of outliers with the following computation: 100 ⁇ invalidDataPoints( a )/NumMetricDataPoints( a ), and also determines whether the % of outliers is greater than the predetermined value, InvalidDataPoints_PercentThreshold. If yes, at 920 D, the DAM 120 generates an error message and excludes the server, and the user cannot override this action. If no, at 930 D, the DAM 120 continues with the next metric until all of the metrics are evaluated by this rule before proceeding with the fifth rule of Stage 4 .
- FIG. 11E illustrates the fifth rule of Stage 4 , wherein the DAM 120 checks for latent demand. For each metric, at 910 E, the DAM 120 computes the percentage of data points over a predetermined threshold, that is, 100 ⁇ NumAboveThresholdDataPoints( a )/NumMetricDataPoints( a ), and determines whether such a percentage is greater than a predetermined percentage value, LatentDemandTestDurationThreshold.
- the DAM 120 creates an error message indicating the latent demand, suggests the user to exclude the server, shows the time series (plot actual values only using change value approach), shows histogram (create bands and show number of actual data points and % distribution), and ask the user to decide on the server exclusion. If no, at 930 E, the DAM 120 continues with the next metric until metrics are evaluated by this rule.
Abstract
Description
Trace_DataRowInterval=T i −T i−1.
In one embodiment, the value of Trace_DataRowInterval is provided as part of the metadata in the monitored
Time stamp offset=InputTrace_BeginTime_31 OutputTrace_BeginTime;
-
- at the beginning;
-
- data at the beginning.
It should be noted that OutputTrace_BeginTime and OutputTrace_EndTime are based on the specified interval of time desired for the consolidation analysis.FIG. 6 illustrates an example wherein the InputTrace_BeginTime is later than the OutputTrace_BeginTime to generate a Time stamp offset.
- data at the beginning.
Δ=|actual time stamp−expected time stamp in the output trace|;
-
- Otherwise, reject the data row, report alignment error, and add one to the count
- the number of alignment errors (or rejected data rows), and an entry in
- the error log is added to indicate this particular occurence.
FIG. 8 illustrates an example of a Δ value to show a possible discrepancy between an input trace and the expected output trace.
- Otherwise, reject the data row, report alignment error, and add one to the count
| TABLE 1 | ||||
| Time stamps in the | ||||
| Table | Time stamps in | expected output | ||
| Row | the input | trace | Comments | |
| 1 | 11:00 | There is no data in the | ||
| input trace to map to | ||||
| this interval in the | ||||
| trace | ||||
| 2 | 11:33 | 11:35 | | |
| trace | ||||
| 3 | 11:38 | 11:40 | |
|
| 4 | 11:43 | 11:45 | |
|
| 5 | 11:46 | 11:45 | This data row in the | |
| input trace is to be | ||||
| marked as an “extra | ||||
| row” because |
||||
| 3 was mapped to the | ||||
| same time stamp | ||||
| 6 | 11:50 | No data in the input | ||
| trace is mapped to this | ||||
| interval in the output | ||||
| trace | ||||
| 7 | 11:54 | 11:55 | Data row 5 | |
| 8 | 11:58 | 12:00 | Data row 6 | |
| 9 | 12:03 | 12:05 | Data row 7 | |
0.18*(00:07−0:05)/(00:10−00:05)+0.23*(00:10−00:07)/(00:10−00:05)=0.18*0.4+0.23*0.6=0.21.
In other words, the new value for CPU utilization over the new interval that matches with an interval of the expected output trace is an “interpolated” value (or weighted sum) of the two previous values. With this resampling approach, it is possible to re-compute all the CPU utilization numbers over any given intervals. Furthermore, it is mathematically consistent with the way the original data points (0.18 and 0.23) are reported, that is, they are weighted averages of CPU utilizations over finer time intervals, such as 1 millisecond. In an alternate embodiment, instead of taking the weighted sum of the two original data points 0.18 and 0.23, it is possible to take the maximum of the two original data points 0.18 and 0.23 if the nature of the data series is of a “maximum” type, such as maximum memory used during the 5-minute interval.
| TABLE 2 | |
| Extra Data Row Test | Examples |
| Calculate the time difference, Δt, | Let's use Row 5 (marked as “extra |
| between a current data row and a previous one. | row”) in Table 1 as the current row. |
| Then Row 4 is the previous row. | |
| If Δt ≦ 0, | Because both |
| a. do not include extra data row; | the same time stamp of 11:45 in the |
| expected output trace, Δt = 0. Thus, | |
| Row 5 is marked as “extra row” and | |
| not included in the input trace. | |
| b. consecutive extra rows = | Row 5 = 1st consecutive extra row; |
| consecutive extra rows + 1; | thus, if Row 6 was also mapped to |
| the expected output time of 11:45 or | |
| less, then Row 6 = 2nd consecutive | |
| extra row; and so on. | |
| 1) for consecutive extra rows > | Consecutive extra rows = 1, |
| ExtraRows_ConsecutiveRowsThreshold | because only Row 5 is a |
| consecutive extra row. This number | |
| is compared with a predefined | |
| threshold | |
| (ExtraRows_ConsecutiveRows | |
| Threshold), for generating an error. | |
| i. create error message; | |
| ii. Extra Row = Extra Row + 1; | Count the number of times a group |
| iii. reset consecutive extra row | of extra rows (which is greater than |
| to 0; | the predefined threshold) is |
| iv. go to next row; | encountered by resetting the |
| consecutive extra row to 0 for each | |
| group; in Table 1, Row 6 does not | |
| have same time stamp of 11:45 as | |
| in Row 5, so Row 6 is not | |
| considered an extra, and the | |
| algorithm ends up in 2) below. | |
| 2) for consecutive extra rows ≦ | Reset consecutive extra rows to 0 |
| ExtraRows_ConsecutiveRowsThreshold, | when it is less than the predefined |
| i. consecutive extra rows = 0; | threshold, and go to next row and |
| ii. go to next row. | repeat the algorithm. |
Wherein, ExtraRows_ConsecutiveRowsThreshold is the predefined threshold, set as desired by the user, indicating the number of consecutive data rows that must be extra or out of order before a data problem is generated. In effect, an error is generated when there is a group of (N+1) data rows that all have the same time stamps or are out of order, where N=ExtraRows_ConsecutiveRowsThreshold.
NumMetricDataPointNull(a)=NumMetricDataPointNull(a)+1.
If no, at 7430, the
NumMetricDataPoint(a)=NumMetricDataPoint(a)+1.
However, at 7450, if the metric value is outside the predetermined range, the
invalidDataPoints(a)=invalidDataPoints(a)+1,
to count up the number of invalid data points for each metric. In one embodiment, at 7470, if the metric value is less than the minimum value predetermined for the metric, the actual value is set to the minimum value. Likewise, if the metric value is greater than the maximum value predetermined for the metric, the actual value is set to the maximum value. Thus, 7410-7460 describe a detection scheme and 7470 describes a correction scheme. Alternative embodiments are contemplated, however, wherein for the correction scheme in 7470 any actual metric value outside the predetermined range is set to a predetermined value, such as zero.
Histogram(a, metric value)=Histogram(a, metric value)+1,
for each performance metric a for all data rows that were output by the earlier test at 740. A histogram in essence counts the number of times a given metric value appears in the trace (e.g., how many times the value of the metric XYZ equals to 5). A histogram can be constructed using a data structure that has N buckets. A range of values is then assigned to each bucket, e.g., if the min-max values are 0-100 and N=10, values 0-9 are assigned to one bucket, 10-19 to the second, and so on. Each monitored data value of a performance metric a is mapped to a corresponding bucket, and the count stored in the bucket is incremented by one each time. When this process is completed, a histogram of the values is generated. In the next stage,
NumAboveThresholdDataPoints(a)=NumAboveThresholdDataPoints(a)+1,
for inclusion in the computed statistics. At this juncture, the
Number of missing data rows=(time difference/Trace_DataRowInterval)−1.
Missing Rows=Missing Rows+(“number of missing data rows”/Missing Rows_ConsecutiveRowsThreshold).
The MissingRows_ConsecutiveRowsThreshold is a threshold value used to determine the number of consecutive data rows that must be missing before a data problem is considered to exist and a warning or error message is generated, and it is computed as a product of a predetermined constant and the expected number of rows in the output trace, or:
MissingRows_ConsecutiveRowsThreshold=Missing Rows_ConsecutiveRowsThreshMultiplier×Trace_ExpectedNumOfRows.
For example, MissingRows_ConsecutiveRowsThreshold could be set to 1% of the expected number of rows. Thus, an error message is generated if more than this number of rows are missing in succession. For example, if the threshold is 10 and there is gap where 3 rows are missing, an error message is not generated. However, if 13 consecutive rows are missing, an error message is generated. The conditional determination for the aforementioned Missing Rows is further described with reference to
D_begin=InputTrace_BeginTime−OutputTrace_BeginTime.
If D_begin>0, the
Missing Rows=Missing Rows+(“number of missing data rows”/MissingRows_ConsecutiveRowsThreshold); and
D_end=InputTrace_EndTime−OutputTrace_EndTime.
If D_end<0, the
% Ratio=NumMetricDataPointsNull(a)/NumMetricDataPoints(a)×100.
As referred herein, required metrics are those metrics without which server consolidation cannot be performed. Whereas, optional metrics are those metrics not required for server consolidation, but with which server consolidation can be further improved. The required metrics include, for example, CPU utilization & Memory residency, while the optional ones include CPU queue, paging, disk busy, disk queue, network bytes.
100×invalidDataPoints(a)/NumMetricDataPoints(a),
and also determines whether the % of outliers is greater than the predetermined value, InvalidDataPoints_PercentThreshold. If yes, at 920D, the
100×NumAboveThresholdDataPoints(a)/NumMetricDataPoints(a),
and determines whether such a percentage is greater than a predetermined percentage value, LatentDemandTestDurationThreshold. If yes, at 920E, the
Claims (20)
Priority Applications (1)
| Application Number | Priority Date | Filing Date | Title |
|---|---|---|---|
| US11/495,365 US8051162B2 (en) | 2006-07-28 | 2006-07-28 | Data assurance in server consolidation |
Applications Claiming Priority (1)
| Application Number | Priority Date | Filing Date | Title |
|---|---|---|---|
| US11/495,365 US8051162B2 (en) | 2006-07-28 | 2006-07-28 | Data assurance in server consolidation |
Publications (2)
| Publication Number | Publication Date |
|---|---|
| US20080027961A1 US20080027961A1 (en) | 2008-01-31 |
| US8051162B2 true US8051162B2 (en) | 2011-11-01 |
Family
ID=38987626
Family Applications (1)
| Application Number | Title | Priority Date | Filing Date |
|---|---|---|---|
| US11/495,365 Active 2030-03-01 US8051162B2 (en) | 2006-07-28 | 2006-07-28 | Data assurance in server consolidation |
Country Status (1)
| Country | Link |
|---|---|
| US (1) | US8051162B2 (en) |
Cited By (20)
| Publication number | Priority date | Publication date | Assignee | Title |
|---|---|---|---|---|
| US8175863B1 (en) * | 2008-02-13 | 2012-05-08 | Quest Software, Inc. | Systems and methods for analyzing performance of virtual environments |
| US8555244B2 (en) | 1999-11-24 | 2013-10-08 | Dell Software Inc. | Systems and methods for monitoring a computing environment |
| US8892415B2 (en) | 2006-05-17 | 2014-11-18 | Dell Software Inc. | Model-based systems and methods for monitoring resources |
| US9215142B1 (en) | 2011-04-20 | 2015-12-15 | Dell Software Inc. | Community analysis of computing performance |
| US9274758B1 (en) | 2015-01-28 | 2016-03-01 | Dell Software Inc. | System and method for creating customized performance-monitoring applications |
| US9479414B1 (en) | 2014-05-30 | 2016-10-25 | Dell Software Inc. | System and method for analyzing computing performance |
| US9557879B1 (en) | 2012-10-23 | 2017-01-31 | Dell Software Inc. | System for inferring dependencies among computing systems |
| US9996577B1 (en) | 2015-02-11 | 2018-06-12 | Quest Software Inc. | Systems and methods for graphically filtering code call trees |
| US10187260B1 (en) | 2015-05-29 | 2019-01-22 | Quest Software Inc. | Systems and methods for multilayer monitoring of network function virtualization architectures |
| US10200252B1 (en) | 2015-09-18 | 2019-02-05 | Quest Software Inc. | Systems and methods for integrated modeling of monitored virtual desktop infrastructure systems |
| US10216776B2 (en) | 2015-07-09 | 2019-02-26 | Entit Software Llc | Variance based time series dataset alignment |
| US10230601B1 (en) | 2016-07-05 | 2019-03-12 | Quest Software Inc. | Systems and methods for integrated modeling and performance measurements of monitored virtual desktop infrastructure systems |
| US10291493B1 (en) | 2014-12-05 | 2019-05-14 | Quest Software Inc. | System and method for determining relevant computer performance events |
| US10333820B1 (en) | 2012-10-23 | 2019-06-25 | Quest Software Inc. | System for inferring dependencies among computing systems |
| US10412148B2 (en) * | 2016-07-21 | 2019-09-10 | Microsoft Technology Licensing, Llc | Systems and methods for event aggregation to reduce network bandwidth and improve network and activity feed server efficiency |
| US10809982B2 (en) | 2019-03-19 | 2020-10-20 | Servicenow, Inc. | Workflow support for dynamic action input |
| US10866939B2 (en) | 2015-11-30 | 2020-12-15 | Micro Focus Llc | Alignment and deduplication of time-series datasets |
| US10929107B2 (en) | 2019-03-19 | 2021-02-23 | Servicenow, Inc. | Workflow support for dynamic action output |
| US11005738B1 (en) | 2014-04-09 | 2021-05-11 | Quest Software Inc. | System and method for end-to-end response-time analysis |
| US11895181B2 (en) | 2020-12-04 | 2024-02-06 | Schneider Electric It Corporation | Power optimization of microserver loads |
Families Citing this family (27)
| Publication number | Priority date | Publication date | Assignee | Title |
|---|---|---|---|---|
| WO2008043082A2 (en) | 2006-10-05 | 2008-04-10 | Splunk Inc. | Time series search engine |
| US8370806B2 (en) * | 2006-11-15 | 2013-02-05 | Qualcomm Incorporated | Non-intrusive, thread-selective, debugging method and system for a multi-thread digital signal processor |
| US8341604B2 (en) * | 2006-11-15 | 2012-12-25 | Qualcomm Incorporated | Embedded trace macrocell for enhanced digital signal processor debugging operations |
| US8380966B2 (en) * | 2006-11-15 | 2013-02-19 | Qualcomm Incorporated | Method and system for instruction stuffing operations during non-intrusive digital signal processor debugging |
| US8533530B2 (en) * | 2006-11-15 | 2013-09-10 | Qualcomm Incorporated | Method and system for trusted/untrusted digital signal processor debugging operations |
| US7571069B1 (en) * | 2006-12-22 | 2009-08-04 | Hewlett-Packard Development Company, L.P. | Data assurance workflow derivation and execution |
| US9597019B2 (en) * | 2007-02-09 | 2017-03-21 | Lifescan, Inc. | Method of ensuring date and time on a test meter is accurate |
| US8484516B2 (en) * | 2007-04-11 | 2013-07-09 | Qualcomm Incorporated | Inter-thread trace alignment method and system for a multi-threaded processor |
| US20090013259A1 (en) * | 2007-07-06 | 2009-01-08 | International Business Machines Corporation | Server consolidation using tabular data driven processes filled at least in part using automatically generated inferred data |
| US8458662B2 (en) * | 2008-02-27 | 2013-06-04 | Accenture Global Services Limited | Test script transformation analyzer with economic cost engine |
| US8055926B2 (en) * | 2008-02-28 | 2011-11-08 | International Business Machines Corporation | Aggregate power display for multiple data processing systems |
| US20120151040A1 (en) * | 2010-12-13 | 2012-06-14 | Mouravyov Sergei | Computer inventory data consolidation |
| GB2502571A (en) | 2012-05-31 | 2013-12-04 | Ibm | Modifying the lifespan of metrics in response to detecting a fault |
| US8954454B2 (en) * | 2012-10-12 | 2015-02-10 | Adobe Systems Incorporated | Aggregation of data from disparate sources into an efficiently accessible format |
| DE102012222885A1 (en) * | 2012-12-12 | 2014-06-12 | Bayerische Motoren Werke Aktiengesellschaft | Method for assigning timestamps to received data packets |
| US10079743B2 (en) * | 2013-05-06 | 2018-09-18 | Empire Technology Development Llc | Computing device performance monitor |
| US9501521B2 (en) * | 2013-07-25 | 2016-11-22 | Facebook, Inc. | Systems and methods for detecting missing data in query results |
| US9792194B2 (en) * | 2013-10-18 | 2017-10-17 | International Business Machines Corporation | Performance regression manager for large scale systems |
| US9277002B2 (en) | 2014-01-09 | 2016-03-01 | International Business Machines Corporation | Physical resource management |
| US9940362B2 (en) | 2015-05-26 | 2018-04-10 | Google Llc | Predicting user needs for a particular context |
| US10536355B1 (en) * | 2015-06-17 | 2020-01-14 | EMC IP Holding Company LLC | Monitoring and analytics system |
| DE102017108571B4 (en) * | 2017-04-21 | 2019-06-27 | Beckhoff Automation Gmbh | CONCEPT FOR TRANSMITTING TIME SYNCHRONIZED DATA FROM A LOCAL TIME CONTROL OF AN AUTOMATION SYSTEM TO AT LEAST ONE PARTICIPANT IN THE AUTOMATION SYSTEM |
| US10909124B2 (en) | 2017-05-18 | 2021-02-02 | Google Llc | Predicting intent of a search for a particular context |
| US10862781B2 (en) * | 2018-11-07 | 2020-12-08 | Saudi Arabian Oil Company | Identifying network issues using an agentless probe and end-point network locations |
| US10944622B2 (en) | 2018-11-16 | 2021-03-09 | Saudi Arabian Oil Company | Root cause analysis for unified communications performance issues |
| US10924328B2 (en) | 2018-11-16 | 2021-02-16 | Saudi Arabian Oil Company | Root cause analysis for unified communications performance issues |
| CN112395539B (en) * | 2020-11-26 | 2021-12-17 | 格美安(北京)信息技术有限公司 | Public opinion risk monitoring method and system based on natural language processing |
Citations (14)
| Publication number | Priority date | Publication date | Assignee | Title |
|---|---|---|---|---|
| US6148335A (en) | 1997-11-25 | 2000-11-14 | International Business Machines Corporation | Performance/capacity management framework over many servers |
| US6260020B1 (en) | 1998-11-02 | 2001-07-10 | International Business Machines Corporation | Method, system and program product for sizing a computer system migration programming effort |
| US20020140743A1 (en) | 2001-03-30 | 2002-10-03 | Microsoft Corporation | System and method for providing a server control interface |
| US20030225563A1 (en) | 2002-05-30 | 2003-12-04 | Gonos Dan G. | Capacity planning |
| US20040034577A1 (en) | 2002-08-15 | 2004-02-19 | Van Hoose Jeffrey N. | Methods and apparatus for analyzing an inventory for consolidation |
| US20040167906A1 (en) | 2003-02-25 | 2004-08-26 | Smith Randolph C. | System consolidation tool and method for patching multiple servers |
| US20060173875A1 (en) * | 2003-03-19 | 2006-08-03 | Unisys Corporation | Server Consolidation Data Mdel |
| US20060179171A1 (en) | 2003-03-19 | 2006-08-10 | Stefaniak Joseph P | Server consolidation analysis |
| US20060282825A1 (en) | 2005-06-10 | 2006-12-14 | International Business Machines Corporation | System, method and program for estimating a requisite amount of server resources |
| US20070028239A1 (en) | 2005-07-29 | 2007-02-01 | Bill Dyck | Dynamic performance management for virtual servers |
| US20070094375A1 (en) | 2005-10-24 | 2007-04-26 | Snyder Marc E | Dynamic Server Consolidation and Rationalization Modeling Tool |
| US20070226341A1 (en) | 2005-05-20 | 2007-09-27 | International Business Machines Corporation | System and method of determining an optimal distribution of source servers in target servers |
| US20070255814A1 (en) | 2006-04-27 | 2007-11-01 | Securetek Group Inc. | System for server consolidation and mobilization |
| US7506361B2 (en) | 2004-05-17 | 2009-03-17 | International Business Machines Corporation | Method for discovering servers, spawning collector threads to collect information from servers, and reporting information |
Family Cites Families (1)
| Publication number | Priority date | Publication date | Assignee | Title |
|---|---|---|---|---|
| US20040006424A1 (en) * | 2002-06-28 | 2004-01-08 | Joyce Glenn J. | Control system for tracking and targeting multiple autonomous objects |
-
2006
- 2006-07-28 US US11/495,365 patent/US8051162B2/en active Active
Patent Citations (14)
| Publication number | Priority date | Publication date | Assignee | Title |
|---|---|---|---|---|
| US6148335A (en) | 1997-11-25 | 2000-11-14 | International Business Machines Corporation | Performance/capacity management framework over many servers |
| US6260020B1 (en) | 1998-11-02 | 2001-07-10 | International Business Machines Corporation | Method, system and program product for sizing a computer system migration programming effort |
| US20020140743A1 (en) | 2001-03-30 | 2002-10-03 | Microsoft Corporation | System and method for providing a server control interface |
| US20030225563A1 (en) | 2002-05-30 | 2003-12-04 | Gonos Dan G. | Capacity planning |
| US20040034577A1 (en) | 2002-08-15 | 2004-02-19 | Van Hoose Jeffrey N. | Methods and apparatus for analyzing an inventory for consolidation |
| US20040167906A1 (en) | 2003-02-25 | 2004-08-26 | Smith Randolph C. | System consolidation tool and method for patching multiple servers |
| US20060173875A1 (en) * | 2003-03-19 | 2006-08-03 | Unisys Corporation | Server Consolidation Data Mdel |
| US20060179171A1 (en) | 2003-03-19 | 2006-08-10 | Stefaniak Joseph P | Server consolidation analysis |
| US7506361B2 (en) | 2004-05-17 | 2009-03-17 | International Business Machines Corporation | Method for discovering servers, spawning collector threads to collect information from servers, and reporting information |
| US20070226341A1 (en) | 2005-05-20 | 2007-09-27 | International Business Machines Corporation | System and method of determining an optimal distribution of source servers in target servers |
| US20060282825A1 (en) | 2005-06-10 | 2006-12-14 | International Business Machines Corporation | System, method and program for estimating a requisite amount of server resources |
| US20070028239A1 (en) | 2005-07-29 | 2007-02-01 | Bill Dyck | Dynamic performance management for virtual servers |
| US20070094375A1 (en) | 2005-10-24 | 2007-04-26 | Snyder Marc E | Dynamic Server Consolidation and Rationalization Modeling Tool |
| US20070255814A1 (en) | 2006-04-27 | 2007-11-01 | Securetek Group Inc. | System for server consolidation and mobilization |
Cited By (23)
| Publication number | Priority date | Publication date | Assignee | Title |
|---|---|---|---|---|
| US8555244B2 (en) | 1999-11-24 | 2013-10-08 | Dell Software Inc. | Systems and methods for monitoring a computing environment |
| US8892415B2 (en) | 2006-05-17 | 2014-11-18 | Dell Software Inc. | Model-based systems and methods for monitoring resources |
| US8175863B1 (en) * | 2008-02-13 | 2012-05-08 | Quest Software, Inc. | Systems and methods for analyzing performance of virtual environments |
| US9275172B2 (en) | 2008-02-13 | 2016-03-01 | Dell Software Inc. | Systems and methods for analyzing performance of virtual environments |
| US9215142B1 (en) | 2011-04-20 | 2015-12-15 | Dell Software Inc. | Community analysis of computing performance |
| US10333820B1 (en) | 2012-10-23 | 2019-06-25 | Quest Software Inc. | System for inferring dependencies among computing systems |
| US9557879B1 (en) | 2012-10-23 | 2017-01-31 | Dell Software Inc. | System for inferring dependencies among computing systems |
| US11005738B1 (en) | 2014-04-09 | 2021-05-11 | Quest Software Inc. | System and method for end-to-end response-time analysis |
| US9479414B1 (en) | 2014-05-30 | 2016-10-25 | Dell Software Inc. | System and method for analyzing computing performance |
| US10291493B1 (en) | 2014-12-05 | 2019-05-14 | Quest Software Inc. | System and method for determining relevant computer performance events |
| US9274758B1 (en) | 2015-01-28 | 2016-03-01 | Dell Software Inc. | System and method for creating customized performance-monitoring applications |
| US9996577B1 (en) | 2015-02-11 | 2018-06-12 | Quest Software Inc. | Systems and methods for graphically filtering code call trees |
| US10187260B1 (en) | 2015-05-29 | 2019-01-22 | Quest Software Inc. | Systems and methods for multilayer monitoring of network function virtualization architectures |
| US10216776B2 (en) | 2015-07-09 | 2019-02-26 | Entit Software Llc | Variance based time series dataset alignment |
| US10200252B1 (en) | 2015-09-18 | 2019-02-05 | Quest Software Inc. | Systems and methods for integrated modeling of monitored virtual desktop infrastructure systems |
| US10866939B2 (en) | 2015-11-30 | 2020-12-15 | Micro Focus Llc | Alignment and deduplication of time-series datasets |
| US10230601B1 (en) | 2016-07-05 | 2019-03-12 | Quest Software Inc. | Systems and methods for integrated modeling and performance measurements of monitored virtual desktop infrastructure systems |
| US10412148B2 (en) * | 2016-07-21 | 2019-09-10 | Microsoft Technology Licensing, Llc | Systems and methods for event aggregation to reduce network bandwidth and improve network and activity feed server efficiency |
| US10809982B2 (en) | 2019-03-19 | 2020-10-20 | Servicenow, Inc. | Workflow support for dynamic action input |
| US10929107B2 (en) | 2019-03-19 | 2021-02-23 | Servicenow, Inc. | Workflow support for dynamic action output |
| US11256482B2 (en) | 2019-03-19 | 2022-02-22 | Servicenow, Inc. | Workflow support for dynamic action input |
| US11435983B2 (en) | 2019-03-19 | 2022-09-06 | Servicenow, Inc. | Workflow support for dynamic action output |
| US11895181B2 (en) | 2020-12-04 | 2024-02-06 | Schneider Electric It Corporation | Power optimization of microserver loads |
Also Published As
| Publication number | Publication date |
|---|---|
| US20080027961A1 (en) | 2008-01-31 |
Similar Documents
| Publication | Publication Date | Title |
|---|---|---|
| US8051162B2 (en) | Data assurance in server consolidation | |
| US7185231B2 (en) | Methods and systems for collecting, analyzing, and reporting software reliability and availability | |
| US8276161B2 (en) | Business systems management solution for end-to-end event management using business system operational constraints | |
| US11297144B2 (en) | Systems and methods for operation management and monitoring of bots | |
| US6782421B1 (en) | System and method for evaluating the performance of a computer application | |
| US8000932B2 (en) | System and method for statistical performance monitoring | |
| US8533536B2 (en) | Monitoring data categorization and module-based health correlations | |
| EP2035955B1 (en) | An automated method and system for collecting and reporting api performance profiles | |
| US10171335B2 (en) | Analysis of site speed performance anomalies caused by server-side issues | |
| US8776007B2 (en) | Assessment of software code development | |
| US7571069B1 (en) | Data assurance workflow derivation and execution | |
| US8606894B1 (en) | Server consolidation | |
| US10263833B2 (en) | Root cause investigation of site speed performance anomalies | |
| US7197447B2 (en) | Methods and systems for analyzing software reliability and availability | |
| US20060168594A1 (en) | Computer system performance monitoring using transaction latency data | |
| US11243863B2 (en) | Systems and methods for modeling computer resource meirics | |
| US7739661B2 (en) | Methods and systems for planning and tracking software reliability and availability | |
| US9600523B2 (en) | Efficient data collection mechanism in middleware runtime environment | |
| US7035772B2 (en) | Method and apparatus for calculating data integrity metrics for web server activity log analysis | |
| US8291059B2 (en) | Method for determining a business calendar across a shared computing infrastructure | |
| US10504026B2 (en) | Statistical detection of site speed performance anomalies | |
| US20080071807A1 (en) | Methods and systems for enterprise performance management | |
| US7752303B2 (en) | Data reporting using distribution estimation | |
| US7921410B1 (en) | Analyzing and application or service latency | |
| US20150073878A1 (en) | Device to perform service contract analysis |
Legal Events
| Date | Code | Title | Description |
|---|---|---|---|
| AS | Assignment |
Owner name: HEWLETT-PACKARD DEVELOPMENT COMPANY, L.P., TEXAS Free format text: ASSIGNMENT OF ASSIGNORS INTEREST;ASSIGNORS:ARTLITT, MARTIN F.;FARKAS, KEITH I.;ROLIA, JEROME;REEL/FRAME:018144/0823 Effective date: 20060728 |
|
| AS | Assignment |
Owner name: HEWLETT-PACKARD DEVELOPMENT COMPANY, L.P., TEXAS Free format text: ASSIGNMENT OF ASSIGNORS INTEREST;ASSIGNORS:ARLITT, MARTIN F.;FREMONT, MARIE-JO;REEL/FRAME:018250/0590;SIGNING DATES FROM 20060821 TO 20060830 Owner name: HEWLETT-PACKARD DEVELOPMENT COMPANY, L.P., TEXAS Free format text: ASSIGNMENT OF ASSIGNORS INTEREST;ASSIGNORS:ARLITT, MARTIN F.;FREMONT, MARIE-JO;SIGNING DATES FROM 20060821 TO 20060830;REEL/FRAME:018250/0590 |
|
| STCF | Information on status: patent grant |
Free format text: PATENTED CASE |
|
| CC | Certificate of correction | ||
| FPAY | Fee payment |
Year of fee payment: 4 |
|
| AS | Assignment |
Owner name: HEWLETT PACKARD ENTERPRISE DEVELOPMENT LP, TEXAS Free format text: ASSIGNMENT OF ASSIGNORS INTEREST;ASSIGNOR:HEWLETT-PACKARD DEVELOPMENT COMPANY, L.P.;REEL/FRAME:037079/0001 Effective date: 20151027 |
|
| MAFP | Maintenance fee payment |
Free format text: PAYMENT OF MAINTENANCE FEE, 8TH YEAR, LARGE ENTITY (ORIGINAL EVENT CODE: M1552); ENTITY STATUS OF PATENT OWNER: LARGE ENTITY Year of fee payment: 8 |
|
| MAFP | Maintenance fee payment |
Free format text: PAYMENT OF MAINTENANCE FEE, 12TH YEAR, LARGE ENTITY (ORIGINAL EVENT CODE: M1553); ENTITY STATUS OF PATENT OWNER: LARGE ENTITY Year of fee payment: 12 |