WO2010051580A1 - Monitoring sample via quantum decoherence rate of probe - Google Patents
Monitoring sample via quantum decoherence rate of probe Download PDFInfo
- Publication number
- WO2010051580A1 WO2010051580A1 PCT/AU2009/001434 AU2009001434W WO2010051580A1 WO 2010051580 A1 WO2010051580 A1 WO 2010051580A1 AU 2009001434 W AU2009001434 W AU 2009001434W WO 2010051580 A1 WO2010051580 A1 WO 2010051580A1
- Authority
- WO
- WIPO (PCT)
- Prior art keywords
- quantum
- probe
- sample
- property
- decoherence
- Prior art date
Links
Classifications
-
- G—PHYSICS
- G01—MEASURING; TESTING
- G01Q—SCANNING-PROBE TECHNIQUES OR APPARATUS; APPLICATIONS OF SCANNING-PROBE TECHNIQUES, e.g. SCANNING PROBE MICROSCOPY [SPM]
- G01Q70/00—General aspects of SPM probes, their manufacture or their related instrumentation, insofar as they are not specially adapted to a single SPM technique covered by group G01Q60/00
- G01Q70/08—Probe characteristics
- G01Q70/14—Particular materials
-
- B—PERFORMING OPERATIONS; TRANSPORTING
- B82—NANOTECHNOLOGY
- B82Y—SPECIFIC USES OR APPLICATIONS OF NANOSTRUCTURES; MEASUREMENT OR ANALYSIS OF NANOSTRUCTURES; MANUFACTURE OR TREATMENT OF NANOSTRUCTURES
- B82Y35/00—Methods or apparatus for measurement or analysis of nanostructures
-
- G—PHYSICS
- G01—MEASURING; TESTING
- G01N—INVESTIGATING OR ANALYSING MATERIALS BY DETERMINING THEIR CHEMICAL OR PHYSICAL PROPERTIES
- G01N24/00—Investigating or analyzing materials by the use of nuclear magnetic resonance, electron paramagnetic resonance or other spin effects
- G01N24/10—Investigating or analyzing materials by the use of nuclear magnetic resonance, electron paramagnetic resonance or other spin effects by using electron paramagnetic resonance
-
- G—PHYSICS
- G01—MEASURING; TESTING
- G01Q—SCANNING-PROBE TECHNIQUES OR APPARATUS; APPLICATIONS OF SCANNING-PROBE TECHNIQUES, e.g. SCANNING PROBE MICROSCOPY [SPM]
- G01Q60/00—Particular types of SPM [Scanning Probe Microscopy] or microscopes; Essential components thereof
-
- G—PHYSICS
- G01—MEASURING; TESTING
- G01Q—SCANNING-PROBE TECHNIQUES OR APPARATUS; APPLICATIONS OF SCANNING-PROBE TECHNIQUES, e.g. SCANNING PROBE MICROSCOPY [SPM]
- G01Q60/00—Particular types of SPM [Scanning Probe Microscopy] or microscopes; Essential components thereof
- G01Q60/24—AFM [Atomic Force Microscopy] or apparatus therefor, e.g. AFM probes
- G01Q60/38—Probes, their manufacture, or their related instrumentation, e.g. holders
- G01Q60/42—Functionalisation
-
- G—PHYSICS
- G01—MEASURING; TESTING
- G01R—MEASURING ELECTRIC VARIABLES; MEASURING MAGNETIC VARIABLES
- G01R33/00—Arrangements or instruments for measuring magnetic variables
- G01R33/20—Arrangements or instruments for measuring magnetic variables involving magnetic resonance
- G01R33/28—Details of apparatus provided for in groups G01R33/44 - G01R33/64
- G01R33/32—Excitation or detection systems, e.g. using radio frequency signals
- G01R33/323—Detection of MR without the use of RF or microwaves, e.g. force-detected MR, thermally detected MR, MR detection via electrical conductivity, optically detected MR
- G01R33/326—Detection of MR without the use of RF or microwaves, e.g. force-detected MR, thermally detected MR, MR detection via electrical conductivity, optically detected MR involving a SQUID
-
- B—PERFORMING OPERATIONS; TRANSPORTING
- B82—NANOTECHNOLOGY
- B82Y—SPECIFIC USES OR APPLICATIONS OF NANOSTRUCTURES; MEASUREMENT OR ANALYSIS OF NANOSTRUCTURES; MANUFACTURE OR TREATMENT OF NANOSTRUCTURES
- B82Y15/00—Nanotechnology for interacting, sensing or actuating, e.g. quantum dots as markers in protein assays or molecular motors
Definitions
- the present invention relates to a method and apparatus for monitoring a property of a sample.
- the present invention relates particularly, though not exclusively, to a method and apparatus for monitoring a nanoscopic property of a sample.
- cell membranes include ion channels and detailed information concerning the activity of the ion channels would be very useful for advancing our understanding of the function of cell membranes and cells.
- Two stage quantum probes have been used as a sensitive spatial electrometer or magnetometer to produce images.
- the methods known to date do not allow monitoring processes and dynamics at the nanoscale in a satisfactory manner. There is a need for technological advancement.
- the present invention provides in a first aspect a method of monitoring a property of a sample, the method comprising the steps of: providing a quantum probe having a quantum state; exposing the quantum probe to the sample in a manner such that the property of the sample, in the proximity of the quantum probe, affects quantum coherence of the quantum probe,- and detecting a rate of quantum decoherence of the quantum probe to monitor the property of the sample .
- the property of the sample typically is a nanoscopic property.
- the present invention opens new avenues in science and technology.
- the property may relate to a local atomic of molecular property of the sample, such as an electric or a magnetic property.
- the nanoscopic property may relate to a fundamental spin, such as the spin of an ion, or a charge or a collection thereof.
- the ion may move thorough an ion channel of a cell membrane in the proximity surface of the quantum probe.
- the ion influences the decoherence rate of the quantum probe and consequently is detectable using the method in accordance with the embodiments of the present invention and can be resolved both spatially and temporally.
- the spin may be the spin of a free- radical particle moving in a biological structure.
- Quantum probes for example quantum qubits in quantum information applications, are generally isolated as far as possible from the environment in order to maintain quantum coherence. Embodiments of the present invention are consequently counterintuitive as they deliberately cause decoherence of the quantum probe and use detection of the decoherence rate to detect properties of the samples in a unique manner.
- the quantum probe may comprise a two-state quantum probe (qubit) or multi-state quantum probe, for instance a charge state qubit, or may comprise a number of quantum systems that may be entangled.
- the quantum probe may be based on electric charge or magnetic spin degrees of freedom.
- the quantum probe may be any other suitable type of quantum probe .
- the quantum probe may be movable relative to the sample or may be stationary relative to the sample.
- the quantum probe may also be incorporated in the sample.
- the quantum probe may comprise a quantum system consisting of a single particle, such as an atom or ion, or comprising a plurality of particles, a portion of a material, a crystal and/or may be positioned in a matrix of a surrounding material. Further, the quantum probe may comprise a plurality of particles sharing a quantum entangled state.
- the quantum probe may also be one of a plurality of quantum probes and the step of providing the quantum probe may comprise providing a plurality of quantum probes, such as an array of the quantum probes.
- the plurality of quantum probes may comprise any number of quantum probes .
- the step of detecting a rate of quantum de ⁇ oherence may comprise detecting photons emitted from the plurality of quantum probes.
- the step of setecting the photons may comprise use of a corresponding array of respective detectors.
- the quantum probe may comprise one quantum system or a plurality of quantum systems and the step of exposing the quantum probe to the sample may comprise exposing the probe to property of a sample, such as a nanoscopic property associated with single particles or a small group of particles.
- a sample such as a nanoscopic property associated with single particles or a small group of particles.
- the nanoscopic property of the sample may be associated with the spin of an ion or a small groups of ions.
- the quantum probe may also comprise one quantum system or a plurality of quantum systems, but the step of exposing the quantum probe to the sample may comprise exposing the probe to a larger scale property, such as a microscopic or macroscopic property which may be associated with a larger group of particles or with a bulk property of the sample.
- the quantum probe comprises a diamond material having at least one nitrogen-vacancy (NV) centre.
- the quantum probe may comprise one NV centre, but may alternatively also comprise a plurality of NV centres in the diamond material .
- the step of providing the quantum probe may comprise transforming the quantum probe into a predefined quantum state, for example a superposition or entangled state in which the quantum probe may be particularly sensitive to magnetic fields.
- Transforming the quantum probe may comprise the application of suitable radiation.
- the step of transforming the quantum probe may comprise exposing the NV- centre to suitable microwave radiation to generate a suitable quantum state of Zeeman energy levels.
- the method may comprise optically pumping the NV- centre, which may comprise use of a suitable laser such as a laser having a wavelength of the order of 520nm.
- the step of detection a decoherence rate may comprise detecting fluorescence photons emitted from the NV- centre.
- method may also comprise the step of controlling the quantum state of the quantum probe by applying suitable radiation.
- the method may comprise the step of controlling quantum coherence time of the quantum probe by applying suitable radiation.
- the method typically comprises the step of moving the quantum probe and the sample relative to each other and performing the method so that the decoherence rate is detectable at a plurality of sample locations.
- the method typically comprises the step of generating a line scan or a map of a portion of the sample and showing a distribution of decoherence properties.
- the method may comprise scanning the quantum probe with NV centre across the surface of the sample.
- the method allows monitoring a function of biological samples typically at the nanoscale .
- the method may comprise detecting fluctuations or particle, such as ions, in the surface or bulk of the sample.
- the sample may for example be a cell membrane and may comprise a bi- lipid.
- the sample may comprise ion channels, such as channels though which single ions diffuse.
- the method may comprise exposing the sample, or the sample and the quantum probe, to a liquid, such as water, a salt- containing solution, or any other suitable solution.
- the method may further comprise detecting a change (usually an increase) in quantum decoherence rate caused by an influence of a spin of the particle on the quantum probe and thereby monitoring for example the function of the ion channel .
- the spin may be a nuclear spin of the particle.
- the method may also comprise combining generated decoherence rate maps with maps of other properties, such maps showing electric, magnetic or structural sample properties, which is particularly advantageous for characterising solid state samples.
- the method may further comprise generating a map of an effective quantum Hamiltonian as a function of position on the sample . Combining a map of the decoherence rate with a map of the Hamiltonian may provide an image of the sample surface that is a direct window into the distribution and sources of magnetic or electric field fluctuations emanating from the sample surface.
- the present invention provides in a second aspect and apparatus for monitoring a property of a sample, the apparatus comprising: a quantum probe that has quantum state; a holder for holding the quantum probe in the proximity of a sample so that the quantum coherence of the quantum probe is influenced by the property of the sample; and a detector for detecting a quantity indicative of a quantum decoherence rate and thereby monitoring the property of the sample .
- the property of the sample typically is a nanoscopic property.
- the apparatus typically also comprises a source for transforming the quantum probe into the quantum state.
- the holder of the apparatus typically comprises a scanning arrangement that is suitable for scanning the quantum probe and the sample relative to each other.
- the holder comprises an arrangement similar to an atomic force microscope.
- the quantum probe comprises a diamond material having one or a plurality of NV centres.
- the source for transforming the quantum probe typically comprises a source for emitting microwave radiation suitable for generating a Zeeman shift of energy levels and/or controlling the quantum state of the quantum probe, for example controlling a coherence time of the quantum probe.
- the apparatus typically comprises an optical light source for optically pumping the at least one NV-centre.
- the detector typically is a photon detector arranged to detect fluorescence photons emitted from the at least one NV-centre.
- the quantum probe may be movable relative to the sample or may be stationary relative to the sample.
- the quantum probe may also be incorporated in the sample.
- the quantum probe may comprise one quantum system or a plurality of quantum systems.
- the quantum probe may comprise a quantum system consisting of a single particle such as an atom or ion, or comprising a plurality of particles, a portion of a material, a crystal and/or may be positioned in a matrix of a surrounding material. Further, the quantum probe may comprise a plurality of particles sharing a quantum entangled state .
- the quantum probe may also be one of a plurality of quantum probes and the step of providing the quantum probe may comprise providing a plurality of quantum probes, such as an array of the quantum probes.
- the plurality of quantum probes may comprise any number of quantum probes .
- the detector may also comprise a plurality of detector elements.
- the detector may comprise an array of respective detector elements.
- Figure 1 illustrates an NV-centre of a quantum probe in accordance with an embodiment of the present invention
- Figure 2 illustrates energy states of a quantum probe accordance with an embodiment of the present invention
- Figure 3 shows an apparatus for monitoring a property of a sample accordance with an embodiment of the present invention
- Figure 4 illustrates interaction of a biological sample with the quantum probe accordance with an embodiment of the present invention
- Figure 5 shows a measurement illustrating loss of decoherence with time (arbitrary units) ;
- Figure 6 shows a simulated map having 7 decoherence rate maxima associated with locations of ion channels (arbitrary units) ;
- Figure 7 (a) is a schemtaic diagram showing a single nitrogen- vacancy (NV) defect in a diamond nanocrystal placed on an AFM tip (The unique properties of the NV atomic level scheme allows for optically induced readout and microwave control of magnetic (spin) sub- levels) ;
- Figure 7 (b) is a schematic diagram showing a cell membrane nearby the diamond nanocrystal of Figure 7 (a) which is host to channels permitting the flow of ions across the surface (The ion motion results in an effective fluctuating magnetic field at the NV position which decoheres the quantum state of the NV system) ;
- Figure 7(c) is a three-dimensional representation of decoherence results in a decrease in fluorescence, which is most pronounced in regions close to the ion channel opening;
- Figure 7 (d) is a two dimensional plot of ion channel state against time showing that changes in fluorescence also permit the temporal tracking of ion channel dynamics;
- Figure 8 (a) is a schemtaic diagram showing a NV-centre diamond lattice defect
- Figure 8 (c) is a two-dimensional graph showing a specific microwave and optical pulse sequence for coherent control and readout ;
- Figure 9 (a) is a two dimensional plot showing typical magnetic field signals from water, ion channel and lipid bilayer sources at a probe standoff of 4 nm over a 1 ms timescale;
- Figure 9 (b) is a two dimensional plot showing a comparison of ⁇ B for various sources of magnetic fields against probe standoff distance
- Slowly fluctuating fields ( ⁇ «l) are in the slow fluctuation limit (SFL) .
- the ion channel signal exists in the ⁇ l regime, and therefore has an optimal dephasing effect on the NV probe;
- Figure 10 is three dimensional plots showing spatial information corresponding to the ion channel as a dephasing source (Relative population differences are plotted for pixel dwell times of 10, 100 and 1000 ms, from left to right respectively. Corresponding image acquisition times are 4, 40 and 400 s) ;
- Figure 11 (a) is a two dimensional plot showing dephasing rates due to the sources of magnetic field plotted as a function of probe standoff, h p ;
- Figure 12 (a) is a two dimensional plot showing the dependence of temporal resolution ( ⁇ t ) and signal variance ( ⁇ P) on the number of data points included in the running average ( N s ) ;
- Figure 12 (b) is a two dimensional plot showing simulated reconstruction of a sodium ion channel signal with a 200 Hz switching rate using optical readout of an NV centre (blue curve) (The actual ion channel state (on/off) is depicted by the dashed line, and the green line depicts the analytic confidence threshold) ;
- Figures 12 (c) - (e) are two dimensional plots showing Fourier transforms of measurement records for stand-offs of 4, 5 and 6 nm respectively (Switching dynamics are clearly resolvable for h p ⁇ 6 nm, beyond which there is little contrast between decoherence due to the ion channel signal and the background) ;
- Figure 13 (a) shows a schematic set-up of components for monitoring a property of a sample in accordance with a specific embodiment of the present invention
- Figure 13 (b) shows diamond crystals having NV-centres in accordance with a specific embodiment of the present invention
- Figure 14 shows a measurement indicating quantum decroherece (arbitrary units) in accordance with a specific embodiment of the present invention
- Figure 15 shows a spin-echo intensity (arbitrary units) as a function of time indicative of quantum decoherence in both air and water environments
- Figure 16 and 17 show spin-echo intensities (arbitrary units) as a function of time indicative of quantum decoherence ;
- Figure 18 (a) illustrates an apparatus for monitoring a property in accordance with a specific embodiment of the present invention
- Figure 18 (b) is a series of three signal images, representing respectively a measurement signal, a Correlated signal and a Spectral response;
- Figure 18 (c) is a pair of images of the surface, one a static field map and the other a dynamic fluctuation map;
- Figure 18 (d) is a 3-D terrain image derived from combination of the static field map and the dynamic fluctuation map of Figure 18 (c) ;
- Figure 19 (a) is a series of images of an example sample with uniform distribution of fluctuators (shaded dots) within non-trivial spatial regions (outlined in white) ;
- Figure 19 (c) is a series of images (corresponding to Figure 19 (b) ) showing the (normalised) Hamiltonian component induced by the background charges plotted as the grey scale.
- Figures 19 (d) is a series of images where the corresponding images of Figures 19 (b) and(c) have been combined using the value of (b) for the height and (c) for the colour;
- Figure 21 (a) is a plot of magnetic field strength as measured via the variation in the probe qubit Hamiltonian.
- the pixel intensity represents the normalized fractional variation in the probe spin Hamiltonian;
- Figure 21 (b) is a plot of the effective temperature of each spin, based on the population of the ground and excited states
- Figure 21 (c) is a surface plot of the magnetisation with shading based on the fraction of time spent in the excited spin state of the sample spin.
- Figure 22 is a series of pixilated plots relating to the image of Figure 21 (a) with simulated noise stemming from a finite measurement time;
- the apparatus comprises a diamond crystal containing a nitrogen-vacancy (NV) spin qubit on a nano-scanning tip, microwave spin control, and confocal optical spin readout.
- NV nitrogen-vacancy
- Figure 1 illustrates the NV lattice defect, which has a relatively long coherence times (ms range) at room temperature.
- Figure 2 shows energy levels of the NV-centre as affected by suitable microwave radiation. Ground state Zeeman levels are put into a superposition state by the microwave radiation. After interaction with the sample the state is read-out systematically to determine the local decoherence rate, which is highly sensitive to effective magnetic field fluctuations at the nanoscale. The read-out involves use of a laser (not shown) having a wavelength of approximately 520nm.
- Figure 3 illustrates the NV system being scanned over a sample.
- the sample includes a membrane ion- channel.
- Nuclear spins of the (electron-spin paired) ions form a fluctuating spin current, which dephases the NV spin states over a characteristic timescale .
- Figure 4 illustrates the interaction of the quantum probe with the ion-channel and
- Figure 5 shows a measurement illustrating loss of quantum coherence with time (arbitrary units) .
- Figure 6 shows a simulated map having 7 maxima that coincide with locations of ion cannels .
- the simulations for generation of the map take into account various background sources of dephasing (diffusion of electrolytic and lipid bi- layer components) and their associated (fast) timescales show that the operation of a single ion channel (or several) can be detected and resolved spatially and temporally in a scanning decoherence measurement forming a unique image of bio-function at the nanoscale.
- the cell membrane is a critical regulator of life. Its importance is reflected by the fact that the majority of drugs target membrane interactions [69] . Ion channels allow for passive and selective diffusion of ions across the cell membrane [86] , while ion pumps actively create and maintain the potential gradients across the membranes of living cells [87] . To monitor the effect of new drugs and drug delivery mechanisms a wide field ion channel monitoring capability is essential. However, there are significant challenges facing existing techniques stemming from the fact that membrane proteins, hosted in a lipid bilayer, require a complex environment to preserve their structural and functional integrity.
- Patch clamp techniques are generally invasive, quantitatively inaccurate, and difficult to scale up [87-89] , while black lipid membranes [90,91] often suffer from stability issues and can only host a limited number of membrane proteins .
- the approach described herein is to consider a novel and inherently non- invasive in-situ detection method based on the quantum decoherence of a single-atom probe [78] .
- decoherence refers to the loss of quantum coherence between magnetic sub- levels of a controlled atom system due to interactions with an environment.
- the NV probe [Fig. 7] consists of a nano- crystal of diamond containing a nitrogen-vacancy (NV) defect placed at the end of an AFM tip, as recently demonstrated [72] .
- NV nitrogen-vacancy
- a quantum probe must be submersible to be brought within nanometers of the sample structure, hence the NV system locked and protected in the ultra- stable diamond matrix [Fig. 7 (a)] is the system of choice.
- the NV centre in diamond alone offers the controllable, robust and persistent quantum properties such room temperature nano- sensing applications will demand [73,74,92] , as well as zero toxicity in a biological environment [77,92,93] .
- the lipid membrane, embedded ion channels, and the immediate surroundings are described as a fluctuating electromagnetic environment and quantitatively assess each effect on the quantum coherence of the NV centre.
- the net magnetic field due to diffusion of nuclei, atoms and molecules in the immediate surroundings of the nanocrystal containing the NV system and the extent to which each source will decohere is considered to be the quantum state of the NV.
- the decoherence of the NV spin levels is in fact highly sensitive to the particular signal due to the ion flux through a single ion channel.
- Theoretical findings demonstrate the potential of this approach to revolutionize the way ion channels and potentially other membrane bound proteins or interacting species are characterized and measured, particularly when scale-up and scanning capabilities are considered.
- the quantum decoherence imaging system is described with reference to Fig. 7 and being implemented using an NV centre in a realistic technology platform.
- the biological system is described, considering the various sources of magnetic field fluctuations due to atomic and molecular processes in the membrane itself and in the surrounding media; and their effect on the decoherence of the optically monitored NV system.
- Estimates of the sensitivity of the NV decoherence to various magnetic field fluctuation regimes (amplitude and frequency) are made which indicate the ability to detect ion channel switch-on/off events.
- Also described are large scale numerical simulations of the time evolution of the NV spin system including all magnetic field generating processes. This acts to verify the analytic picture, and provides quantitative results for the monitoring and scanning capabilities of the system.
- the energy level scheme of the C 3v -symmetric NV system [Fig. 8(b)] consists of ground ( 3 A), excited ( 3 E) and meta-stable ( 1 A) states.
- An important property of the NV system is that under optical excitation the spin levels are readily distinguishable by a difference in fluorescence, hence spin- state readout is achieved by purely optical means [94,95] . Because of this relative simplicity of control and readout, the quantum properties of the NV system, including the interaction with the immediate crystalline environment, have been well probed [96,97] .
- the coherence time of the spin levels is very long even at room temperature: in type Ib nanocrystals T 2 ⁇ s , and in isotopically engineered diamond can be as long as 1.8 ms [83] with the use of a spin-echo microwave control sequence [Fig. 8(c)] .
- Typical ion channel species K + , Ca 2+ , Na + , and nearby water molecules are electron spin paired, so any magnetic signal due to ion channel operation will be primarily from the motion of nuclear spins .
- Ions and water molecules enter the channel in thermal equilibrium with random spin orientations, and move through the channel over a ⁇ s timescale.
- the monitoring of ion channel activity occurs via measurement of the contrast in probe behavior between the on and off states of the ion channel. This then requires the dephasing due to ion channel activity to be at least comparable to that due to the fluctuating background magnetic signal.
- the decoherence of the NV quantum state due to the diffusion of water molecules, buffer molecules, saline components as well as the transversal diffusion of lipid molecules in the cell membrane must therefore be accounted for.
- the ftth nuclear spin with charge q n , gyromagnetic ratio ⁇ n , velocity v n and spin vector S n interacts with the NV spin vector P and gyromagnetic ratio ⁇ p through the time-dependent dipole dominated interaction:
- Fig. 9 (a) shows typical field traces at a probe height of 1- lOnm above the ion channel, generated by the ambient environment and the on-set of ion-flow as the channel opens.
- both the ion channel signal and background are well below the nT Hz ⁇ m sensitivity limit of the magnetometer over the ( ⁇ 1 ns) self- correlated timescales of the environment.
- H bg which, in the present methodology, is used to obtain the noise spectra of the various background processes.
- H bg which, in the present methodology, is used to obtain the noise spectra of the various background processes.
- the following analysis assumes dephasing to be the dominant decoherence channel in the system. Relaxation processes are ignored since all magnetic fields considered are at least 4 orders of magnitude less than the effective crystal field of D/ ⁇ p ⁇ 0.2 T, and are hence unable to flip the probe spin over relevant timescales. Phonon excitation in the diamond crystal lead to relaxation times of the order of 100 s [83] and may also be ignored. Before moving onto the numerical simulations, it is useful to consider some important features of the problem.
- the field standard deviation ⁇ g ' due to the random nuclear spin of ions and bound water molecules moving in an ion channel (ic) can be estimated as:
- the fluctuation strength of the ion channel magnetic field, ⁇ g' is plotted in Fig. 9 (b) as a function of the probe stand-off distance, h p .
- Ion flux rates are of the order of ⁇ 5xlO ⁇ 4 ionsns ⁇ ! nm ⁇ 2 [98], giving an effective dipole field fluctuation rate of / e ⁇ 3xl0 4 Hz.
- values of ⁇ range from 0.4 to 40 [Fig. 9(c)] .
- the ion channel flow hovers near the cross-over point, with an induced dephasing rate of r ic ⁇ 10 4 -10 5 Hz .
- the first source of background noise is the fluctuating magnetic field arising from the motion of the water molecules and ions throughout the aqueous solution.
- liquid water Due to the nuclear spins of the hydrogen atoms, liquid water consists of a mixture of spin neutral (para) and spin-1 (ortho) molecules.
- the equilibrium ratio of ortho to para molecules (OP ratio) is 3:1 [99], making 75% of water molecules magnetically active.
- OP ratio equilibrium ratio of ortho to para molecules
- This magnetic field is therefore 1-2 orders of magnitude stronger than the field from the ion channel [Fig 9(a,b)] .
- the fluctuation rate of the aqueous environment is dependent on the self diffusion rate of the water molecules. Using , the fluctuation rate is f" 2 ° ⁇ D H 0 /(2h p ⁇ . This places the magnetic field due to the aqueous solution in the fast-fluctuation regime, with ⁇ H O ⁇ 10 3 -10 4 [Fig. 9 (b) ] , giving a comparatively slow dephasing rate of
- An additional source of background dephasing is the lipid molecules comprising the cell membrane. Assuming magnetic contributions from hydrogen nuclei in the lipid molecules, lateral diffusion in the cell membrane gives rise to a fluctuating B-field, with a characteristic frequency related to the diffusion rate. Atomic hydrogen densities in the membrane are n H ⁇ 3xl0 28 rn ⁇ 3 . At room temperature, the populations of the spin states of hydrogen will be equal, thus the RMS field strength is given by
- the strength of the fluctuating field due to the lipid bilayer is of the order of 10 ⁇ 7 T [Fig. 9 (a) ] .
- the leading-order (gradient -channel) dephasing rate is given by [84] ,
- the electric fields associated with the dissolved ions also interact with the NV centre via the ground state Stark effect.
- the coefficient for the frequency shift as a function of the electric field applied along the dominant (z) axis is given by i? 3D [98] .
- Fluctuations in the electric field may be related to an effective magnetic field via K ' which may be used in an analysis similar to that above.
- An analysis using Debye-H ⁇ ckel theory [102] shows charge fluctuations of an ionic solutions in a spherical region ⁇ of radius R behave as
- a population ensemble may be built up for each lateral point in the sample.
- the signal to noise ratio improves with the dwell times at each point.
- Fig. 10 shows simulated scans of a sodium ion channel with corresponding image acquisition times of 4 , 40 and 400 s. It should be noted here that the spatial resolution available with this technique is beyond that achievable by magnetic field measurements alone, since for large ⁇ , AP ⁇ B 2 ⁇ h ⁇ 6 .
- Similar techniques are employed to temporally resolve a sodium ion channel switch-on event.
- a measurement record sequence, I may be built up.
- the frequency with which measurements may be performed has an upper limit of
- N ⁇ will lead to a longer time lag before a definitive result is obtained.
- N ⁇ is the number of points included in the dynamic averaging.
- N ⁇ is the number of points included in the dynamic averaging.
- ⁇ P ⁇ ⁇ P( ⁇ ,h p ,T 2 ) P o ⁇ -P 0n .
- the temporal resolution depends on the width of the dynamic average and is given by ⁇ t ⁇ N ⁇ ( ⁇ + ⁇ m ) , giving the relationship
- Fig. 11 (b) shows the optimal temporal resolution as a function of T 2 . It can be seen that ⁇ t improves monotonically with T 2 until T 2 exceeds the dephasing time due to the fluctuating background fields [Fig. 11 (a)] . Beyond this point no advantage is found from extending T 2 .
- the contrast between P off and P 0n is too small to be resolvable due to the T 2 limited temporal resolution, as given in Fig. 11 (b) .
- This may be improved via the manufacturing of nanocrystals with improved T 2 times, allowing for longer interrogation times [dashed curves, Fig. 11 (c) ] .
- ⁇ (r) P off (7,,T 0 , ⁇ )-P on (Jr 1 ,r c , ⁇ ) over all NV positions T] and orientations; and ion channel positions r c (and species) ; and maximizing with respect to ⁇ .
- Ion channel activity is expected to be correlated across pixel areas of 1 ⁇ m x 1 ⁇ m, so the population contrast between off and on states is ⁇ «500. This directly translates into an improvement in the temporal resolution by a factor of 1000, opening up the potential for single-shot measurements of ion channel activity across each pixel.
- This embodiment of the method in accordance with the present invention also aims to use decoherence based imaging to detect random magnetic field fluctuations as a result of their impact on the quantum evolution of a quantum probe system. Because many interesting biological processes would be characterized by random field variations and these may average out to zero, the detection of the average field using DC magnetometry would not be suitable. AC detection is more sensitive but relies on precise control of the sample's evolution. The decoherence rate can be an effect measure of such random zero mean fluctuations.
- Figure 13 (a) shows a confocal scanning system that is combined with GHz microwave control and is arranged to introduce, in a controlled manner, fluctuating magnetic fields in an aqueous environment.
- the duration of control pulses is determined to carry out the spin-echo measurements of the de ⁇ oherence .
- the decoherence time corresponds to how the spin-echo signal determined by fluorescence decays as a function of time.
- Figure 14 shows the Rabi data taken from a NV centre in air. The envelope decay corresponds to decoherence processes in the immediate environment .
- Figure 15 shows spin echo results illustrating the decay in coherence as a function of time before and after immersion in pure water.
- This plot in Figure 15 indicates how the quantum coherence of a particular NV centre changes over several microseconds for various immersion conditions. Where the curve flattens out at (6 microseconds in this case) quantum de ⁇ oherence has essentially been lost due to the environmental magnetic fluctuations around the NV (crystal and beyond) . While there are slight differences, after the Rabi pulse has been tuned for the particular immersion condition, air and water have a similar effect. This is an important control experiment that shows that immersion in water (required for biology) does not significantly affect the decoherence time of the NV centre, as theory predicts.
- Figure 16 shows measurements illustrating loss of quantum coherence as a function of time (arbitrary) units for NV- centres immersed in various fluids.
- Figure 17 shows measurements illustrating loss of quantum coherence as a / function of time (arbitrary units) for a high concentration Mn 2+ ions compared to controls .
- the apparatus comprises a quantum probe 10, located at position (x,y), suspended a distance h p above the sample.
- the quantum probe 10 is itself a two-state system (a qubit) , based on charge or spin degrees of freedom, attached to the end of a cantilever probe 10.
- the quantum probe qubit is scanned across the sample while its quantum state is (weakly) monitored, providing a measurement record I xy (t) .
- the probe would be acting as a sensitive electrometer or magnetometer (depending on the type of qubit) , as given in the H xy example, see Figure 18 (c) .
- the use of qubits, or other few state quantum systems, as sensitive magnetometers (or electrometers) has previously been discussed 1"4 as the evolution of a qubit depends very precisely on its electromagnetic environment, providing the possibility of quantum limited detection.
- the sample in this case consists of fluctuators with a non uniform distribution in both spatial density and fluctuation rate.
- the decoherence rate Pxy map (or Fluctuation map), shown in Figure 18 (c), reveals new information about the fluctuator frequency distribution in the sample which was not apparent in the static field map (electrometer/magnetometer image) .
- Combining the decoherence rate Txy map together with the static field map H xy provides a direct window into the distribution and character of the sources of field fluctuations in both space and time, see Figure 18 (d) .
- This image of a 3 -Dimensional surface represents the combined temporal and spatial information, and the height of the peaks indicates the strength of the field, whereas colouration can be used to represent the effective decoherence rate (no colour can be seen in the black and white images presented only shading) .
- controllable quantum devices 5 Thanks (in part) to the ongoing work to construct controllable quantum devices 5 , a number of techniques have been developed to measure the state or evolution characteristics of a quantum system. These include techniques to reconstruct an arbitrary quantum state or process 5 ' 5 , quantum channel 5 ' 7 and the Hamiltonian governing a few state quantum system 8"13 or even spin echo techniques 14 from magnetic resonance. We have focused on the technique of Hamiltonian characterization 8"10 but other techniques can be similarly applied.
- Quantitative Model To make the embodiments of the present invention quantitative, we introduce a simple model for weak continuous measurement 15 which captures all of the essential physics 50 .
- the measurement of the qubit can be modeled as a inefficient (or weak) POVM (Positive Operator Valued Measure) in the ⁇ z basis.
- the density matrix after measurement, p' is given by
- the measurement process consists of repeated weak POVM measurements separated by a time interval ⁇ t, during which time the system undergoes normal evolution.
- the measurement record I(t) is the result, +1 or -1, of a measurement at time t.
- the steady- state autocorrelation of this measurement signal I(t) is then given by
- the measurement strength should be chosen such that this induced decoherence is smaller than both the sample induced decoherence and other intrinsic decoherence sources 51 .
- the spatial resolution of the probe system is ultimately governed by the effective strength of the environmental decoherence as a function of distance.
- Most decoherence channels depend, in some way, on the inverse of the separation between qubit and environment.
- the coupling between a single decoherence (point) source and the probe qubit is, in general, proportional to 1/r 11 , hence the response of the qubit as a function of (x-) position across the sample is given by a exponentiated Lorenztian.
- the Full Width at Half Maximum (FWHM) of this function gives the spatial resolution, where h p is the height of the probe above the sample.
- Example I Imaging the distribution of background charge fluctuators .
- Our first example system comprises an electrostatic qubit interacting with a sample containing background charge fluctuators.
- This example is of particular interest as background charge fluctuations have been the subject of intense scrutiny due to their relevance to solid-state quantum devices and that they are a good example of a nontrivial environmental bath 23 ' 24 .
- a suitable probe qubit would be any of the myriad of charge based 35 qubit designs such as quantum-dots 25 , donors 26 or cooper-pair-box 27"29 .
- a probe based on a cooper-pair-box (CPB) system provides a particularly good example as CPB qubits are now regularly produced experimentally 30"32 and the bias point of the system can be varied, resulting in a change in the sensitivity to different components of the environmental decoherence 23 .
- CPB cooper-pair-box
- the ultimate resolution limit is given by the physical size of the device, in which case a quantum dot or even charge donor system may be better.
- the fluctuators are modeled as point sources but have been enlarged in Figure 13 (a) for clarity.
- the coding of the fluctuator locations depends on the frequency of the fluctuator, in units of the qubit probe frequency.
- the region on the left is a calibration region where the fluctuator frequency varies with position in the region. This will illustrate the frequency selective nature of the measurement process.
- the other regions contain fluctuators with a uniform spatial and 1/f frequency distribution.
- the spatial variation in the Hamiltonian coupling term is then a measure of the electric potential induced by the dipoles (a simple electrometer) .
- the state of the fluctuators will not be static (in general) and the total induced field will result from an average over the fluctuator states .
- Figure 19 (d) is a combined plot of both Figure 19 (b) and
- Figure 19 (c) The vertical scale of the 'mountain range' of Figure 19 (d) corresponds to the varying electric potential across the sample. Some 'mountains' are fluctuators with frequency close to the qubit transition frequency while other 'mountains' corresponds to far off resonant 45 fluctuators. (Although it is not possible to show this in these drawings, colour shading can be used to differentiate theses two different kinds of peaks) .
- the effective field (static) is a surface plot with shading corresponding to the decoherence rate (dynamics) .
- the frequency selective nature of the image is apparent, and fluctuators closest to the probe in energy contribute the most decoherence signal, which are seen as peaks, but other peaks are to due to fluctuators which do not strongly decohere the qubit .
- the frequency sensitivity of the qubit can be tuned to probe different components of the decoherence and obtain more information about its characteristics.
- Example II Imaging the position and spin state of Ferritin molecules .
- the point is neither to image an individual spin 37 or image the location of the molecules 22 ' 38 ' 39 as both can be done with existing technology.
- qubit probe imaging can both map the location of the spins and probe their magnetic dynamics.
- the decoherence introduced at the probe qubit will be a function of both the interaction strength and the flipping rate of the sample spins .
- the flipping rate is slow on the scale of the probe Hamiltonian. This means that the spectral response of the qubit is split, with the separation between the peaks giving the effective difference in the Hamiltonian between the two sample spin states.
- the coupling strength between the spins given the simplified magnetic dipolar model, as illustrated in the insert of Figure 20.
- the ability to resolve the induced coupling is ultimately limited by the total effective decoherence rate of the qubit .
- the ratio of the peaks also gives a measure of the relative spin populations, which in turn relates to the effective temperature and/or flipping mechanism.
- An alternative probe qubit system would be a microSQUID or flux qubit 2 ' 3 ' 27 . This allows easier coupling to the measurement channel, higher precision spectral response measurements and uses demonstrated technology, but it is not a point-source probe. These devices also have the advantage of a tunable working point, which allows adjustment of the qubit 's sensitivity to decoherence.
- Figure 20 shows the maximum fractional Hamiltonian component as a function of probe 10 height for three different spin samples.
- the measurement window is defined between the decoherence rate and the measurement bandwidth.
- the probe height can vary over almost 100 nm and still provide a detectable signal.
- the Figure 20 insert is a diagram that illustrates the simplified magnetic dipolar coupling model, which depends on the separation, orientation and magnetic moment of 5 both the probe and sample spins .
- Figure 21 (a) shows the measured magnetic field over the sample. Note that the probe in this mode (purely acting as a magnetometer) does not successfully resolve two of the spins .
- Figure 21 (b) shows the measured decoherence field over the same sample.
- the decoherence effects in this case splitting of the Rabi peak
- the ratio of the two split peaks provides the population of the spin states, which is in turn directly related to the magnetisation and effective temperature of the sample spin.
- Figure 22 relates to Figure 21 (a) with the noise resulting from a finite bandwidth and dwell time.
- the average pixel error variance is 10 "1 , 10 ⁇ 3 and 10 "5 for the three images respectively. It should be noted that this ignores the effect of noise induced in the detection setup. This additional noise will contribute directly to the measured response spectrum and 20 will add directly to the measurement variance. The result is an increase in measurement times but, provided the detector noise is characterised, this does not restrict the systems ability to characterise the probe and therefore the sample .
- the qubit transition frequency is less important, provided it is at least an order of magnitude greater than the intrinsic decoherence.
- a tunable qubit frequency is advantageous as many types of decoherence depend strongly on the frequency at which they are probed.
- Embodiments of the present invention provide a fundamentally new and complementary imaging mode which takes advantage of current qubit technology and modern techniques for characterising few- state quantum systems. Mapping the induced decoherence across a sample effectively images the dynamics of the environment, providing a new window into the microscopic world with wide applications to spin and charge fluctuations and transport in both solid-state and biological systems .
- V j is the strength of the fluctuator which fluctuates with rate Y j
- the total spectral response is then the sum over each of the fluctuators
- ⁇ p and ⁇ s are the probe and sample spin gyromagnetic ratios
- rr is the vector separation between the spins
- P and S are the probe and sample spin operators .
- references 1 to 105 does not constitute and admission that these references are part of the common general knowledge in any country.
Abstract
A property of a sample is monitored by providing a quantum probe having a quantum state in proximity to the sample, and detecting the quantum decoherence rate of the quantum probe, where said quantum decoherence rate is influenced by the property of the sample. The quantum probe may comprise one or more nitrogen vacancy centres in a diamond material, mounted on a scanning tip, with the decoherence rate detected via emitted fluorescence photons. The decoherence rate may be imaged simultaneously with magnetometer or electrometer based imaging over the sample. The sample may be a biological sample including ion channels, where the function of the ion channel is monitored.
Description
MONITORING SAMPLE VIA QUANTUM DECOHERENCE RATE OF PROBE
Technical Field
The present invention relates to a method and apparatus for monitoring a property of a sample. The present invention relates particularly, though not exclusively, to a method and apparatus for monitoring a nanoscopic property of a sample.
Background Art
Advancement of our understanding of biological and condensed matter systems would greatly benefit from an ability to monitor the structure and dynamics at a molecular level. For example, cell membranes include ion channels and detailed information concerning the activity of the ion channels would be very useful for advancing our understanding of the function of cell membranes and cells.
Two stage quantum probes have been used as a sensitive spatial electrometer or magnetometer to produce images. However, the methods known to date do not allow monitoring processes and dynamics at the nanoscale in a satisfactory manner. There is a need for technological advancement.
Summary of the Invention
The present invention provides in a first aspect a method of monitoring a property of a sample, the method
comprising the steps of: providing a quantum probe having a quantum state; exposing the quantum probe to the sample in a manner such that the property of the sample, in the proximity of the quantum probe, affects quantum coherence of the quantum probe,- and detecting a rate of quantum decoherence of the quantum probe to monitor the property of the sample .
The property of the sample typically is a nanoscopic property.
The present invention opens new avenues in science and technology. The property may relate to a local atomic of molecular property of the sample, such as an electric or a magnetic property. The nanoscopic property may relate to a fundamental spin, such as the spin of an ion, or a charge or a collection thereof. For example, the ion may move thorough an ion channel of a cell membrane in the proximity surface of the quantum probe. The ion influences the decoherence rate of the quantum probe and consequently is detectable using the method in accordance with the embodiments of the present invention and can be resolved both spatially and temporally. In another example the spin may be the spin of a free- radical particle moving in a biological structure.
Quantum probes, for example quantum qubits in quantum information applications, are generally isolated as far
as possible from the environment in order to maintain quantum coherence. Embodiments of the present invention are consequently counterintuitive as they deliberately cause decoherence of the quantum probe and use detection of the decoherence rate to detect properties of the samples in a unique manner.
The quantum probe may comprise a two-state quantum probe (qubit) or multi-state quantum probe, for instance a charge state qubit, or may comprise a number of quantum systems that may be entangled. The quantum probe may be based on electric charge or magnetic spin degrees of freedom. Alternatively, the quantum probe may be any other suitable type of quantum probe .
The quantum probe may be movable relative to the sample or may be stationary relative to the sample. The quantum probe may also be incorporated in the sample.
The quantum probe may comprise a quantum system consisting of a single particle, such as an atom or ion, or comprising a plurality of particles, a portion of a material, a crystal and/or may be positioned in a matrix of a surrounding material. Further, the quantum probe may comprise a plurality of particles sharing a quantum entangled state.
The quantum probe may also be one of a plurality of quantum probes and the step of providing the quantum probe may comprise providing a plurality of quantum
probes, such as an array of the quantum probes. The plurality of quantum probes may comprise any number of quantum probes .
The step of detecting a rate of quantum deσoherence may comprise detecting photons emitted from the plurality of quantum probes. For example, if the quantum probes are provided in the form of an array, the step of setecting the photons may comprise use of a corresponding array of respective detectors.
The quantum probe may comprise one quantum system or a plurality of quantum systems and the step of exposing the quantum probe to the sample may comprise exposing the probe to property of a sample, such as a nanoscopic property associated with single particles or a small group of particles. For example, the nanoscopic property of the sample may be associated with the spin of an ion or a small groups of ions. Alternatively, the quantum probe may also comprise one quantum system or a plurality of quantum systems, but the step of exposing the quantum probe to the sample may comprise exposing the probe to a larger scale property, such as a microscopic or macroscopic property which may be associated with a larger group of particles or with a bulk property of the sample.
In one specific example the quantum probe comprises a diamond material having at least one nitrogen-vacancy (NV) centre. The quantum probe may comprise one NV
centre, but may alternatively also comprise a plurality of NV centres in the diamond material .
The step of providing the quantum probe may comprise transforming the quantum probe into a predefined quantum state, for example a superposition or entangled state in which the quantum probe may be particularly sensitive to magnetic fields. Transforming the quantum probe may comprise the application of suitable radiation. For example, if the quantum probe comprises a NV centre, the step of transforming the quantum probe may comprise exposing the NV- centre to suitable microwave radiation to generate a suitable quantum state of Zeeman energy levels. Further, the method may comprise optically pumping the NV- centre, which may comprise use of a suitable laser such as a laser having a wavelength of the order of 520nm. The step of detection a decoherence rate may comprise detecting fluorescence photons emitted from the NV- centre.
Then method may also comprise the step of controlling the quantum state of the quantum probe by applying suitable radiation. For example, the method may comprise the step of controlling quantum coherence time of the quantum probe by applying suitable radiation.
The method typically comprises the step of moving the quantum probe and the sample relative to each other and performing the method so that the decoherence rate is detectable at a plurality of sample locations. In this
case the method typically comprises the step of generating a line scan or a map of a portion of the sample and showing a distribution of decoherence properties. For example, the method may comprise scanning the quantum probe with NV centre across the surface of the sample.
In one specific embodiment of the present invention the method allows monitoring a function of biological samples typically at the nanoscale . The method may comprise detecting fluctuations or particle, such as ions, in the surface or bulk of the sample. The sample may for example be a cell membrane and may comprise a bi- lipid. The sample may comprise ion channels, such as channels though which single ions diffuse. The method may comprise exposing the sample, or the sample and the quantum probe, to a liquid, such as water, a salt- containing solution, or any other suitable solution. The method may further comprise detecting a change (usually an increase) in quantum decoherence rate caused by an influence of a spin of the particle on the quantum probe and thereby monitoring for example the function of the ion channel . The spin may be a nuclear spin of the particle.
In other embodiments the method may also comprise combining generated decoherence rate maps with maps of other properties, such maps showing electric, magnetic or structural sample properties, which is particularly advantageous for characterising solid state samples.
The method may further comprise generating a map of an effective quantum Hamiltonian as a function of position on the sample . Combining a map of the decoherence rate with a map of the Hamiltonian may provide an image of the sample surface that is a direct window into the distribution and sources of magnetic or electric field fluctuations emanating from the sample surface.
The present invention provides in a second aspect and apparatus for monitoring a property of a sample, the apparatus comprising: a quantum probe that has quantum state; a holder for holding the quantum probe in the proximity of a sample so that the quantum coherence of the quantum probe is influenced by the property of the sample; and a detector for detecting a quantity indicative of a quantum decoherence rate and thereby monitoring the property of the sample .
The property of the sample typically is a nanoscopic property.
The apparatus typically also comprises a source for transforming the quantum probe into the quantum state.
The holder of the apparatus typically comprises a scanning arrangement that is suitable for scanning the quantum probe and the sample relative to each other. In
one specific example the holder comprises an arrangement similar to an atomic force microscope.
In one specific embodiment of the present invention the quantum probe comprises a diamond material having one or a plurality of NV centres. In this case the source for transforming the quantum probe typically comprises a source for emitting microwave radiation suitable for generating a Zeeman shift of energy levels and/or controlling the quantum state of the quantum probe, for example controlling a coherence time of the quantum probe. Further, the apparatus typically comprises an optical light source for optically pumping the at least one NV-centre. The detector typically is a photon detector arranged to detect fluorescence photons emitted from the at least one NV-centre.
The quantum probe may be movable relative to the sample or may be stationary relative to the sample. The quantum probe may also be incorporated in the sample.
The quantum probe may comprise one quantum system or a plurality of quantum systems.
The quantum probe may comprise a quantum system consisting of a single particle such as an atom or ion, or comprising a plurality of particles, a portion of a material, a crystal and/or may be positioned in a matrix of a surrounding material. Further, the quantum probe may comprise a plurality of particles sharing a
quantum entangled state .
The quantum probe may also be one of a plurality of quantum probes and the step of providing the quantum probe may comprise providing a plurality of quantum probes, such as an array of the quantum probes. The plurality of quantum probes may comprise any number of quantum probes .
The detector may also comprise a plurality of detector elements. For example, if the quantum probes are provided in the form of an array, the detector may comprise an array of respective detector elements.
The invention will be more fully understood from the following description of specific embodiments of the invention. The description is provided with reference to the accompanying drawings .
Brief Description of the Drawings
Figure 1 illustrates an NV-centre of a quantum probe in accordance with an embodiment of the present invention;
Figure 2 illustrates energy states of a quantum probe accordance with an embodiment of the present invention;
Figure 3 shows an apparatus for monitoring a property of a sample accordance with an embodiment of the present invention;
Figure 4 illustrates interaction of a biological sample with the quantum probe accordance with an embodiment of the present invention;
Figure 5 shows a measurement illustrating loss of decoherence with time (arbitrary units) ;
Figure 6 shows a simulated map having 7 decoherence rate maxima associated with locations of ion channels (arbitrary units) ;
Figure 7 (a) is a schemtaic diagram showing a single nitrogen- vacancy (NV) defect in a diamond nanocrystal placed on an AFM tip (The unique properties of the NV atomic level scheme allows for optically induced readout and microwave control of magnetic (spin) sub- levels) ;
Figure 7 (b) is a schematic diagram showing a cell membrane nearby the diamond nanocrystal of Figure 7 (a) which is host to channels permitting the flow of ions across the surface (The ion motion results in an effective fluctuating magnetic field at the NV position which decoheres the quantum state of the NV system) ;
Figure 7(c) is a three-dimensional representation of decoherence results in a decrease in fluorescence, which is most pronounced in regions close to the ion channel opening;
Figure 7 (d) is a two dimensional plot of ion channel state against time showing that changes in fluorescence also permit the temporal tracking of ion channel dynamics;
Figure 8 (a) is a schemtaic diagram showing a NV-centre diamond lattice defect;
Figure 8 (b) is an energy level schematic diagram of a—the C3v- symmetric NV system showing NV spin detection through optical excitation and emission cycle (Magnetic sublevels Inx=O and m^=±\ are split by a—D =2.88 GHz in the crystal field. Degeneracy between the ms=±\ sublevels is lifted by a Zeeman shift, δω . Application of 532 nm green light induces a spin-dependent photoluminescence and pumping into the ms=0 ground state) ;
Figure 8 (c) is a two-dimensional graph showing a specific microwave and optical pulse sequence for coherent control and readout ;
Figure 9 (a) is a two dimensional plot showing typical magnetic field signals from water, ion channel and lipid bilayer sources at a probe standoff of 4 nm over a 1 ms timescale;
Figure 9 (b) is a two dimensional plot showing a comparison of σB for various sources of magnetic fields against probe standoff distance;
Figure 9 (c) is a two dimesnional plot showing a fluctuation regime, Θ = /e/^pσB, for magnetic field sources vs probe standoff (Rapidly fluctuating fields (Θ»l) are said to be in the fast-fluctuating limit (FFL) . Slowly fluctuating fields (Θ«l) are in the slow fluctuation limit (SFL) .' The ion channel signal exists in the Θ~l regime, and therefore has an optimal dephasing effect on the NV probe;
Figure 10 is three dimensional plots showing spatial information corresponding to the ion channel as a dephasing source (Relative population differences are plotted for pixel dwell times of 10, 100 and 1000 ms, from left to right respectively. Corresponding image acquisition times are 4, 40 and 400 s) ;
Figure 11 (a) is a two dimensional plot showing dephasing rates due to the sources of magnetic field plotted as a function of probe standoff, hp ;
Figure 11 (b) is a two dimensional plot showing optimum temporal resolution as a function of crystal T2 times for hp = 2 - 6 nm ;
Figure 11 (c) is a two dimensional plot showing temporal resolution as a function of interrogation time, τ , for separations of 2 - 6 nm and r2 = 300μs (Dashed lines show expected improvements from much longer T2 times, T2 » τ ) ;
Figure 12 (a) is a two dimensional plot showing the dependence of temporal resolution ( δt ) and signal variance (δP) on the number of data points included in the running average ( Ns ) ;
Figure 12 (b) is a two dimensional plot showing simulated reconstruction of a sodium ion channel signal with a 200 Hz switching rate using optical readout of an NV centre (blue curve) (The actual ion channel state (on/off) is depicted by the dashed line, and the green line depicts the analytic confidence threshold) ;
Figures 12 (c) - (e) are two dimensional plots showing Fourier transforms of measurement records for stand-offs of 4, 5 and 6 nm respectively (Switching dynamics are clearly resolvable for hp<6 nm, beyond which there is little contrast between decoherence due to the ion channel signal and the background) ;
Figure 13 (a) shows a schematic set-up of components for monitoring a property of a sample in accordance with a specific embodiment of the present invention;
Figure 13 (b) shows diamond crystals having NV-centres in accordance with a specific embodiment of the present invention;
Figure 14 shows a measurement indicating quantum decroherece (arbitrary units) in accordance with a specific embodiment of the present invention;
Figure 15 shows a spin-echo intensity (arbitrary units) as a function of time indicative of quantum decoherence in both air and water environments;
Figure 16 and 17 show spin-echo intensities (arbitrary units) as a function of time indicative of quantum decoherence ;
Figure 18 (a) illustrates an apparatus for monitoring a property in accordance with a specific embodiment of the present invention;
Figure 18 (b) is a series of three signal images, representing respectively a measurement signal, a Correlated signal and a Spectral response;
Figure 18 (c) is a pair of images of the surface, one a static field map and the other a dynamic fluctuation map;
Figure 18 (d) is a 3-D terrain image derived from combination of the static field map and the dynamic fluctuation map of Figure 18 (c) ;
Figure 19 (a) is a series of images of an example sample with uniform distribution of fluctuators (shaded dots) within non-trivial spatial regions (outlined in white) ;
Figure 19 (b) is a series of images (corresponding to Figure 19 (a) ) showing simulated responses of the probe Hamiltonian interacting with a uniformly distributed bath of charge
dipoles, with hp = 0.05L;
Figure 19 (c) is a series of images (corresponding to Figure 19 (b) ) showing the (normalised) Hamiltonian component induced by the background charges plotted as the grey scale.
Figures 19 (d) is a series of images where the corresponding images of Figures 19 (b) and(c) have been combined using the value of (b) for the height and (c) for the colour;
Figure 20 is a graph showing the variation in strength of the maximum signal (φ = 0) as a function of probe height for different sized spins, in this case ferritin molecules;
Figure 21 (a) is a plot of magnetic field strength as measured via the variation in the probe qubit Hamiltonian. The pixel intensity represents the normalized fractional variation in the probe spin Hamiltonian;
Figure 21 (b) is a plot of the effective temperature of each spin, based on the population of the ground and excited states;
Figure 21 (c) is a surface plot of the magnetisation with shading based on the fraction of time spent in the excited spin state of the sample spin; and
Figure 22 is a series of pixilated plots relating to the image of Figure 21 (a) with simulated noise stemming from a finite measurement time; The images from left to right
simulate dwell times of taweii = 2μs, 200μs and 20ms.
Detailed Description of Specific Embodiments
Referring initially to Figure 1 to 4 , operation and function of an apparatus for monitoring a property of a sample in accordance with a specific embodiment of the present invention are initially briefly summarised. The apparatus comprises a diamond crystal containing a nitrogen-vacancy (NV) spin qubit on a nano-scanning tip, microwave spin control, and confocal optical spin readout.
Figure 1 illustrates the NV lattice defect, which has a relatively long coherence times (ms range) at room temperature. Figure 2 shows energy levels of the NV-centre as affected by suitable microwave radiation. Ground state Zeeman levels are put into a superposition state by the microwave radiation. After interaction with the sample the state is read-out systematically to determine the local decoherence rate, which is highly sensitive to effective magnetic field fluctuations at the nanoscale. The read-out involves use of a laser (not shown) having a wavelength of approximately 520nm.
Figure 3 illustrates the NV system being scanned over a sample. In this example the sample includes a membrane ion- channel. Nuclear spins of the (electron-spin paired) ions form a fluctuating spin current, which dephases the NV spin states over a characteristic timescale .
Figure 4 illustrates the interaction of the quantum probe with the ion-channel and Figure 5 shows a measurement illustrating loss of quantum coherence with time (arbitrary units) .
Figure 6 shows a simulated map having 7 maxima that coincide with locations of ion cannels . The simulations for generation of the map take into account various background sources of dephasing (diffusion of electrolytic and lipid bi- layer components) and their associated (fast) timescales show that the operation of a single ion channel (or several) can be detected and resolved spatially and temporally in a scanning decoherence measurement forming a unique image of bio-function at the nanoscale.
Referring now to Figure 7 to 12 , apparatus and methods for monitoring a property of a sample in accordance with another specific embodiment of the present invention are described.
In drug discovery research there is a need for non- invasive detection of cell membrane ion channel operation with wide- field capability [65] . Existing techniques are generally invasive [66] , require specialized nano structures [67-70] , or are only applicable to certain ion channel species [71] . Quantum nanotechnology may be used to address at least some of these problems. The nitrogen-vacancy (NV) centre in nano- diamond is currently of great interest as a novel single atom quantum probe for nanoscale processes [72-84] . However, until now, beyond the use of diamond nanocrystals as fluorescence
markers [73-77] , nothing was known about the quantum behaviour of a NV probe in the complex room temperature extra-cellular environment. What follows is an exploration of the quantum dynamics of a NV probe in proximity to the ion channel, lipid bilayer and surrounding aqueous environment. Results indicate that real-time detection of ion channel operation at millisecond resolution is possible by directly monitoring the quantum decoherence of the NV probe . With the potential to scan and scale-up to an array-based system this conclusion may have wide ranging implications for nanoscale biology and drug discovery.
The cell membrane is a critical regulator of life. Its importance is reflected by the fact that the majority of drugs target membrane interactions [69] . Ion channels allow for passive and selective diffusion of ions across the cell membrane [86] , while ion pumps actively create and maintain the potential gradients across the membranes of living cells [87] . To monitor the effect of new drugs and drug delivery mechanisms a wide field ion channel monitoring capability is essential. However, there are significant challenges facing existing techniques stemming from the fact that membrane proteins, hosted in a lipid bilayer, require a complex environment to preserve their structural and functional integrity. Patch clamp techniques are generally invasive, quantitatively inaccurate, and difficult to scale up [87-89] , while black lipid membranes [90,91] often suffer from stability issues and can only host a limited number of membrane proteins .
Instead of altering the way ion channels and the lipid membrane are presented or even assembled for detection, the approach described herein is to consider a novel and inherently non- invasive in-situ detection method based on the quantum decoherence of a single-atom probe [78] . In this context, decoherence refers to the loss of quantum coherence between magnetic sub- levels of a controlled atom system due to interactions with an environment. Such superpositions of quantum states are generally fleeting in nature due to interactions with the environment, and the degree and timescale over which such quantum coherence is lost can be measured precisely. The immediate consequence of the fragility of the quantum coherence phenomenon is that detecting the loss of quantum coherence (decoherence) in a single atom probe offers a unique monitor of biological function at the nanoscale.
The NV probe [Fig. 7] consists of a nano- crystal of diamond containing a nitrogen-vacancy (NV) defect placed at the end of an AFM tip, as recently demonstrated [72] . For biological applications a quantum probe must be submersible to be brought within nanometers of the sample structure, hence the NV system locked and protected in the ultra- stable diamond matrix [Fig. 7 (a)] is the system of choice. Of all the atomic systems known, the NV centre in diamond alone offers the controllable, robust and persistent quantum properties such room temperature nano- sensing applications will demand [73,74,92] , as well as zero toxicity in a biological environment [77,92,93] . Theoretical proposals for the use of diamond nanocrystals containing a NV system as sensitive
nanoscale magnetometers [79-81] have been followed closely by- demonstrations in recent proof-of-principle experiments [72,82,83] . However, such nanoscale magnetometers employ only a fraction of the potential of the quantum resource at hand and do not have the sensitivity to detect the minute magnetic moment fluctuations associated with ion channel operation. In contrast, results described below show that measuring the quantum decoherence of the NV induced by the ion flux provides a highly sensitive monitoring capability for the ion channel problem, well beyond the limits of magnetometer time- averaged field sensitivity [84] .
In order to determine the sensitivity of the NV probe to the ion channel signal the lipid membrane, embedded ion channels, and the immediate surroundings are described as a fluctuating electromagnetic environment and quantitatively assess each effect on the quantum coherence of the NV centre. The net magnetic field due to diffusion of nuclei, atoms and molecules in the immediate surroundings of the nanocrystal containing the NV system and the extent to which each source will decohere is considered to be the quantum state of the NV. Over and above these background sources, the decoherence of the NV spin levels is in fact highly sensitive to the particular signal due to the ion flux through a single ion channel. Theoretical findings demonstrate the potential of this approach to revolutionize the way ion channels and potentially other membrane bound proteins or interacting species are characterized and measured, particularly when scale-up and scanning capabilities are considered.
In the following, the quantum decoherence imaging system is described with reference to Fig. 7 and being implemented using an NV centre in a realistic technology platform. The biological system is described, considering the various sources of magnetic field fluctuations due to atomic and molecular processes in the membrane itself and in the surrounding media; and their effect on the decoherence of the optically monitored NV system. Estimates of the sensitivity of the NV decoherence to various magnetic field fluctuation regimes (amplitude and frequency) are made which indicate the ability to detect ion channel switch-on/off events. Also described are large scale numerical simulations of the time evolution of the NV spin system including all magnetic field generating processes. This acts to verify the analytic picture, and provides quantitative results for the monitoring and scanning capabilities of the system.
The energy level scheme of the C 3v -symmetric NV system [Fig. 8(b)] consists of ground (3A), excited (3E) and meta-stable (1A) states. The ground state manifold has spin sub-levels (m = 0,±), which in zero field are split by 2.88 GHz. In a background magnetic field the lowest two states (m = 0,l) are readily accessible by microwave control. An important property of the NV system is that under optical excitation the spin levels are readily distinguishable by a difference in fluorescence, hence spin- state readout is achieved by purely optical means [94,95] . Because of this relative simplicity of control and readout, the quantum properties of the NV system, including the interaction with the immediate crystalline environment, have been well probed [96,97] .
Remarkably for the decoherence imaging application, the coherence time of the spin levels is very long even at room temperature: in type Ib nanocrystals T2~\μs , and in isotopically engineered diamond can be as long as 1.8 ms [83] with the use of a spin-echo microwave control sequence [Fig. 8(c)] .
Typical ion channel species K+, Ca2+, Na+, and nearby water molecules are electron spin paired, so any magnetic signal due to ion channel operation will be primarily from the motion of nuclear spins . Ions and water molecules enter the channel in thermal equilibrium with random spin orientations, and move through the channel over a μ s timescale. The monitoring of ion channel activity occurs via measurement of the contrast in probe behavior between the on and off states of the ion channel. This then requires the dephasing due to ion channel activity to be at least comparable to that due to the fluctuating background magnetic signal. The decoherence of the NV quantum state due to the diffusion of water molecules, buffer molecules, saline components as well as the transversal diffusion of lipid molecules in the cell membrane must therefore be accounted for.
The ftth nuclear spin with charge qn , gyromagnetic ratio γn, velocity vn and spin vector Sn, interacts with the NV spin vector P and gyromagnetic ratio γp through the time- dependent dipole dominated interaction:

where K^ ≡ μo4πϊι2γpγn are the probe-ion coupling strengths, and rn(t) is the time-dependent ion-probe separation. Additional Biot-Savart fields generated by the ion motion, both in the channel and the extracellular environment, are several orders of magnitude smaller than this dipole interaction and are neglected here. Any macroscopic fields due to intracellular ion currents are of nano-Tesla (nT) order and are effectively static over T2 timescales. These effects will thus be suppressed by the spin-echo pulse sequence.
Fig. 9 (a) shows typical field traces at a probe height of 1- lOnm above the ion channel, generated by the ambient environment and the on-set of ion-flow as the channel opens. The contribution to the net field at the NV probe position from the various background diffusion processes dominate the ion channel signal in terms of their amplitude. Critically, since the magnetometer mode detects the field by acquiring phase over the coherence time of the NV centre, both the ion channel signal and background are well below the nT Hz ~m sensitivity limit of the magnetometer over the (~1 ns) self- correlated timescales of the environment. However, the effect of the various sources on the decoherence rate of the NV centre are distinguishable because the amplitude- fluctuation frequency scales are very different, leading to remarkably different dephasing behaviour.
To understand this effect, it is useful to consider the full quantum evolution of the NV probe . In the midst of this environment the probe's quantum state, described by the density matrix p(t) , evolves according to the Liouville equation, (dIdt)p(t) = -ih[H(t)p(t)-p(t)H(t)] , where p(t) is the incoherent thermal average over all possible unitary evolutions of the entire system, as described by the full Hamiltonian, H = Hnv +Hiπt +Hbg, where Hnv is the Ηamiltonian of the NV system, and Hmt describes the interaction of the NV system with the background environment (e.g. diffusion of ortho spin water species and ions in solution) and any intrinsic coupling to the local crystal environment (e.g. due to 13C nuclei or interface effects) . The evolution of the background system due to self interaction is described by Hbg , which, in the present methodology, is used to obtain the noise spectra of the various background processes. The following analysis assumes dephasing to be the dominant decoherence channel in the system. Relaxation processes are ignored since all magnetic fields considered are at least 4 orders of magnitude less than the effective crystal field of D/χp~0.2 T, and are hence unable to flip the probe spin over relevant timescales. Phonon excitation in the diamond crystal lead to relaxation times of the order of 100 s [83] and may also be ignored. Before moving onto the numerical simulations, it is useful to consider some important features of the problem.
The decoherence rate of the NV centre is governed by the accumulated phase variance during the control cycle. Maximal
dephasing due to a fluctuating field will occur at the crossover point between the fast (FFL) and slow (SFL) fluctuation regimes [84] . A measure of this cross-over point is the dimensionless ratio Θ≡/e/^pσs, where τe = \/fe is the correlation time of the fluctuating signal, with cross-over at Θ~l. The field standard deviation σg' due to the random nuclear spin of ions and bound water molecules moving in an ion channel (ic) can be estimated as:
σ, Λon+NH OμHO.
The fluctuation strength of the ion channel magnetic field, σg' , is plotted in Fig. 9 (b) as a function of the probe stand-off distance, hp . Ion flux rates are of the order of ~5xlO~4 ionsns~!nm~2 [98], giving an effective dipole field fluctuation rate of /e~3xl04Hz. For probe-channel separations of 2-8nm, values of Θ range from 0.4 to 40 [Fig. 9(c)] . Thus, the ion channel flow hovers near the cross-over point, with an induced dephasing rate of ric ~104 -105Hz .
Considering the dephasing effects of the various sources of background magnetic fields, the first source of background noise is the fluctuating magnetic field arising from the motion of the water molecules and ions throughout the aqueous solution. Due to the nuclear spins of the hydrogen atoms, liquid water consists of a mixture of spin neutral (para) and spin-1 (ortho) molecules. The equilibrium ratio of ortho to para molecules (OP ratio) is 3:1 [99], making 75% of water
molecules magnetically active. In biological conditions, dissolved ions occur in concentrations 2-3 orders of magnitude below this and are ignored here (they are important however for calculations of the induced Stark shift, see below) . The RMS strength of the field due to the aqueous solution is

This magnetic field is therefore 1-2 orders of magnitude stronger than the field from the ion channel [Fig 9(a,b)] . The fluctuation rate of the aqueous environment is dependent on the self diffusion rate of the water molecules. Using
 , the fluctuation rate is f"2° ~ DH 0/(2hp} . This places the magnetic field due to the aqueous solution in the fast-fluctuation regime, with ΘH O~103-104 [Fig. 9 (b) ] , giving a comparatively slow dephasing rate of
^H o ~ fe 2 ΘH 2 O~100HZ and corresponding dephasing envelope

An additional source of background dephasing is the lipid molecules comprising the cell membrane. Assuming magnetic contributions from hydrogen nuclei in the lipid molecules, lateral diffusion in the cell membrane gives rise to a fluctuating B-field, with a characteristic frequency related to the diffusion rate. Atomic hydrogen densities in the membrane are nH ~3xl028rn~3. At room temperature, the
populations of the spin states of hydrogen will be equal, thus the RMS field strength is given by

The strength of the fluctuating field due to the lipid bilayer is of the order of 10~7 T [Fig. 9 (a) ] . The Diffusion constant for lateral Brownian motion of lipid molecules in lipid bilayers is DL = 2xlO~15m2s~' [98] , giving a fluctuation frequency of /e L~125Hz and @L~\0~A [Fig. 9 (d) ] . At this frequency, any quasi-static field effects will be predominantly suppressed by the spin-echo refocusing. The leading-order (gradient -channel) dephasing rate is given by [84] ,
ΓL~-™Θ^/.L+O(Θ^/.L),
2V2V2
giving rise to dephasing rates of the order FL~100 Hz, with
-rV corresponding dephasing envelope Dt(t) = e L .
The electric fields associated with the dissolved ions also interact with the NV centre via the ground state Stark effect. The coefficient for the frequency shift as a function of the electric field applied along the dominant (z) axis is given by i?3D
 [98] . Fluctuations in the electric field may be related to an effective magnetic field via
K
[98] . Fluctuations in the electric field may be related to an effective magnetic field via
K
 ' which may be used in an analysis similar to that above. An analysis using Debye-Hύckel theory [102] shows charge fluctuations of an ionic solutions in a spherical region Λ of radius R behave as
(Ql) = DEkBT(l +κR)e^\R∞άι(κR)-22^\
L K J
where Dn is the diffusion coefficient of the electrolyte, and K is the inverse Debye length ( /D ) ;
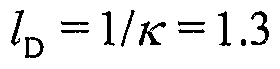 nm for biological conditions. Whilst this analysis applies to a region Λ embedded in an infinite bulk electrolyte system, simulation results discussed below show very good agreement when applied to the system considered here. Eq. 6 is used to obtain the electric field variance, aE=^(E2)-(E)2 , as a function of hp . Relaxation times for electric field fluctuations are τf = εεopE [103], where pn is the resistivity of the electrolyte, giving /e E ~l/τe E = 1.4XlO9Hz under biological conditions. Given the relatively low strength [Fig. 9 (a) ] and short relaxation time of the effective Stark induced magnetic field fluctuations (Θ:10s) [Fig. 9 (b) ] , it is expected that the charge fluctuations associated with ions in solution has little effect on the evolution of the probe.
The problem of non-invasively resolving the location of a sodium ion channel in a lipid bilayer membrane is now considered. When the channel is closed, the dephasing is the result of the background activity, and is defined by
Doff = DH 20DLDED13 C . When the channel is open, the dephasing envelope is defined by Don=DofrDic . Maximum contrast will be achieved by optimising the spin-echo interrogation time, τ , to ensure Doff-Don is maximal. Thus for τ « T2/2 in the vicinity of an open channel we expect an ensemble ground state population of , and
 otherwise. By scanning over an open
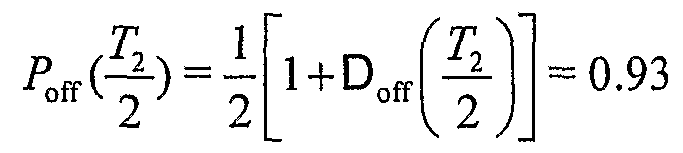 ion channel and monitoring the probe via repeated measurements of the spin state, a population ensemble may be built up for each lateral point in the sample. The signal to noise ratio improves with the dwell times at each point. Fig. 10 shows simulated scans of a sodium ion channel with corresponding image acquisition times of 4 , 40 and 400 s. It should be noted here that the spatial resolution available with this technique is beyond that achievable by magnetic field measurements alone, since for large Θ, AP ∞ B2 ∞ h~6.
Similar techniques are employed to temporally resolve a sodium ion channel switch-on event. By monitoring a single point, a measurement record sequence, I, may be built up. In an experimental situation, the frequency with which measurements may be performed has an upper limit of
/m = (r +τm +r2π.)"' , where rm«900 ns is the time required for photon collection, and τlπ is the time required for all 3 microwave pulses. A potential trade-off exists between the increased dephasing due to longer interrogation times and the
corresponding reduction in measurement frequency. Interrogation times are ultimately limited by the intrinsic T2 time of the crystal. A second trade-off exists between the variance of a given set of Nτ consecutive measurements and the temporal resolution of the probe . For the monitoring of a switching event, the spin state population may be inferred with increased confidence by performing a running average over a larger number of data points, Nτ . However increasing
Nτ will lead to a longer time lag before a definitive result is obtained. The uncertainty in the ion channel state goes as
 where Nτ is the number of points included in the dynamic averaging. We must take sufficient Nτ to ensure that δP < ΔP(τ,hp,T2) = Po{{ -P0n . The temporal resolution depends on the width of the dynamic average and is given by δt ~ Nτ(τ +τm) , giving the relationship
It is desirable to minimise this function with respect to x for a given stand-off (h ) and crystal T2 time.
In reality, not all crystals are manufactured with equal T2 times. An important question is therefore, for a given T2, what is the best achievable temporal resolution? Fig. 11 (b) shows the optimal temporal resolution as a function of T2. It can be seen that δt improves monotonically with T2 until T2
exceeds the dephasing time due to the fluctuating background fields [Fig. 11 (a)] . Beyond this point no advantage is found from extending T2.
A plot of δt as a function of τ is shown in Fig. 11 (c) for standoffs of 2-6 nm. Solid lines depict the resolution that maybe achieved with !T2=300μs. Dashed lines represent the resolution that may be achieved by extending T2 beyond the dephasing times of background fields. We see that δt diverges as τ—>T2 , and is optimal for τ -> 1/Tic .
As an example of monitoring of ion channel behaviour, consider a crystal with a T2 time of 300 μ s at a standoff of 3 nm. Fig. 11 (c) tells us that an optimal temporal resolution of (Sf -1.1 ms may be achieved by choosing r~100μs. This in turn suggests an optimal running average will employ Nτ = δt{v +τπ)~x « 11 data points. Fig. 12 (a) shows a simulated detection of a sodium ion channel switch-on event using Nx = 20,50 and 100 points. The effect of increasing Nτ is shown to give poorer temporal resolution but also produces a lower variance in the signal. This may be necessary if there is little contrast between PQ{{ and P0n . Conversely, decreasing Nτ results in an improvement to the temporal resolution but leads to a larger signal variation.
An ion channel switching between states after an average waiting time of 5 ms (200 Hz) [Fig. 12 (b) ] is now considered. To ensure the condition δP < AP is satisfied, an analysis is
performed using Nx-IO1 giving a resolution of δt∞2 ms . The blue curve shows the response of the NV population to changes in the ion channel state. Fourier transforms of the measurement record, F(l) , are shown in Fig. 12 (c) - (e) . The switching dynamics are clearly resolvable for heights less than 6 nm. The dominant spectral frequency is 100 Hz which is half the 200 Hz switching rate as expected. Beyond 6 nm, the contrast between Poff and P0n is too small to be resolvable due to the T2 limited temporal resolution, as given in Fig. 11 (b) . This may be improved via the manufacturing of nanocrystals with improved T2 times, allowing for longer interrogation times [dashed curves, Fig. 11 (c) ] .
With regard to scale-up to a wide field imaging capability, beyond the obvious extrinsic scaling of the number of single channel detection elements (in conjunction with micro- confocal arrays) , an intrinsic scale-up strategy using many NV centres in a bulk diamond probe, with photons collected in a pixel arrangement, is considered. Since the activity of adjacent ion channels is correlated by the μm scale activity of the membrane, the fluorescence of adjacent NV centres will likewise be correlated, thus wide field detection will occur via a fluorescence contrast across the pixel. Implementation of this scheme involves a random distribution of NV centres in a bulk diamond crystal. The highest NV densities reported in bulk crystals with no neutrally charged NV0 defects are
2.8xlO24 m""3 [104] , giving typical NV- NV couplings of <10 MHz, which are too weak to induce NV spin- flips. It is desirable to seek a balance between increased population
contrast and increased dephasing rates due to higher NV densities .
For ion channel operation correlated across each pixel, the total population contrast ΔΦ between off and on states is obtained by averaging the local NV state population change ΔΦ(r) = Poff(7,,T0,τ)-Pon(Jr1,rc,τ) over all NV positions T] and orientations; and ion channel positions rc (and species) ; and maximizing with respect to τ . As an example, consider a crystal with an NV density of 1024m"3 whose surface is brought within 3 nm of the cell membrane containing an sodium and potassium ion channel densities of ~2xl015m~2 [105] . Ion channel activity is expected to be correlated across pixel areas of 1 μm x 1 μm, so the population contrast between off and on states is ΔΦ«500. This directly translates into an improvement in the temporal resolution by a factor of 1000, opening up the potential for single-shot measurements of ion channel activity across each pixel.
An analysis of the quantum dynamics of a NV diamond probe in the cell -membrane environment has been carried out so as to determined the theoretical sensitivity for the detection, monitoring and imaging of single ion channel function through quantum decoherence . Using current demonstrated technology a temporal resolution in the 1-10 ms range is possible, with spatial resolution at the nanometer level. With the scope for scale-up and novel scanning modes, this fundamentally new detection mode has the potential to revolutionize the characterization of ion
channel action, and possibly other membrane proteins, with important implications for molecular biology and drug discovery.
Referring now to Figure 13 to 17, apparatus and methods for monitoring a nanoscopic property of a sample in accordance with another specific embodiment of the present invention are described.
This embodiment of the method in accordance with the present invention also aims to use decoherence based imaging to detect random magnetic field fluctuations as a result of their impact on the quantum evolution of a quantum probe system. Because many interesting biological processes would be characterized by random field variations and these may average out to zero, the detection of the average field using DC magnetometry would not be suitable. AC detection is more sensitive but relies on precise control of the sample's evolution. The decoherence rate can be an effect measure of such random zero mean fluctuations.
Figure 13 (a) shows a confocal scanning system that is combined with GHz microwave control and is arranged to introduce, in a controlled manner, fluctuating magnetic fields in an aqueous environment.
The following will initially describe establishing a control sample of non-immersed NV- centre in a diamond nanocrystal in air. A region of the sample which has diamond nanocrystals of size roughly 50nm deposited (see Figure 13 (b) is scanned and those crystals containing a single NV centre are identified
through anti-bunching. Optically detected magnetic resonance (ODMR) was conducted by scanning the microwave frequency and watching for the dip in fluorescence corresponding to exciting the magnetic levels of the particular NV centre under observation. From the ODMR the resonance microwave frequency is determined. This resonance frequency microwave signal is applied to the NV centre in a Rabi experiment where the NV fluorescence is monitored as a function of time and the coherence oscillations between the two magnetic levels observed directly. For this microwave power the Rabi period (time between oscillations) is determined.
From this Rabi period the duration of control pulses is determined to carry out the spin-echo measurements of the deσoherence . As described previously, in these measurements the decoherence time corresponds to how the spin-echo signal determined by fluorescence decays as a function of time. Figure 14 shows the Rabi data taken from a NV centre in air. The envelope decay corresponds to decoherence processes in the immediate environment .
Figure 15 shows spin echo results illustrating the decay in coherence as a function of time before and after immersion in pure water. This plot in Figure 15 indicates how the quantum coherence of a particular NV centre changes over several microseconds for various immersion conditions. Where the curve flattens out at (6 microseconds in this case) quantum deσoherence has essentially been lost due to the environmental magnetic fluctuations around the NV (crystal and beyond) .
While there are slight differences, after the Rabi pulse has been tuned for the particular immersion condition, air and water have a similar effect. This is an important control experiment that shows that immersion in water (required for biology) does not significantly affect the decoherence time of the NV centre, as theory predicts.
Figure 16 shows measurements illustrating loss of quantum coherence as a function of time (arbitrary) units for NV- centres immersed in various fluids. Figure 17 shows measurements illustrating loss of quantum coherence as a / function of time (arbitrary units) for a high concentration Mn2+ ions compared to controls .
Referring now to Figure 18 (a) a method and an apparatus for monitoring a property in accordance with a further specific embodiment of the present invention is now described. The apparatus comprises a quantum probe 10, located at position (x,y), suspended a distance hp above the sample. The quantum probe 10 is itself a two-state system (a qubit) , based on charge or spin degrees of freedom, attached to the end of a cantilever probe 10. The quantum probe qubit is scanned across the sample while its quantum state is (weakly) monitored, providing a measurement record Ixy(t) .
At 'each point (x,y) a measurement Ixy(t) is obtained and recorded, see Figure 18 (b) "Measurement signal". This measurement record is then time correlated, see Figure 18 (b) "Correlated signal", and the spectral response Sxy(ω) is computed from the correlated signal, see Figure 18 (b) "Spectral response".
From the spectral response Sxy(ω) a measurement of the effective qubit Hamiltonian Hxy (static magnetometer or electrometer) field map is made, and a decoherence rate Txymap as a function of probe position is obtained, see Figure 12 (c) .
If the components of the Hamiltonian were plotted as a function of position across the sample (Hxy) , the probe would be acting as a sensitive electrometer or magnetometer (depending on the type of qubit) , as given in the Hxy example, see Figure 18 (c) . The use of qubits, or other few state quantum systems, as sensitive magnetometers (or electrometers) has previously been discussed1"4 as the evolution of a qubit depends very precisely on its electromagnetic environment, providing the possibility of quantum limited detection.
Complete analysis of the probe evolution allows the decoherence channel (s) to be extracted, giving information about the strength, direction and character of the dynamics of the environment, as well as the induced static field.
The sample in this case consists of fluctuators with a non uniform distribution in both spatial density and fluctuation rate. The decoherence rate Pxy map (or Fluctuation map), shown in Figure 18 (c), reveals new information about the fluctuator frequency distribution in the sample which was not apparent in the static field map (electrometer/magnetometer image) .
Combining the decoherence rate Txy map together with the static field map Hxy provides a direct window into the distribution and character of the sources of field fluctuations in both space and time, see Figure 18 (d) . This image of a 3 -Dimensional surface represents the combined temporal and spatial information, and the height of the peaks indicates the strength of the field, whereas colouration can be used to represent the effective decoherence rate (no colour can be seen in the black and white images presented only shading) .
Monitoring both the position dependent probe Hamiltonian and decoherence channels allows one to use the scanning quantum system as both a magnetometer/electrometer and as a probe of the decoherence environment simultaneously.
Thanks (in part) to the ongoing work to construct controllable quantum devices5, a number of techniques have been developed to measure the state or evolution characteristics of a quantum system. These include techniques to reconstruct an arbitrary quantum state or process5'5, quantum channel5'7 and the Hamiltonian governing a few state quantum system8"13 or even spin echo techniques14 from magnetic resonance. We have focused on the technique of Hamiltonian characterization8"10 but other techniques can be similarly applied.
Quantitative Model
To make the embodiments of the present invention quantitative, we introduce a simple model for weak continuous measurement15 which captures all of the essential physics50. We assume the measurement of the qubit can be modeled as a inefficient (or weak) POVM (Positive Operator Valued Measure) in the σz basis. The density matrix after measurement, p', is given by
P —
Tr[Aj,.A±/1>]
(8)
for a measurement operator
(9)
with some measurement strength K. The measurement process consists of repeated weak POVM measurements separated by a time interval Δt, during which time the system undergoes normal evolution. The measurement repetition interval is then a measure of the bandwidth of the detector, BW = 1/Δt.
The measurement record I(t), is the result, +1 or -1, of a measurement at time t. The steady- state autocorrelation of this measurement signal I(t) is then given by
Where ^IMO)) ±s the Fourier transform of the (ensemble averaged) expectation value of the σz operator. From this response spectrum, we extract the Hamiltonian and decoherence parameters directly9'10 for each spatial location across the sample.
In the limit of small K, this model is equivalent15 to more complicated master equation models15'18"21. Expanding the evolution to first order in both K and Δ t , we can derive an equivalent Lindbladian master equation with an effective σz decoherence channel of strength
(12)
which corresponds to the measurement induced decoherence . In general , the measurement strength should be chosen such that this induced decoherence is smaller than both the sample induced decoherence and other intrinsic decoherence sources51.
We can also calculate the information extracted from the
system at each measurement step by looking at the reduction in entropy of the system. Expanding for small K, this gives
ΔSE = SR(p) - SBO/) = -~^ + (P(K3)
(13)
as the information obtained (in bits) from a single measurement of an initially mixed state. So, it is clear that we have a trade off. As we increase K or the bandwidth, the amount of information obtained in a given time interval is increased, Eq. (11) , at the expense of greater measurement induced decoherence, Eg. (12) .
The spatial resolution of the probe system is ultimately governed by the effective strength of the environmental decoherence as a function of distance. Most decoherence channels (for solid-state qubits) depend, in some way, on the inverse of the separation between qubit and environment. The coupling between a single decoherence (point) source and the probe qubit is, in general, proportional to 1/r11, hence the response of the qubit as a function of (x-) position across the sample is given by a exponentiated Lorenztian. The Full Width at Half Maximum (FWHM) of this function gives the spatial resolution, where hp is the height of the probe above the sample. By inspection, we see an electric dipole induced potential
(l/r2) has a FWHM 2hp whereas a magnetic dipolar interaction (1/r3) has slightly better resolution, Δx « 1.53hp. The achievable spatial resolution is lower than (for example) Scanning Tunnelling Microscopy (STM) where the electron
current is exponentially dependent on the sample-probe separation22. The point here is that the information provided by this imaging mode is of a fundamentally different and complementary nature to conventional imaging techniques .
Further Examples
The following will consider in detail two examples in which the effects of a decohering environment on an example probe are simulated. These examples provide both a straightforward illustration of the power of imaging the sample induced decoherence and a test of the feasibility using current and near future technology.
Example I : Imaging the distribution of background charge fluctuators .
Our first example system comprises an electrostatic qubit interacting with a sample containing background charge fluctuators. This example is of particular interest as background charge fluctuations have been the subject of intense scrutiny due to their relevance to solid-state quantum devices and that they are a good example of a nontrivial environmental bath23'24. In this case, we can probe the spatial and frequency distribution of these fluctuators in a way which is not possible using current microscopy techniques .
For this application, a suitable probe qubit would be any
of the myriad of charge based 35 qubit designs such as quantum-dots25, donors26 or cooper-pair-box27"29. A probe based on a cooper-pair-box (CPB) system provides a particularly good example as CPB qubits are now regularly produced experimentally30"32 and the bias point of the system can be varied, resulting in a change in the sensitivity to different components of the environmental decoherence23. Although, for these devices the ultimate resolution limit is given by the physical size of the device, in which case a quantum dot or even charge donor system may be better.
For generality, this analysis does not assume a particular qubit implementation, modelling the qubit purely as a two- state system which interacts via a field dependent component in its Hamiltonian (see Methods section I below) . For this reason, all the dimensions in this example are given in terms of a normalized length scale (L) .
We consider a 2D surface which contains background charge fluctuators that we wish to image. We use a simplified model of these fluctuators in the fast fluctuator limit, to illustrate the concepts. (In example II, we will consider a more specific example in the slow fluctuator limit.)
We take the potential felt by the qubit as a simple electrostatic potential due to a charge defect dipole and simulate the effective decoherence field felt by the qubit due to the fluctuator bath (defects in the sample) . In Figure 13 (a) , we have a fictitious sample 10 containing regions (outlined in white) containing a uniform fluctuator
distribution with an area density of 1000 defects per square (all distances are in normalised units) . The frequencies of these fluctuators are then assumed to be distributed with a 1/f distribution.
The fluctuators are modeled as point sources but have been enlarged in Figure 13 (a) for clarity. As we have not chosen a particular qubit architecture, the coding of the fluctuator locations (shading) depends on the frequency of the fluctuator, in units of the qubit probe frequency. The region on the left is a calibration region where the fluctuator frequency varies with position in the region. This will illustrate the frequency selective nature of the measurement process. The other regions contain fluctuators with a uniform spatial and 1/f frequency distribution.
The variation of the probe Hamiltonian, Hxy, due to the presence of background charges is shown in Figure 13 (b) . The background charges are taken to be charge dipoles24'33 coupling to the qubit as l/r2 and the probe is positioned hp
= 0.05L above the sample. Initially assuming the fluctuators to be static, the spatial variation in the Hamiltonian coupling term is then a measure of the electric potential induced by the dipoles (a simple electrometer) . The state of the fluctuators will not be static (in general) and the total induced field will result from an average over the fluctuator states .
In Figure 18 (c) , we calculate the decoherence effect felt by the probe due to the combined effects of all the
fluctuators in our fictitious sample. The effective decoherence (normalized) rate felt by the qubit is illustrated as a function of position. The qubit is now sensitive to the 1/f nature of the fluctuator bath, with a relatively small number of fluctuators contributed a large fraction of the decohering effect. The resolution (for this example only) increases by a factor of 1.55, compared to measuring the Hamiltonian, as * T <x S(ω) ∞ l/r _ Comparing these images, we see that the decoherence measurement is more sensitive to a select few of the fluctuators whose frequency are closest to the probe energy (as is expected for a 1/f distribution) . It is known that, for a
40 1/f bath, a relatively small fraction of the total fluctuators contributed a large amount of the total decoherence23 but here we see it strikingly depicted in the images .
To further demonstrate the utility of mapping both Hamiltonian and decoherence components simultaneously, Figure 19 (d) is a combined plot of both Figure 19 (b) and
Figure 19 (c) . The vertical scale of the 'mountain range' of Figure 19 (d) corresponds to the varying electric potential across the sample. Some 'mountains' are fluctuators with frequency close to the qubit transition frequency while other 'mountains' corresponds to far off resonant 45 fluctuators. (Although it is not possible to show this in these drawings, colour shading can be used to differentiate theses two different kinds of peaks) . In this case, the effective field (static) is a surface plot with shading corresponding to the decoherence rate (dynamics) . The
frequency selective nature of the image is apparent, and fluctuators closest to the probe in energy contribute the most decoherence signal, which are seen as peaks, but other peaks are to due to fluctuators which do not strongly decohere the qubit .
In principle, the frequency sensitivity of the qubit can be tuned to probe different components of the decoherence and obtain more information about its characteristics.
Example II: Imaging the position and spin state of Ferritin molecules .
The following will consider the imaging of (bio) molecules with large uncompensated spin, such as 15 Horse- spleen
Ferritin34'35 or Fe83S- Here, the point is neither to image an individual spin37 or image the location of the molecules22'38'39 as both can be done with existing technology. We show that qubit probe imaging can both map the location of the spins and probe their magnetic dynamics.
The decoherence introduced at the probe qubit will be a function of both the interaction strength and the flipping rate of the sample spins . As we are considering large sample spins in a static magnetic field at low temperature, we will assume that the flipping rate is slow on the scale of the probe Hamiltonian. This means that the spectral response of the qubit is split, with the separation between the peaks giving the effective difference in the Hamiltonian between the two sample spin states.
We compute the coupling strength between the spins, given the simplified magnetic dipolar model, as illustrated in the insert of Figure 20. The ability to resolve the induced coupling is ultimately limited by the total effective decoherence rate of the qubit . The ratio of the peaks also gives a measure of the relative spin populations, which in turn relates to the effective temperature and/or flipping mechanism.
In Figure 20, using experimentally realistic parameters for both the probe qubit and the sample spin, we plot the response of the system as it passes over the spin. We use a 35 Nitrogen-Vacancy centre in diamond as our probe spin, as this has been shown to be a controllable, well isolated spin system which displays stable quantum coherent properties up to room temperature40"47. We then couple this probe to a bulk spin of order M0 = 50 - 200μB and include the effects of intrinsic decoherence and finite measurement bandwidth.
An alternative probe qubit system would be a microSQUID or flux qubit2'3'27. This allows easier coupling to the measurement channel, higher precision spectral response measurements and uses demonstrated technology, but it is not a point-source probe. These devices also have the advantage of a tunable working point, which allows adjustment of the qubit 's sensitivity to decoherence.
For our example, we use known system parameters for an NV
centre driven by a microwave loop and readout via a laser probe measurement48. We take the Rabi frequency of the qubit to be 10MHz, the measurement bandwidth BW = 10OMHz but not necessarily 'strong' and the intrinsic decoherence rate is approximately 100 times slower than the Rabi frequency. The measurement strength K is chosen such that the measurement induced decoherence is weaker than the intrinsic decoherence, for a given detector bandwidth.
Figure 20 shows the maximum fractional Hamiltonian component as a function of probe 10 height for three different spin samples. The measurement window is defined between the decoherence rate and the measurement bandwidth. The probe height can vary over almost 100 nm and still provide a detectable signal. The Figure 20 insert is a diagram that illustrates the simplified magnetic dipolar coupling model, which depends on the separation, orientation and magnetic moment of 5 both the probe and sample spins .
In Figure 21, we create an image from a fictitious sample consisting of 4 mesoscopic spins with varying net magnetisation. We assume the spins are in thermal equilibrium with the sample substrate (which we have set at T = 4K) and that they are flipping due to thermal processes52. The white/black circles indicate the position and diameter (8nm) of the sample spin and enclosing molecules. The detection limits discussed earlier for maximum and minimum detectable field are included in this calculation.
The magnetisations are M0 = 50, 70, 100 and 200μB and the average population of the excited state is given by a Boltzmann distribution for a background magnetic field of B = 0. IT and temperature T = 4K. The spatial resolution of the probe position is a 50x50 grid, giving 2500 points over lOOOOnm2 and the probe height was set to hp = 20nm.
Figure 21 (a) shows the measured magnetic field over the sample. Note that the probe in this mode (purely acting as a magnetometer) does not successfully resolve two of the spins .
Figure 21 (b) shows the measured decoherence field over the same sample. As each spin has a different magnetisation, the decoherence effects (in this case splitting of the Rabi peak) resulting from each spin are different. The ratio of the two split peaks provides the population of the spin states, which is in turn directly related to the magnetisation and effective temperature of the sample spin.
In this plot, the ratio of the split peaks has been used to code the data, with deep shading indicating both a large spin magnetisation (or low effective temperature) and a small magnetisation (high temperature) . The intensity of the shading is given purely by the amount of signal available from each decoherence source (compared to the probe spin's intrinsic decoherence), whereas in Figure 4 (a) , the intensity was proportional to the total induced field. Colour coding could again be used to differentiate the large and small magnetisations.
Finally, we can combine this data to produce a plot showing the field intensity with each decoherence source (mesoscopic spin) tagged based on its effective temperature. This is shown in Figure 21 (c) where the existence of all four spins can be detected based on the height (two are merged) , in contrast to the magnetometer scan alone where only two spins were detected. The height and greyscale are normalised as per (a) and (b) respectively. The flat area corresponds to a region where the Rabi splitting is not large enough to resolve the spin populations with these measurement parameters.
While we have demonstrated that new information can be obtained by looking at the induced decoherence, this is only useful if the information can be obtained within an experimentally accessible time. Using the measurement model discussed earlier, we can estimate the parameter uncertainties in the Hamiltonian characterisation process. Retaining the parameters from Example II, we calculate the noise expected for a finite dwell time (taweii) on each pixel and the total image acquisition time (ta) .
Figure 22 relates to Figure 21 (a) with the noise resulting from a finite bandwidth and dwell time. The images from left to right simulate dwell times of tdweii = 2μs, 200μs and ■ 20ms, which give a total acquisition time for a 50 x 50 grid (2500 pixels) of ta = 5ms, 0.5s and 15 50s respectively. The average pixel error variance is 10"1, 10~3 and 10"5 for the three images respectively.
It should be noted that this ignores the effect of noise induced in the detection setup. This additional noise will contribute directly to the measured response spectrum and 20 will add directly to the measurement variance. The result is an increase in measurement times but, provided the detector noise is characterised, this does not restrict the systems ability to characterise the probe and therefore the sample .
To allow fast image acquisition times, it is important to have both large detector bandwidth and a large ratio of bandwidth to intrinsic decoherence rate BW /Tq. The qubit transition frequency is less important, provided it is at least an order of magnitude greater than the intrinsic decoherence. However, a tunable qubit frequency is advantageous as many types of decoherence depend strongly on the frequency at which they are probed.
Embodiments of the present invention provide a fundamentally new and complementary imaging mode which takes advantage of current qubit technology and modern techniques for characterising few- state quantum systems. Mapping the induced decoherence across a sample effectively images the dynamics of the environment, providing a new window into the microscopic world with wide applications to spin and charge fluctuations and transport in both solid-state and biological systems .
Method: Example I - Decoherence Due To A Bath Of l/F
Fluctuators
We wish to use a simple model of the decoherence felt by a probe (charge- ) qubit interacting with a bath of l/f fluctuators23'24'33. The numerical parameters used for such a model vary greatly depending on the system and even from sample to sample. Here we are interesting in the functional dependence, rather than the explicit values. We draw heavily from references [33] and [24] as an example.
Consider a qubit interacting with a bath of fluctuators via an interaction Hamiltonian Hint which has the form
■'■ (14)
where σz acts on the qubit and bj destroys (creates) an electron in a localized state in the bath.
The spectral response from the jth fluctuator (in the fast fluctuator limit) is given by
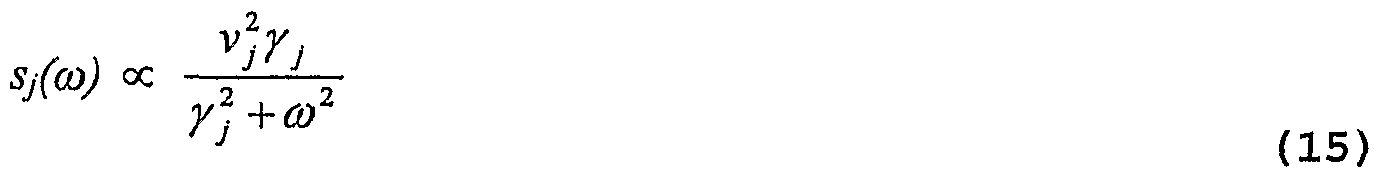
(16)
and a simplified Golden rule model gives the relaxation rate ^ * ' and dephasing rate as
 where Ej is the tunnelling energy of the qubit . Given a functional form for how Vj (r) 30 depends on the fluctuator/qubit separation r, we can then compute the effective decoherence rate felt by the qubit.
Method: Example II - Magnetic Dipolar Coupling Between A Probe And Sample Spin
For this analysis, we will use a simplified (but quite general model) consisting of a probe spin interacting via the magnetic dipolar interaction with a much larger sample spin (see insert of Figure 20) . The sample spin can be considered as a Ferritin, Fe8 or other mesoscopic molecule with a net magnetic moment M0 >> lμB. As the spin is large (and to simplify the analysis of decoherence) we will assume that it is in thermal equilibrium with the sample environment and therefore the average magnetisation and spin flip rates are given by the standard thermodynamic quantities. In making this assumption, we ignore quantum mechanical effects between the probe and sample spins and treat the effect of the sample spin on the probe as a fluctuating classical field.
The magnetic dipolar interaction is given by .14
Hdip=(S)^0 " 7' P.S 3(P.r)(S.r)
(18)
where γp and γs are the probe and sample spin gyromagnetic ratios, rr is the vector separation between the spins and P and S are the probe and sample spin operators .
We assume the system is bathed in a global magnetic field Bgiobai which orientates both the sample and probe spins53 and sets their energy scales. The dipolar interaction is then given by the separation between the spins r and the angle subtended between the spin orientation and the vector separating the spins φ, as illustrated in the insert to Figure 14. The simplified coupling Hamiltonian is then given by
References
All the following references are incorporated herein by reference .
1. B. M. Chernobrod and G. P. Berman, J. Appl . Phys . 97, 014903 (pages 3) (2005) .
2. E. Il'ichev and Y. S. Greenberg, Euro. Phys. Lett. 77, 58005 (5pp) (2007) .
5 3. V. I. Shnyrkov and S. I. Melnik, Low Temp. Phys. 33, 15 (2007) .
4. R. DeSousa, arXiv: cond-mat/0610716 (2006) .
5. M. A. Nielsen and I. L. Chuang, Quantum computation and quantum information (Cambridge University Press,0 Cambridge, 2000) .
6. M. Paris and J. Rehacek, Quantum state estimation, Lecture notes in physics, 649. (Springer, Berlin ; New York, 2004) .
7. M. Mohseni, A. T. Rezakhani, and A. Aspuru-Guzik,S Phys. Rev. A 77, 042320
(pages 5) (2008) .
8. S. G. Schirmer, A. Kolli, and D. K. L. Oi, Phys. Rev. A 69, 050306 (R) (2004) .
9. J. H. Cole, S. G. Schirmer, A. D. Greentree, C. 0 Wellard, D. K. L. Oi, and L. C. L. Hollenberg, Phys. Rev. A 71, 062312 (2005) .
10. J. H. Cole, A. D. Greentree, D. K. L. Oi, S. G. Schirmer, C. J. Wellard, and L. C. L. Hollenberg, Phys. Rev. A 73, 062333 (2006) . 5 11 J. H. Cole, S. J. Devitt, and L. C. L. Hollenberg, J.
Phys. A 39, 14649 (2006) .
12 S. J. Devitt, J. H. Cole, and L. C. L. Hollenberg, Phys. Rev. A 73, 052317 (2006) .
13 T. F. Jordan, A. Shaji, and E. C. G. Sudarshan, Phys.0 Rev. A 76, 012101 (pages 6)
(2007) .
14 C P. Poole and H. A. Farach, The theory of magnetic resonance (Wileylnterscience, New York, 1972) .
15 T. A. Brun, Am. J. Phys. 70, 719 (2002). 5 16 C W. Gardiner, Quantum noise, Springer series in synergetics ; v. 56. (Springer- Verlag, Berlin ; New York, 1991) .
17 M. 0. Scully and M. S. Zubairy, Quantum optics
(Cambridge University Press, 0 Cambridge, 2006) .
18 A. N. Korotkov and D. V. Averin, Phys. Rev. B 64, 165310 (2001) .
15 19 Q. Zhang, R. Ruskov, and A. N. Korotkov, Phys. Rev. B 72, 245322 (pages 11) (2005) .
20 N. P. Oxtoby, H. M. Wiseman, and H. -B. Sun, Phys . Rev. B 74, 045328 (pages 11) (2006) .
21 N. P. Oxtoby, J. Gambetta, and H. M. Wiseman, Phys. Rev. B 77, 125304 (pages 11) (2008) . 22 K. S. Birdi, Scanning Probe Microscopes: Applications in Science and Technology
(CRC Press, Boca Raton ; London ; New York ; Washington D. C. , 2003) .
23 J. Schriefl, Y. Makhlin, A. Shnirman, and G. Sch"on, New J. Phys. 8, 1 (2006) .
24 Y. M. Galperin, B. L. Altshuler, J. Bergli, and D. V. Shantsev, Phys. Rev. Lett. 96, 25 097009 (pages 4) (2006) .
25 D. Loss and D. P. DiVincenzo, Phys. Rev. A 57, 120
(1998) . 26 L. C. L. Hollenberg, A. S. Dzurak, C. Wellard, A. R.
Hamilton, D. J. Reilly, G. J. Milburn, and R. G. Clark,
Phys. Rev. B 69, 113301 (2004) . 27 Y. Makhlin, G. Sch"on, and A. Shnirman, Rev. Mod. Phys.
73 357 (2001) . 28 J. Q. You, X. Hu, S. Ashhab, and F. Nori, Phys. Rev. B
75, 140515 (pages 4) (2007) . 29 J. Koch, T. M. Y., J. Gambetta, A. A. Houck, D. I.
Schuster, J. Majer, A. Blais, M. H. Devoret, S. M.
Girvin, and R. J. Schoelkopf, Phys. Rev. A 76, 042319 (pages 19) (2007) .
30 Y. Nakamura, Y. A. Pashkin, and J. S. Tsai, Nature 398,
786 (1999) .
31 T. Yamamoto, Y. A. Pashkin, O. Stafiev, Y. Nakamura, and J. S. Tsai, Nature 425, 941 (2003) . 32 J. Majer, J. M. Chow, J. M. Gambetta, J. Koch, B. R.
Johnson, J. A. Schreier, L. Frunzio, D. I. Schuster, A. A. Houck, A. Wallraff, et al . , Nature 449, 443 (2007) . 33 E. Paladino, L. Faoro, G. Falci, and R. Fazio, Phys.
Rev. Lett. 88, 228304 (2002) . 34 D. D. Awschalom, J. F. Smyth, G. Grinstein, D. P. DiVincenzo, and D. Loss, Phys. Rev. Lett. 68, 3092 (1992) .
35 J. Tejada, X. X. Zhang, E. del Barco, J. M. Hern'andez, and E. M. Chudnovsky, Phys. Rev. Lett. 79, 1754 (1997). 36 E. d. Barco, J. M. Hernandez, J. Tejada, N. Biskup, R. Achey, I. Rutel, N. Dalai, and
J. Brooks, Phys. Rev. B 62, 3018 (2000) . 37 D. Rugar, R. Budakian, H. J. Mamin, and C. B. W.,
Nature 430, 329 (2004) . 38 H. G. Hansma and J. H. Hoh, Ann. Rev. Biophys . Biomol .
Struct. 23, 115 (1994) .
39 C. I. Pakes, D. P. George, S. Ramelow, A. Cimmino, D. N. Jamieson, and S. Prawer, J. Mag. Mag. Mat. 272-276 (1) , E1231 (2004) . 40 F. Jelezko, C. Tietz, A. Gruber, I. Popa, A. Nizovtsev, S. Kilin, and J. Wrachtrup, Single MoI. 2, 255 (2001) .
41 F. Jelezko, T. Gaebel, I. Popa, A. Gruber, and J. Wrachtrup, Phys . Rev. Lett. 92, 076401 (2004).
42 F. Jelezko, T. Gaebel, I. Popa, M. Domhan, A. Gruber, and J. Wrachtrup, Phys. Rev. Lett. 93, 130501 (2004) .
43 F. T. Charnock and T. A. Kennedy, Phys. Rev. B. 64,
041201 (2001) .
44 T. A. Kennedy, F. T. Charnock, J. S. Colton, J. E. Butler, R. C. Linares, and P. J. Doering, Phys. Status Solidi B 233, 416 (2002) .
45 T. G"abel, M. Domhan, I. Popa, C.Wittmann, P. Neumann, F. Jelezko, J. R. Rabeau, N. Stavrias, A. D. Greentree, S. Prawer, et al . , Nat. Phys. 2, 408 (2006) .
46 R. Hanson, F. M. Mendoza, R. J. Epstein, and D. D. Awschalom, Phys. Rev. Lett. 97, 087601 (2006) .
47 R. Hanson, V. V. Dobrovitski, A. E. Feiguin, 0. Gywat, and D. D. Awschalom, Science 320, 352 (2008) .
48 J. Wrachtrup and F. Jelezko, J. Phys. Cond. Matt. 18, S807 (2006) . 20 49 A. N. Korotkov, Phys.' Rev. B 63, 085312 (2001).
50 In general, any given qubit measurement system requires a more detailed and specific model . Here we present an architecture independent discussion and therefore avoid more complicated treatments. 51 This means operating well above the Korotkov-Averin boundl8,49 so that the 25 sample decoherence effects dominate the signal The exact details of the flipping process are unimportant for this example. We assume they are dominated by thermal processes and obey Boltzmann statistics
53 We ignore the effects of crystal field terms on both the orientation of the sample and probe spin, though this does not decrease the generality of the result
30 54 C. L. Degen, Appl . Phys. Lett. 92, 243111 (2008).
[theory proposal]
55 J. M. Taylor, P. Cappellaro, L. Childress, L. Jiang, D. Budker, P. R. Hemmer, A. Yacoby, R. Walsworth, and M. D. Lukin, Nature Physics, Advance online publication doi:10.1038/nphysl075 (2008) . [theory proposal]
56 J. R. Maze, P. L. Stanwix, J. S. Hodges, S. Hong, J. M. Taylor, P. Cappellaro, L.Jiang, M. V. Gurudev Dutt, E. Togan, A. S. Zibrov, A. Yacoby, R. L. Walsworth, M.
D. Lukin Nature 455, 644 - 647 (02 Oct 2008) , doi : 10.1038/nature07279, [experimental demo]
57 G. Balasubramanian, I. Y. Chan, R. Kolesov, M. Al-Hmoud, J. Tisler, C. Shin, C.
40 Kim, A. Wojcik, P. R. Hemmer, A. Kruger, T. Hanke, A. Leitenstorfer , R. Bratschitsch, F. Jelezko, and J. Wrachtrup, Nature 455, 648 - 651 (02 Oct 2008) , doi: 10.1038/nature07278. [experimental demonstration]
65 K. Lundstrom. CeH. MoI. Life Sci., 63 :2597-2607 , 2006.
66 B. Hillle. Ionic Channels of Excitable Membranes. Sinauer Associates, Sunderland, MA, 3 edition, 2005.
67 Y. Fang and A. Frutos and J. Lahiri . J". Am. Chem. Soc, 124 (1) :2394-2395, 2002.
68 V. Yamazaki and others. BMC Biotechnol . , 5:18, 2005.
69 E. Reimhult and K. Kumar. Trends Biotechnol., 26:82- 89, 2008.
70 R. Jelinek and L. Silbert. MoI. Biosyst . , 5:811-818, 2009.
71 A. Demuro and I. Parker. J". Gen. Physiol., 126:179- 192, 2005. 72 G. Balasubramanian and others. Nature, 455:648-651, 2008.
73 F. Neugart and others . Nano Lett., 7:3588-3591, 2007.
74 C. C. Fu and others. Proc . Natl. Acad. Sci. U.S.A., 104 (3) -.121-132, 2007. 75 J. Chao and others. Biophys. J., 94:2199-2208, 2007.
76 0. Faklaris and others. Small, 4 (12) : 2236-2239 , 2008.
77 A. S. Barnard. Analyst, 134 (9) : 1729-1940 , 2009.
78 J. H. Cole and L. C. L. Hollenberg. arXiv.0811.1913vl
[quant -ph] , 73:062333, 2008. 79 B. M. Chernobrod and G. P. Berman. J". Appl . Phys . , 97:014903, 2004.
80 C. L. Degen. Appl. Phys. Lett., 92:243111, 2008.
81 J. M. Taylor and others. Nature Phys., 4:810-816, 2008. 82 J. R. Maze and others. Nature, 455:644 - 647, 2008.
83 G. Balasubramanian and others. Nature Mat., 8:383-387, 2009.
84 L. T. Hall and others. arXiv: 0907.2292vl [cond- mat.mes-hall] , 73:062333, 2009. 85 T. Ide and others. Jpn. J. Physiol., 52:429, 2002.
86 G. Baaken and others. Lab Chip, 8:938-944, 2008.
87 S. Damjanovich. Biophysical Aspects of Transmembrane Signalling. Springer-Verlag, Berlin, Heidelberg, 1 edition, 2005. 88 E. Fenwick and A. Marty and E. Neher . J. Physiol,
331:599-635, 1982. 89 M. Quick. Transmembrane Transporters. Johnn Wiley &
Sons, Inc, Hoboken, NJ, 1 edition, 2002.
90 P. Mueller and others. Nature, 194:979 - 980, 1962. 91 P. Mueller and others. J. Phys . Chem. , 67:534-535, 1962.
92 S.J. Yu and others. J". Am. Chem. Soc, 127 (50) : 17604- 17605, 2005.
93 A.M. Schrand and others. J. Phys. Chem. B. Lett., 111:2-7, 2006.
94 F. Jelezko and others. Appl . Phys. Lett., 81:2160- 2162, 2002.
95 F. Jelezko and J. Wrachtrup. Phys. Stat. Sol., 203:3207 - 3225, 2006. 96 F. Jelezko and others. Phys. Rev. Lett., 92:3207 - 3225, 2004.
97 R. Hanson and others. Science, 320:352-355, 2008.
98 H. Leontiadou and others. Biophys. J., 92:4209-4215, 2007. 99 Vladimir I. Tikhonov and Alexander A. Volkov. Science, 296:2363, 2002.
100 H. Bannai and others. Nature Protocols, 1:2628-2634, 2006.
101 E. van Oort and M. Glasbeek. Chem. Phys. Lett., 168 (6) :529-532, 1990.
102 Y. C. Kim and M. E. Fisher. Phys. Rev. E, 77:051502, 2008.
103 J. A. Fornes. J. Colloid Interface Sci., 222:97-102, 2000. 104 V. M. Acosta and others. Phys. Rev. B, 80 (11) : 115202 ,
2009.
105 P. Arhem and C. Blomberg. Biosystems, 89:117-125, 2007.
The references are incorporated herein by reference.
Reference that is being made to references 1 to 105 does not constitute and admission that these references are part of
the common general knowledge in any country.
Although the invention has been described with reference to a particular example, it should be appreciated that it could be exemplified in many other forms and in combination with other features not mentioned above.
Claims
1. A method of monitoring a property of a sample, the method comprising the steps of : providing a quantum probe having a quantum state; exposing the quantum probe to the sample in a manner such that the property of the sample, in the proximity of the quantum probe, affects quantum coherence of the quantum probe; and detecting a rate of quantum decoherence of the quantum probe to monitor the property of the sample .
2. The method of claim 1 wherein the property is a nanoscopic property.
3. The method of claim 2 wherein the nanoscopic property relates to a fundamental spin or charge, or collections thereof.
4. The method of any one of the preceding claims wherein the quantum probe comprises a two-state (qubit) or multi-state quantum probe.
5. The method of any one of the preceding claims wherein the quantum probe comprises a diamond material having at least one nitrogen-vacancy (NV) centre.
6. The method of any one of the preceding claims wherein the step of providing the quantum probe comprises transforming the quantum probe into a predefined quantum state.
7. The method of any one of the preceding claims comprising the step of controlling the quantum state of the quantum probe by applying suitable radiation.
8. The method of any one of the preceding claims wherein the step of providing the quantum probe comprises transforming the quantum probe into a superposition or entangled state.
9. The method of claim 8 wherein transforming the quantum probe comprises the application of suitable radiation.
10. The method of claim 9 wherein the quantum probe comprises a NV centre and wherein the step of transforming the quantum probe comprises exposing the NV-centre to suitable microwave radiation to generate a suitable quantum state of the Zeeman energy levels.
11. The method of claim 10 comprising optically pumping the NV-centre.
12. The method of claim 10 or 11 wherein the step of detection a decoherence rate comprises detecting fluorescence photons emitted from the NV-centre.
13. The method of any one of the preceding claims comprising the step of moving the quantum probe and the sample relative to each other and performing the method so that the decoherence rate is detectable at a plurality of sample locations.
14. The method of any one of the preceding claims comprising the step of generating a map of a portion of the sample and showing a distribution of decoherence properties .
15. The method of any one of the preceding claims comprising detecting fluctuations or particles in the surface or bulk of a biological sample .
16. The method of claim 15 comprising exposing the sample, or the sample and the quantum probe, to a liquid.
17. The method of claim 15 wherein the biological sample includes ion channels and wherein the method comprises detecting an increase in quantum decoherence rate caused by an influence of a spin of ion on the quantum probe and thereby monitoring the function of the ion channel .
18. The method of any one of the preceding claims wherein the quantum probe comprises a quantum system consisting of a single particle.
19. The method of any one of the preceding claims wherein the quantum probe comprises a quantum system including a plurality of particles .
20. The method of any one of the preceding claims wherein the quantum probe is one of a plurality of quantum probes and the step of providing the quantum probe comprises providing a plurality of quantum probes .
21. The method of any one of the preceding claims wherein the step of detecting a rate of quantum decoherence comprises detecting photons emitted from the plurality of quantum probes.
22. The method of claim 1 wherein the property is a microscopic or macroscopic property.
23. An apparatus for monitoring a property of a sample, the apparatus comprising: a quantum probe that has quantum state; a holder for holding the quantum probe in the proximity of a sample so that the quantum coherence of the quantum probe is influenced by the property of the sample; and a detector for detecting a quantity indicative of a quantum decoherence rate and thereby monitoring the property of the sample .
24. The apparatus of claim 23 wherein the property of the sample is a nanoscopic property of the sample.
25. The apparatus of claim 23 or 24 wherein the quantum probe comprises one quantum system.
26. The apparatus of claim 23 or 24 wherein the quantum probe comprises a plurality of quantum systems.
27. The apparatus of any one of claims 23 to 26 wherein the quantum probe is one of a plurality of quantum probes .
28. The apparatus of claim 27 wherein the detector comprises a plurality of detector elements .
29. The apparatus of any one of claims 23 to 28 wherein the quantum probe is movable relative to the sample .
30. The apparatus of any one of claims 23 to 28 wherein the quantum probe is incorporated in the sample.
31. The apparatus of any one of claims 23 to 30 wherein the holder comprises a scanning arrangement that is suitable for scanning the quantum probe and the sample relative to each other.
32. The apparatus of any one of claims 23 to 32 wherein the quantum probe comprises a diamond material having one or a plurality of nitrogen-vacancy (NV) centres.
33. The apparatus of claim 32 comprising an optical light source for optically pumping the at least one NV- centre .
34. The apparatus of any one of claims 23 to 33 comprising a source for transforming the quantum probe into the quantum state .
35. The apparatus of any one of claims 23 to 34 comprising a source for controlling the quantum state of the quantum probe .
36. The apparatus of claim 23 wherein the property of the sample is a microscopic or macroscopic property.
Priority Applications (1)
| Application Number | Priority Date | Filing Date | Title |
|---|---|---|---|
| US13/127,317 US8766630B2 (en) | 2008-11-04 | 2009-11-04 | Method and apparatus for monitoring a property of a sample |
Applications Claiming Priority (2)
| Application Number | Priority Date | Filing Date | Title |
|---|---|---|---|
| AU2008905684 | 2008-11-04 | ||
| AU2008905684A AU2008905684A0 (en) | 2008-11-04 | Quantum Decoherence Microscopy |
Publications (1)
| Publication Number | Publication Date |
|---|---|
| WO2010051580A1 true WO2010051580A1 (en) | 2010-05-14 |
Family
ID=42152385
Family Applications (1)
| Application Number | Title | Priority Date | Filing Date |
|---|---|---|---|
| PCT/AU2009/001434 WO2010051580A1 (en) | 2008-11-04 | 2009-11-04 | Monitoring sample via quantum decoherence rate of probe |
Country Status (2)
| Country | Link |
|---|---|
| US (1) | US8766630B2 (en) |
| WO (1) | WO2010051580A1 (en) |
Cited By (13)
| Publication number | Priority date | Publication date | Assignee | Title |
|---|---|---|---|---|
| GB2483767A (en) * | 2010-09-14 | 2012-03-21 | Element Six Ltd | A microfluidic cell with a diamond sensor comprising a quantum spin defect |
| WO2013040446A1 (en) * | 2011-09-16 | 2013-03-21 | The Trustees Of Columbia University In The City Of New York | High-precision ghz clock generation using spin states in diamond |
| WO2013066446A1 (en) * | 2011-08-01 | 2013-05-10 | The Trustees Of Columbia University In The City Of New York | Conjugates of nano-diamond and magnetic or metallic particles |
| WO2014051886A1 (en) * | 2012-08-22 | 2014-04-03 | President And Fellows Of Harvard College | Nanoscale scanning sensors |
| RU2570471C1 (en) * | 2014-12-15 | 2015-12-10 | Федеральное государственное бюджетное учреждение науки Физико-технический институт им. А.Ф. Иоффе Российской академии наук | Method of determining orientation of nv defects in crystal |
| WO2015199940A1 (en) * | 2014-06-27 | 2015-12-30 | Google Inc. | Method for using nanodiamonds to detect nearby magnetic nanoparticles |
| US9632045B2 (en) | 2011-10-19 | 2017-04-25 | The Trustees Of Columbia University In The City Of New York | Systems and methods for deterministic emitter switch microscopy |
| EP3557492A1 (en) * | 2018-04-18 | 2019-10-23 | Turing Inc. | Optically coupled nitrogen vacancy-defect system sor scalable qubit arrays |
| US10845449B2 (en) | 2016-10-20 | 2020-11-24 | Quantum Diamond Technologies Inc. | Methods and apparatus for magnetic particle analysis using diamond magnetic imaging |
| US11143594B2 (en) | 2017-07-31 | 2021-10-12 | Quantum Diamond Technologies Inc. | Methods and apparatus for sample measurement |
| CN114438161A (en) * | 2022-01-30 | 2022-05-06 | 华中科技大学同济医学院附属协和医院 | Method and system for monitoring influence of drugs on biological sample and radioactive probe |
| RU2775869C1 (en) * | 2021-11-22 | 2022-07-11 | Федеральное государственное бюджетное учреждение науки Физико-технический институт им. А.Ф. Иоффе Российской академии наук | Method for determining distance between nv defect and substitute nitrogen n in diamond crystal |
| US11513115B2 (en) | 2016-12-23 | 2022-11-29 | Quantum Diamond Technologies Inc. | Methods and apparatus for magnetic multi-bead assays |
Families Citing this family (73)
| Publication number | Priority date | Publication date | Assignee | Title |
|---|---|---|---|---|
| WO2012174098A2 (en) * | 2011-06-13 | 2012-12-20 | President And Fellow Of Harvard College | Dynamic decoupling in solid state spin ensembles |
| JP5798244B2 (en) * | 2011-06-13 | 2015-10-21 | プレジデント アンド フェローズ オブ ハーバード カレッジ | Efficient fluorescence detection in solid state spin systems |
| WO2013188732A1 (en) * | 2012-06-14 | 2013-12-19 | The Trustees Of Columbia University In The City Of New York | Systems and methods for precision optical imaging of electrical currents and temperature in integrated circuits |
| WO2013188651A1 (en) * | 2012-06-14 | 2013-12-19 | The Trustees Of Columbia University In The City Of New York | Systems and methods for detection of electric fields, ion exchange, and ph using spectral shift in diamond color centers |
| JP5831947B2 (en) * | 2013-01-09 | 2015-12-09 | 日本電信電話株式会社 | Magnetic field detection apparatus and magnetic field detection method |
| EP2981795B1 (en) | 2013-04-02 | 2018-07-25 | President and Fellows of Harvard College | Nanometer scale quantum thermometer |
| US9664767B2 (en) * | 2013-05-17 | 2017-05-30 | Massachusetts Institute Of Technology | Time-resolved magnetic sensing with electronic spins in diamond |
| WO2014210486A1 (en) * | 2013-06-28 | 2014-12-31 | Dirk Robert Englund | Wide-field sensing using nitrogen vacancies |
| US9779769B2 (en) | 2014-02-19 | 2017-10-03 | Infinitum Solutions, Inc. | Integrated optical nanoscale probe |
| US9778329B2 (en) | 2014-02-19 | 2017-10-03 | Infinitum Solutions, Inc. | Integrated optical nanoscale probe measurement of electric fields from electric charges in electronic devices |
| US9472217B2 (en) | 2014-02-19 | 2016-10-18 | Infinitum Solutions, Inc. | Magnetic write head characterization with nano-meter resolution using nitrogen vacancy color centers |
| US9482612B2 (en) | 2014-11-14 | 2016-11-01 | Infinitum Solutions, Inc. | Photon emitter characterization using photoluminescence quenching in nitrogen vacancy color centers |
| US9486163B2 (en) | 2014-02-21 | 2016-11-08 | Verily Life Sciences Llc | Silicon-vacancy-doped nanodiamonds for molecular and cellular imaging |
| US9245551B2 (en) | 2014-03-18 | 2016-01-26 | Seagate Technology Llc | Nitrogen-vacancy nanocrystal magnetic source sensor |
| US10338162B2 (en) | 2016-01-21 | 2019-07-02 | Lockheed Martin Corporation | AC vector magnetic anomaly detection with diamond nitrogen vacancies |
| US20170212183A1 (en) * | 2016-01-21 | 2017-07-27 | Lockheed Martin Corporation | Method for resolving natural sensor ambiguity for dnv direction finding applications |
| US9829545B2 (en) | 2015-11-20 | 2017-11-28 | Lockheed Martin Corporation | Apparatus and method for hypersensitivity detection of magnetic field |
| US9845153B2 (en) | 2015-01-28 | 2017-12-19 | Lockheed Martin Corporation | In-situ power charging |
| US10012704B2 (en) | 2015-11-04 | 2018-07-03 | Lockheed Martin Corporation | Magnetic low-pass filter |
| US9557391B2 (en) | 2015-01-23 | 2017-01-31 | Lockheed Martin Corporation | Apparatus and method for high sensitivity magnetometry measurement and signal processing in a magnetic detection system |
| US9835693B2 (en) | 2016-01-21 | 2017-12-05 | Lockheed Martin Corporation | Higher magnetic sensitivity through fluorescence manipulation by phonon spectrum control |
| US9817081B2 (en) | 2016-01-21 | 2017-11-14 | Lockheed Martin Corporation | Magnetometer with light pipe |
| US9910104B2 (en) | 2015-01-23 | 2018-03-06 | Lockheed Martin Corporation | DNV magnetic field detector |
| US9824597B2 (en) | 2015-01-28 | 2017-11-21 | Lockheed Martin Corporation | Magnetic navigation methods and systems utilizing power grid and communication network |
| US9638821B2 (en) | 2014-03-20 | 2017-05-02 | Lockheed Martin Corporation | Mapping and monitoring of hydraulic fractures using vector magnetometers |
| US10088336B2 (en) | 2016-01-21 | 2018-10-02 | Lockheed Martin Corporation | Diamond nitrogen vacancy sensed ferro-fluid hydrophone |
| US10520558B2 (en) | 2016-01-21 | 2019-12-31 | Lockheed Martin Corporation | Diamond nitrogen vacancy sensor with nitrogen-vacancy center diamond located between dual RF sources |
| US9853837B2 (en) | 2014-04-07 | 2017-12-26 | Lockheed Martin Corporation | High bit-rate magnetic communication |
| US9910105B2 (en) | 2014-03-20 | 2018-03-06 | Lockheed Martin Corporation | DNV magnetic field detector |
| US10168393B2 (en) | 2014-09-25 | 2019-01-01 | Lockheed Martin Corporation | Micro-vacancy center device |
| GB2540308B (en) | 2014-04-07 | 2018-05-16 | Lockheed Corp | Energy efficient controlled magnetic field generator circuit |
| JP6247177B2 (en) * | 2014-08-20 | 2017-12-13 | 日本電信電話株式会社 | Magnetic field detection method |
| RU2579360C1 (en) * | 2014-11-18 | 2016-04-10 | Федеральное государственное бюджетное образовательное учреждение высшего профессионального образования "Башкирский государственный университет" | Method of excitation and recording of optical phonons |
| WO2016126436A1 (en) | 2015-02-04 | 2016-08-11 | Lockheed Martin Corporation | Apparatus and method for recovery of three dimensional magnetic field from a magnetic detection system |
| WO2016126435A1 (en) | 2015-02-04 | 2016-08-11 | Lockheed Martin Corporation | Apparatus and method for estimating absolute axes' orientations for a magnetic detection system |
| WO2017062735A1 (en) * | 2015-10-08 | 2017-04-13 | President And Fellows Of Harvard College | Ultrahigh resolution dynamic ic chip activity detection for hardware security |
| WO2017087013A1 (en) | 2015-11-20 | 2017-05-26 | Lockheed Martin Corporation | Apparatus and method for closed loop processing for a magnetic detection system |
| WO2017095454A1 (en) | 2015-12-01 | 2017-06-08 | Lockheed Martin Corporation | Communication via a magnio |
| WO2017123261A1 (en) | 2016-01-12 | 2017-07-20 | Lockheed Martin Corporation | Defect detector for conductive materials |
| EP3405603A4 (en) | 2016-01-21 | 2019-10-16 | Lockheed Martin Corporation | Diamond nitrogen vacancy sensor with circuitry on diamond |
| WO2017127097A1 (en) | 2016-01-21 | 2017-07-27 | Lockheed Martin Corporation | Magnetometer with a light emitting diode |
| AU2016388316A1 (en) | 2016-01-21 | 2018-09-06 | Lockheed Martin Corporation | Diamond nitrogen vacancy sensor with common RF and magnetic fields generator |
| RU2631529C2 (en) * | 2016-03-18 | 2017-09-25 | Федеральное государственное бюджетное образовательное учреждение высшего образования "Башкирский государственный университет" | Method for analysing surface on atomic-power microscope using fluorescent quantum dots |
| US10274550B2 (en) | 2017-03-24 | 2019-04-30 | Lockheed Martin Corporation | High speed sequential cancellation for pulsed mode |
| US10345395B2 (en) | 2016-12-12 | 2019-07-09 | Lockheed Martin Corporation | Vector magnetometry localization of subsurface liquids |
| US10317279B2 (en) | 2016-05-31 | 2019-06-11 | Lockheed Martin Corporation | Optical filtration system for diamond material with nitrogen vacancy centers |
| US10145910B2 (en) | 2017-03-24 | 2018-12-04 | Lockheed Martin Corporation | Photodetector circuit saturation mitigation for magneto-optical high intensity pulses |
| US10338163B2 (en) | 2016-07-11 | 2019-07-02 | Lockheed Martin Corporation | Multi-frequency excitation schemes for high sensitivity magnetometry measurement with drift error compensation |
| US20170343621A1 (en) | 2016-05-31 | 2017-11-30 | Lockheed Martin Corporation | Magneto-optical defect center magnetometer |
| US10408890B2 (en) | 2017-03-24 | 2019-09-10 | Lockheed Martin Corporation | Pulsed RF methods for optimization of CW measurements |
| US10677953B2 (en) | 2016-05-31 | 2020-06-09 | Lockheed Martin Corporation | Magneto-optical detecting apparatus and methods |
| US10228429B2 (en) | 2017-03-24 | 2019-03-12 | Lockheed Martin Corporation | Apparatus and method for resonance magneto-optical defect center material pulsed mode referencing |
| US10330744B2 (en) | 2017-03-24 | 2019-06-25 | Lockheed Martin Corporation | Magnetometer with a waveguide |
| US10359479B2 (en) | 2017-02-20 | 2019-07-23 | Lockheed Martin Corporation | Efficient thermal drift compensation in DNV vector magnetometry |
| US10571530B2 (en) | 2016-05-31 | 2020-02-25 | Lockheed Martin Corporation | Buoy array of magnetometers |
| US10281550B2 (en) | 2016-11-14 | 2019-05-07 | Lockheed Martin Corporation | Spin relaxometry based molecular sequencing |
| US10371765B2 (en) | 2016-07-11 | 2019-08-06 | Lockheed Martin Corporation | Geolocation of magnetic sources using vector magnetometer sensors |
| US10527746B2 (en) | 2016-05-31 | 2020-01-07 | Lockheed Martin Corporation | Array of UAVS with magnetometers |
| US10345396B2 (en) | 2016-05-31 | 2019-07-09 | Lockheed Martin Corporation | Selected volume continuous illumination magnetometer |
| US10712408B2 (en) | 2016-11-08 | 2020-07-14 | Massachusetts Institute Of Technology | Methods and apparatus for optically detecting magnetic resonance |
| CN108385163A (en) * | 2017-03-15 | 2018-08-10 | 杨承 | Diamond crystal and inertia motion measuring device based on diamond quantum defect center |
| US10379174B2 (en) | 2017-03-24 | 2019-08-13 | Lockheed Martin Corporation | Bias magnet array for magnetometer |
| US10459041B2 (en) | 2017-03-24 | 2019-10-29 | Lockheed Martin Corporation | Magnetic detection system with highly integrated diamond nitrogen vacancy sensor |
| US10371760B2 (en) | 2017-03-24 | 2019-08-06 | Lockheed Martin Corporation | Standing-wave radio frequency exciter |
| US10338164B2 (en) | 2017-03-24 | 2019-07-02 | Lockheed Martin Corporation | Vacancy center material with highly efficient RF excitation |
| AU2019304104B2 (en) * | 2018-07-20 | 2023-03-09 | Silicon Quantum Computing Pty Limited | A quantum processing system |
| WO2021102593A1 (en) * | 2019-11-29 | 2021-06-03 | Pontificia Universidad Catolica De Chile | System and method for determining and quantifying the concentration of an analyte, which comprises an optically active diamond-based sensor, a chamber accommodating the sensor, and means for inserting a sample; and use of said sensor |
| DE102020123993A1 (en) | 2020-09-15 | 2022-03-17 | Endress+Hauser SE+Co. KG | quantum sensor |
| CN112270411B (en) * | 2020-10-22 | 2022-05-24 | 苏州浪潮智能科技有限公司 | Quantum decoherence degree detection method and device, electronic equipment and storage medium |
| CN112652214B (en) * | 2020-12-31 | 2023-04-28 | 重庆工程职业技术学院 | Quantum decoherence experiment box based on combined multiple radiation sources |
| DE102021100223A1 (en) | 2021-01-08 | 2022-07-14 | Endress+Hauser SE+Co. KG | Sensor device and method for determining and/or monitoring a process variable of a medium in a container |
| WO2023128834A1 (en) * | 2021-12-27 | 2023-07-06 | Общество С Ограниченной Ответственностью "Вандер Технолоджис" | Method for utltra-local optical temperature measurement |
| WO2023153960A1 (en) * | 2022-02-08 | 2023-08-17 | Общество С Ограниченной Ответственностью "Вандер Технолоджис" | Ultralocalized optical heating method and device for carrying out same |
Citations (3)
| Publication number | Priority date | Publication date | Assignee | Title |
|---|---|---|---|---|
| US20010050558A1 (en) * | 2000-03-20 | 2001-12-13 | Jianhui Zhong | Intermolecular multiple-quantum magnetic resonance imaging |
| US20070215861A1 (en) * | 2006-03-20 | 2007-09-20 | Arizona Bd Of Regents/Behalf Of Univ. Of Arizona | Quantum interference effect transistor (quiet) |
| WO2009073736A1 (en) * | 2007-12-03 | 2009-06-11 | President And Fellows Of Harvard College | Spin based magnetometer |
Family Cites Families (7)
| Publication number | Priority date | Publication date | Assignee | Title |
|---|---|---|---|---|
| US3892485A (en) * | 1974-05-06 | 1975-07-01 | Gen Electric | Monitoring apparatus for measuring particles suspended in liquid and for measuring the opacity of the liquid |
| CA1085277A (en) * | 1976-05-27 | 1980-09-09 | James D.B. Smith | Carboxylic acid composition for forming thermoparticulating coating |
| US7328059B2 (en) * | 1996-08-23 | 2008-02-05 | The Texas A & M University System | Imaging of light scattering tissues with fluorescent contrast agents |
| US6218832B1 (en) * | 1999-02-16 | 2001-04-17 | International Business Machines Corporation | Nuclear magnetic resonance quantum computing method with improved solvents |
| US20070194225A1 (en) * | 2005-10-07 | 2007-08-23 | Zorn Miguel D | Coherent electron junction scanning probe interference microscope, nanomanipulator and spectrometer with assembler and DNA sequencing applications |
| US7521928B2 (en) * | 2006-11-07 | 2009-04-21 | Trustees Of Princeton University | Subfemtotesla radio-frequency atomic magnetometer for nuclear quadrupole resonance detection |
| US8467842B2 (en) * | 2010-02-10 | 2013-06-18 | Tokitae Llc | Systems, devices, and methods including multi-harmonic optical detection of hemozoin nanoparticles |
-
2009
- 2009-11-04 US US13/127,317 patent/US8766630B2/en active Active
- 2009-11-04 WO PCT/AU2009/001434 patent/WO2010051580A1/en active Application Filing
Patent Citations (3)
| Publication number | Priority date | Publication date | Assignee | Title |
|---|---|---|---|---|
| US20010050558A1 (en) * | 2000-03-20 | 2001-12-13 | Jianhui Zhong | Intermolecular multiple-quantum magnetic resonance imaging |
| US20070215861A1 (en) * | 2006-03-20 | 2007-09-20 | Arizona Bd Of Regents/Behalf Of Univ. Of Arizona | Quantum interference effect transistor (quiet) |
| WO2009073736A1 (en) * | 2007-12-03 | 2009-06-11 | President And Fellows Of Harvard College | Spin based magnetometer |
Non-Patent Citations (2)
| Title |
|---|
| J.H. COLE ET AL.: "Scanning Quantum Decoherence Microscopy", ARXIV:0811.1913V1 [QUANT-PH], 12 November 2008 (2008-11-12), pages 1 - 8, Retrieved from the Internet <URL:http://lanl.arxiv.org/PSTcache/arxiv/pdf/0811/0811.1913v1.pdf> [retrieved on 20091211] * |
| L.T. HALL ET AL.: "Sensing of Fluctuating Nanoscale Magnetic Fields Using NV Centres in Diamond", ARXIV:0907.2292V1 [COND-MAT.MES-HALL], 14 July 2009 (2009-07-14), pages 1 - 4, Retrieved from the Internet <URL:http://lanl.arxiv.org/PS_cache/arxiv/pdf/0907/0907.2292v1.pdf> [retrieved on 20091211] * |
Cited By (29)
| Publication number | Priority date | Publication date | Assignee | Title |
|---|---|---|---|---|
| GB2483767B (en) * | 2010-09-14 | 2013-05-29 | Element Six Ltd | A microfluidic cell and a spin resonance device for use therewith |
| US8669764B2 (en) | 2010-09-14 | 2014-03-11 | Element Six Limited | Microfluidic cell and a spin resonance device for use therewith |
| GB2483767A (en) * | 2010-09-14 | 2012-03-21 | Element Six Ltd | A microfluidic cell with a diamond sensor comprising a quantum spin defect |
| US9222887B2 (en) | 2011-08-01 | 2015-12-29 | The Trustees Of Columbia University In The City Of New York | Conjugates of nano-diamond and magnetic or metallic particles |
| WO2013066446A1 (en) * | 2011-08-01 | 2013-05-10 | The Trustees Of Columbia University In The City Of New York | Conjugates of nano-diamond and magnetic or metallic particles |
| US9599562B2 (en) | 2011-08-01 | 2017-03-21 | The Trustees Of Columbia University In The City Of New York | Conjugates of nano-diamond and magnetic or metallic particles |
| WO2013040446A1 (en) * | 2011-09-16 | 2013-03-21 | The Trustees Of Columbia University In The City Of New York | High-precision ghz clock generation using spin states in diamond |
| US20140247094A1 (en) * | 2011-09-16 | 2014-09-04 | The Trustees Of Columbia University In The City Of New York | High-precision ghz clock generation using spin states in diamond |
| US9385654B2 (en) * | 2011-09-16 | 2016-07-05 | The Trustees Of Columbia University In The City Of New York | High-precision GHZ clock generation using spin states in diamond |
| US9632045B2 (en) | 2011-10-19 | 2017-04-25 | The Trustees Of Columbia University In The City Of New York | Systems and methods for deterministic emitter switch microscopy |
| US20150253355A1 (en) * | 2012-08-22 | 2015-09-10 | President And Fellows Of Harvard College | Nanoscale scanning sensors |
| US11815528B2 (en) | 2012-08-22 | 2023-11-14 | President And Fellows Of Harvard College | Nanoscale scanning sensors |
| EP2888596B1 (en) | 2012-08-22 | 2022-07-20 | President and Fellows of Harvard College | Nanoscale scanning sensors |
| JP2015529328A (en) * | 2012-08-22 | 2015-10-05 | プレジデント アンド フェローズ オブ ハーバード カレッジ | Nanoscale scanning sensor |
| US10041971B2 (en) | 2012-08-22 | 2018-08-07 | President And Fellows Of Harvard College | Nanoscale scanning sensors |
| CN109765257A (en) * | 2012-08-22 | 2019-05-17 | 哈佛学院院长及董事 | Nanoscale scanning sensor |
| CN104704375A (en) * | 2012-08-22 | 2015-06-10 | 哈佛学院院长及董事 | Nanoscale scanning sensors |
| WO2014051886A1 (en) * | 2012-08-22 | 2014-04-03 | President And Fellows Of Harvard College | Nanoscale scanning sensors |
| US9435791B2 (en) | 2014-06-27 | 2016-09-06 | Verily Life Sciences, LLC | Method for using nanodiamonds to detect nearby magnetic nanoparticles |
| US9555131B2 (en) | 2014-06-27 | 2017-01-31 | Verily Life Sciences Llc | Method for using nanodiamonds to detect nearby magnetic nanoparticles |
| WO2015199940A1 (en) * | 2014-06-27 | 2015-12-30 | Google Inc. | Method for using nanodiamonds to detect nearby magnetic nanoparticles |
| RU2570471C1 (en) * | 2014-12-15 | 2015-12-10 | Федеральное государственное бюджетное учреждение науки Физико-технический институт им. А.Ф. Иоффе Российской академии наук | Method of determining orientation of nv defects in crystal |
| US10845449B2 (en) | 2016-10-20 | 2020-11-24 | Quantum Diamond Technologies Inc. | Methods and apparatus for magnetic particle analysis using diamond magnetic imaging |
| US11513115B2 (en) | 2016-12-23 | 2022-11-29 | Quantum Diamond Technologies Inc. | Methods and apparatus for magnetic multi-bead assays |
| US11143594B2 (en) | 2017-07-31 | 2021-10-12 | Quantum Diamond Technologies Inc. | Methods and apparatus for sample measurement |
| US11614405B2 (en) | 2017-07-31 | 2023-03-28 | Quantum Diamond Technologies Inc. | Methods and apparatus for sample measurement |
| EP3557492A1 (en) * | 2018-04-18 | 2019-10-23 | Turing Inc. | Optically coupled nitrogen vacancy-defect system sor scalable qubit arrays |
| RU2775869C1 (en) * | 2021-11-22 | 2022-07-11 | Федеральное государственное бюджетное учреждение науки Физико-технический институт им. А.Ф. Иоффе Российской академии наук | Method for determining distance between nv defect and substitute nitrogen n in diamond crystal |
| CN114438161A (en) * | 2022-01-30 | 2022-05-06 | 华中科技大学同济医学院附属协和医院 | Method and system for monitoring influence of drugs on biological sample and radioactive probe |
Also Published As
| Publication number | Publication date |
|---|---|
| US8766630B2 (en) | 2014-07-01 |
| US20120019242A1 (en) | 2012-01-26 |
Similar Documents
| Publication | Publication Date | Title |
|---|---|---|
| US8766630B2 (en) | Method and apparatus for monitoring a property of a sample | |
| Cole et al. | Scanning quantum decoherence microscopy | |
| Arai et al. | Fourier magnetic imaging with nanoscale resolution and compressed sensing speed-up using electronic spins in diamond | |
| Kaliva et al. | Nanomaterials characterization | |
| Hong et al. | Nanoscale magnetometry with NV centers in diamond | |
| EP0726444B1 (en) | Magnetic resonance method and apparatus for detecting an atomic structure of a sample along a surface thereof | |
| Pham et al. | Magnetic field imaging with nitrogen-vacancy ensembles | |
| US20180246143A1 (en) | Nanoscale scanning sensors | |
| Sellier et al. | On the imaging of electron transport in semiconductor quantum structures by scanning-gate microscopy: successes and limitations | |
| Grob et al. | Magnetic resonance force microscopy with a one-dimensional resolution of 0.9 nanometers | |
| Yang et al. | Scanning quantum cryogenic atom microscope | |
| Huxter et al. | Scanning gradiometry with a single spin quantum magnetometer | |
| Poulsen et al. | Optimal control of a nitrogen-vacancy spin ensemble in diamond for sensing in the pulsed domain | |
| Li et al. | All-optical quantum sensing of rotational Brownian motion of magnetic molecules | |
| JP2014059192A (en) | Fluorescence microscopy device and method | |
| Boretti et al. | Nanometric resolution magnetic resonance imaging methods for mapping functional activity in neuronal networks | |
| Lim et al. | Scanning localized magnetic fields in a microfluidic device with a single nitrogen vacancy center | |
| Krass et al. | Force-detected magnetic resonance imaging of influenza viruses in the overcoupled sensor regime | |
| Sulania et al. | Atomic and magnetic force studies of co thin films and nanoparticles: understanding the surface correlation using fractal studies | |
| Passeri et al. | Magnetic Force Microscopy and Magnetic Nanoparticles: Perspectives and Challenges | |
| Lee et al. | Imaging oersted field around current flowing wire based on a diamond scanning magnetometer | |
| Myers | Quantum decoherence of near-surface nitrogen-vacancy centers in diamond and implications for nanoscale imaging | |
| Matteucci et al. | Study of the field around magnetic force microscopy probes using electron holography | |
| Tang et al. | Quantum diamond microscope for dynamic imaging of magnetic fields | |
| Tan Kok Cheng | Imaging nanoscale spin textures with scanning diamond quantum microscopy |
Legal Events
| Date | Code | Title | Description |
|---|---|---|---|
| 121 | Ep: the epo has been informed by wipo that ep was designated in this application |
Ref document number: 09824266 Country of ref document: EP Kind code of ref document: A1 |
|
| NENP | Non-entry into the national phase |
Ref country code: DE |
|
| WWE | Wipo information: entry into national phase |
Ref document number: 13127317 Country of ref document: US |
|
| 122 | Ep: pct application non-entry in european phase |
Ref document number: 09824266 Country of ref document: EP Kind code of ref document: A1 |